Thermodynamic and transport anomalies near isotropic-nematic phase transition
Abstract
A theoretical study of the variation of thermodynamic and transport properties of calamitic liquid crystals across the isotropic-nematic phase transition is carried out by calculating the wavenumber (k) and time (t) dependent intermediate scattering function of the liquid, via computer simulations of model nematogens. The objective is to understand the experimentally observed anomalies and sharp variation in many thermodynamic and transport properties, namely specific heat , sound attenuation coefficient , thermal diffusivity and sound velocity are as the I-N transition is approached from the isotropic side. The small wavelength limit of the calculated intermediate scattering function is used to obtain the ratio of specific heats and other properties mentioned above. We find that all of them show non-monotonic variations near the I-N transition, with showing a cusp-like behavior. We suggest that the observed anomalous features are a direct consequence of the existence of pseudo-nematic domains in the system near the phase boundary and the melting and formation of such domains give rise to sound attenuation and also to the observed specific heat anomaly. A theoretical description of these anomalies should invoke translation-rotation coupling at molecular level. While the heterogenous dynamics observed here bear resemblance to that in deeply supercooled liquids near glass transition, the thermodynamic anomalies articulated here are largely absent in supercooled liquids.
I Introduction
Time correlation functions of wavenumber dependent collective number density and orientational fluctuations in a molecular liquid play important role in understanding many microscopic aspects of dynamics in molecular liquids. The wavenumber dependent collective correlation functions of fluctuations bridge the gap between the single particle relaxation and the relaxation in the hydrodynamic limit ( and ) van Hove (1954); Zwanzig (1965). These correlation functions can be measured in the experiments such as light scattering and inelastic neutron scattering Berne and Pecora (1976); Copley and Lovesey (1974); Hansen and McDonald (1986); Balucani and Zoppi (1994); Boon and Yip (1980); Rahman (1963); Rahman et al. (1962). In the hydrodynamic limit, the expressions of these correlation functions can be obtained from the linearized Navier-Stokes equations Berne and Pecora (1976); Copley and Lovesey (1974); Hansen and McDonald (1986). This linearized hydrodynamic model and various molecular extensions of them have been useful in interpreting the results obtained from the computer simulations and the experiments of simple liquids in equilibrium Mountain (1966); Berne and Pecora (1976); Hansen and McDonald (1986). The time correlation function analysis of the liquid state uses well-known expressions for the transport coefficients and the hydrodynamic behavior. Such an analysis includes the wavelengths and frequencies that are comparable to inter atomic distances and microscopic relaxation rates. Deviations from the hydrodynamic behavior often appear in this analysis above some critical wavenumber. The wavenumbers near this critical distance may be referred as intermediate wavenumbers. Even after many years of investigation by different researchers, a complete microscopic understanding of the relaxation of collective fluctuation in liquids remains incomplete. At intermediate wavenumber, the correlation functions of collective fluctuations deviate from their hydrodynamic behavior; here the distance referred to is comparable to that of inter particle separation. The collective relaxation in the intermediate wavenumber regime can be treated in the framework of extended hydrodynamics Boon and Yip (1980); Hansen and McDonald (1986); de Schepper et al. (1988); Chung and Yip (1969).
In contrast to simple liquids, the studies of molecular liquids are bound to be complex due to the presence of the internal degrees of freedom, which couple to the conserved modes and act as additional relaxation channels for fluctuation. Compared to simple liquids, there are several parameters of intermolecular potential, like aspect ratio and geometry of molecule, which may affect the microscopic relaxation of molecular liquids Stegeman and Stoicheff (1968); Volterra (1969); Chung and Yip (1971).
There are several attempts to study the relaxation of the hydrodynamic modes in molecular liquids, however, such an analysis near the I-N transition is found to be absent in the literature. It is interesting to study this aspect of I-N transition, especially in the context of the recent experimental results by Fayer and coworkers Stankus et al. (1993); Gottke et al. (2002a, b); Cang et al. (2002, 2003a, 2003b); Li et al. (2005), where the orientational degree of freedom shows relaxation dynamics similar to that found in supercooled liquids. In another work Li et al. Li et al. (2005) presented a mode coupling theory which could reproduce the results observed in the experiments. However, they did not provide origin of the mode which couples to the orientational degrees of freedom. On the other hand, the experimental study of collective relaxation of other modes show the signature of the second order phase transition Takagi and Tanaka (2004). In the dynamic light scattering experiments near the I-N transition, the spectra of the orientational degrees of freedom mask dynamics of other modes. Mode-selective dynamic light scattering experiments of Takagi et al. Takagi and Tanaka (2004) on 5CB and 7CB liquid crystal samples have studied the dynamics of modes usually hidden under fluctuation of the orientational mode. They have measured the thermal diffusion, orientational relaxation and propagating sound modes of those liquid crystal samples. Using photopyroelectric technique, Marinelly et. al Marinelli et al. (1998) have measured the thermal conductivity and thermal diffusivity of aligned nCB samples. They have found that the thermal conductivity shows a discontinuity near the I-N transition, while, the thermal diffusivity shows a dip. In older studies of ultrasonic investigations of Eden et al. Eden et al. (1973) on MBBA samples with out any preferred orientation with emphasis given near transition temperature 44 , they found the acoustic relaxation time and relaxation strength increases near I-N transition.
It is now worth while to study effect of I-N transition on conserved degrees of freedom and also on the thermodynamic and transport properties. In this paper, the study of the collective transport properties of the nematogens has been restricted chiefly to the pre-transition region, where, even though there is an anisotropy due to the formation of pseudo nematic domains, they relax slowly to remove the anisotropy. However, as the orientational relaxation slows down close to the I-N transition, the relaxation of the anisotropy also slows down. Since the I-N transition is weakly first order, there are prolonged pre-transitional effects, which enable the observation of the effect of orientational ordering in the structural relaxation for a range of state points across I-N transition.
Since I-N transition occurs due the formation of the orientational cage that freezes rotation of the molecules, as the I-N transition is approached, the exchange of the angular momentum with the cage gives rise to a strong back scattering region in the angular velocity auto correlation function (see Ref. Jose and Bagchi (2004a)).
It is of course of interest to study what signatures the formation and melting of pseudo-nematic domains have on the transport properties, like thermal diffusivity, and also on the thermodynamic properties like sound velocity and specific heat. Earlier we presented a study of the variation of viscosity which shows weak anomaly across the isotropic-nematic phase transition. The present study is a continuation of our earlier study Jose and Bagchi (2004a) but now extended to include many thermodynamic and transport properties. Just as in the case of viscosity, it is not clear in the beginning what role formation of orientational order can have on properties which are largely determined by translational degrees of freedom.
Investigations reported in this paper are based on the simulation of a model molecular liquid with aspect ratio and can be approximated by prolate ellipsoids with two of the minor axis are equal. As reported earlier Jose and Bagchi (2004b, a), this system undergoes an I-N transition as the density increases from =0.285 to =0.315, gradually along an isotherm at = 1.0. The single particle relaxation dynamics in this system shows usual behavior as that of an ordinary liquid, except the presence of a marked anisotropy near I- N transition.
The present study on the relaxation of fluctuation of collective density modes focuses on the relaxation dynamics at different wavenumbers. The intermediate scattering function calculated from the simulations is fitted to the linearized hydrodynamic model of the intermediate scattering function in order to find the thermodynamic and transport properties of the system. Thermodynamic and transport properties obtained from the fitting parameters show non-monotonic behavior at different state points across the I-N transition. The sound velocity obtained from the peak position of the Brillouin peak Hansen and McDonald (1986); Boon and Yip (1980); Balucani and Zoppi (1994) shows that the adiabatic sound velocity increases across the I-N transition; except a deviation from it’s monotonic increase near the transition.
An important (and we believe) new result of the present study is the appearance of anisotropy in the wavenumber dependence of the dynamic structure factor, F(k,t). The latter becomes a function of the direction of propagation of wavevector, .
The remaining sections of this paper are organized as follows. Section II discusses the definition of the time correlation functions and their expressions in the hydrodynamic limit, which are used in the analysis. Details of simulations are presented in the section III. The section IV presents the results and discussions on the time correlation functions calculated from the simulations. The summary of the work is presented in the section V.
II Collective correlation functions of density
For a system that consists of N linear molecules there are 3N coordinates of position and 2N coordinates of orientation. In this system, density is a function the positions as well as orientations . The number density of the system can be obtained from by averaging over the orientations . Note that, the orientation of the molecule is not a conserved quantity.
The intermediate structure factor which measures the relaxation of density fluctuations in the molecular liquid is defined as Bagchi and Chandra (1991a),
| (1) |
This correlation function also accounts for the correlation between the orientation and density at two points separated in space and time. This is a generalization of the intermediate scattering function Hansen and McDonald (1986); Boon and Yip (1980); Balucani and Zoppi (1994) of a monatomic liquid. On averaging over orientation, gives , which is the intermediate scattering function of number density of the system. In the theory of the linearized hydrodynamics, can be expressed as Berne and Pecora (1976); Hansen and McDonald (1986)
| (2) | |||||
where is the static structure factor, ( is the ratio of specific heats ()), ( is the thermal diffusivity), ( is the sound wave damping constant), ( is the adiabatic sound velocity) and ( is the kinematic viscosity).
The intermediate scattering function and the structure factor gives information about the variation of the thermodynamical as well as transport coefficients. The at the lowest value of gives the isothermal compressibility
| (3) |
of the system. of the liquid across the I-N transition obtained from by the relation
| (4) |
III Details of the simulations
Molecular dynamics simulations have been carried out mostly for a system of 1125 Gay-Berne Berne and Pechukas (1972); Gay and Berne (1981) ellipsoids at temperature =1 near I-N transition in a micro-Canonical ensemble. The form of the modified inter-molecular Gay-Berne potential used in the simulation is Crain and Komolkin (1999); Ravichandran et al. (1998, 1997); Vasanthi et al. (2001); Jose and Bagchi (2004b)
| (5) |
where is the unit vector that passes through the center of mass of a pair of molecules, and unit vectors that passes through the major axis of a pair of ellipsoidal molecules. and give the strength and range of interaction,
| (6) |
is double of the minor axis b, gives molecular elongation (aspect ratio), which is the ratio of end-to-end to side-to-side diameters, . The aspect ratio of ellipsoids used in this simulation is 3. Here is defined as as
| (7) |
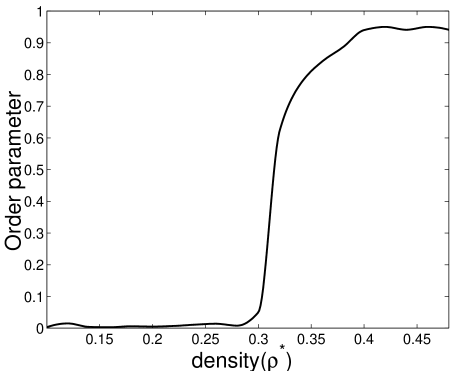
where is the energy parameter and ( gives the strength of interaction which is side-to-side to end-to-end well depths). The value of used in the simulation is 5 Ravichandran et al. (1997); DeMiguel et al. (1992); Smondyrev et al. (1995). The scaling used for moment of inertia is . The density is scaled in the simulation as and the temperature is scaled as . The equation of motion is integrated with reduced time () steps with t = 0.002 . The ellipsoid used in the simulation has minor axis b = 0.5 and major axis a = 1.5 (in reduced units). The simulations are done at the state points near the pre-transition region of phase diagram, shown in figure 1 The translational and rotational motions are solved using leap-frog algorithm. The order parameter changes dramatically in this system after density increases beyond 0.3. This is in accord with our previous works on same system Jose and Bagchi (2004b).

The simulation starts from an equilibrated configuration of ellipsoids. Initial configuration of the ellipsoids is generated from a cubic lattice and then the simulation is run for two hundred thousand steps to obtain the equilibrium configuration. During the equilibration steps the temperature is scaled so that the system is in equilibrium at this particular temperature.
In figure 1 , we show the phase diagram of ellipsoids with aspect ratio 3 interacting through Gay-Berne potential. In the diagram we also show by arrow the densities studied at temperature (). Figure 2 shows the variation of order parameter Jose and Bagchi (2004b) with density.
The molecular dynamics simulations ran for 10 million steps to generate trajectories. We have calculated the collective correlation functions across I-N transition from this data. The wavevectors are chosen to be in the , and directions of the simulation box. The difference in the calculated correlation functions in different directions is a measure of the anisotropy developed in the system. Relaxation of wavenumber dependent correlation functions has been studied at three wavenumbers. The smallest wavenumber studied is at , where is the length of the simulation box. The lowest value of the wavenumber as the density increases from 0.285 to 0.32 with a grid of 0.005 is 0.4. The latter is studied with a grid of 0.06.
IV Results and discussions
IV.1 Density fluctuations
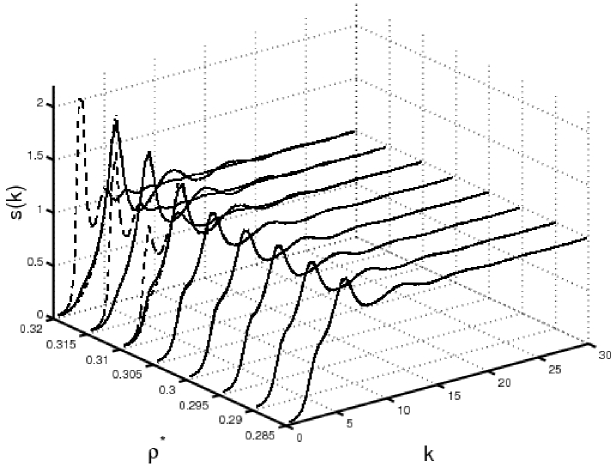
Figure 3 shows the variation of the structure factor across the I-N transition. As density increases a structure of the liquid differs at different directions. In one of the direction (in case of present simulation) the director of the system is oriented approximately in the direction. Note that the time scale of the director relaxation is much slower than the the density relaxation Jose and Bagchi (2004b). This enables the study of the system in different direction parallel and perpendicular to the director of the system. The development of the anisotropy in the system is not appreciable at the smallest wavenumbers. However, at large wavenumbers correlation of density increases in the and directions, at the same time along the direction density correlations vanish at larger wavenumbers. Therefore, in this system the orientational relaxation is mainly due to the relaxation of the local orientational cage rather than the global rotation of pseudo-nematic domain. This enables the study of the and without the use of the use of an external orienting field. Note that this possible only because the time scale of the were these correlations measured are short.
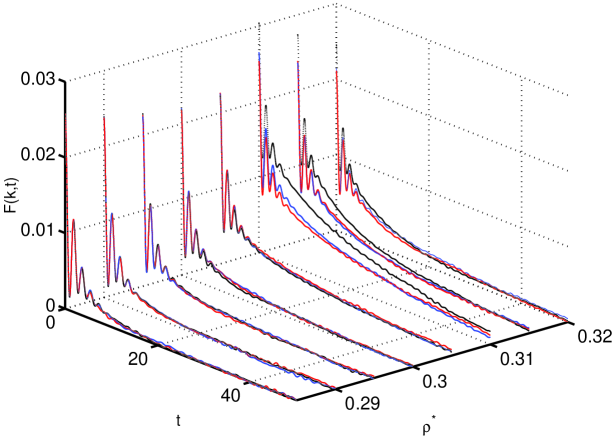
Figure 4 shows the total intermediate scattering function for lowest wavenumber chosen for the study of relaxation, at different state points of the Gay-Berne liquid across I-N transition The at shows hydrodynamic behavior. The rapid oscillation of the calculated at this wavenumber is related to the adiabatic sound propagation in the medium according to linearized hydrodynamics Berne and Pecora (1976); Boon and Yip (1980); Hansen and McDonald (1986). As density fluctuation increases the short wavenumber shows a rapid growth of correlation at the transition point. This can be an effect of the coupling of the between the orientational and the translational modes. This observation is not the artifact of the development of the global anisotropy of the system due to nematic domain formation. If that is the case the growth of correlation of the density fluctuation will be different in the case of , , and directions of the simulation box. At this wavevector in all the three direction density relaxation shows same feature of growth of correlation near the transition point. Note that highest density = 0.32, which is the nematic phase, where correlation of static density fluctuation at the lowest wavenumber reduces.
IV.2 Thermodynamic and Transport coefficients
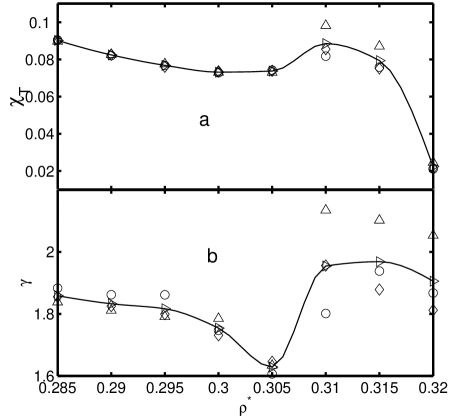
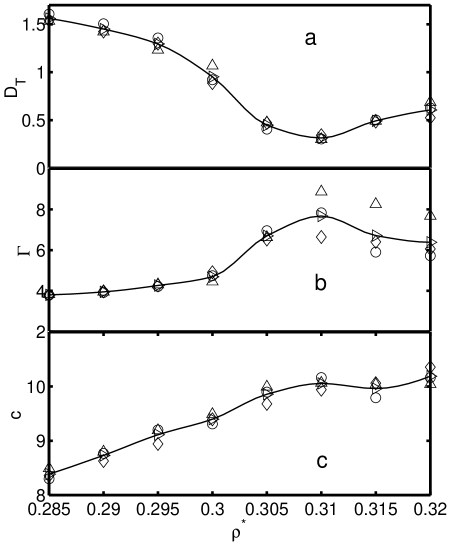
is fitted to it’s hydrodynamic form (Eq. 2 ) at the lowest value of . From the parameters of the fit of , at , various thermodynamic parameters and transport coefficients can be obtained. Figures 5 and 6 shows various thermodynamic parameters and transport coefficients calculated from the fit of for . The variation of the isothermal compressibility of the system at I-N transition is shown in the figure 5(a). The isothermal compressibility shows a hump near I-N transition. The ratio of the specific heats () is plotted against density is shown in figure 5(b). The variation of thermal diffusivity () against density shown in figure 6(a), which shows a dip near the I-N phase boundary. A similar feature was observed in the experiment of Marinelly et al. in the study of thermal diffusivity of aligned nCB samples Marinelli et al. (1998). shows a rapid increase at the transition point. Another transport coefficient that can be calculated from the fitting parameters is the sound wave damping constant, (). The variation of against density is shown in figure 6(b). shows a rapid growth near the I-N transition. This results of the variation sound damping constant when I-N transition is approached, is in qualitative agreement with the results of the Eden et al.Eden et al. (1973). In figure 6(c), the adiabatic sound velocity deduced from the position of the Brillouin peak is plotted against density. Except for a few points near the I-N transition, the adiabatic sound velocity shows a monotonic increase. In figure 6(c), sound velocity shows a plateau like region very near the I-N phase boundary. A qualitative picture of the effects of the emergence of increased static correlation on the collective dynamics of a system of nematogens near the I-N transition can be obtained from the analysis presented above. In the isotropic phase of the Gay-Berne liquid, the relaxation of density is isotropic due the rapid rotation of the molecules. But, near the I-N transition due to the freezing of individual rotation of the molecules, the anisotropy persists for long, which makes the density relaxation anisotropic. This may be viewed in the perspective of supercooled liquids, where it take very long time to relax anisotropy. In supercooled liquids there is no direction for the anisotropy. Near the I-N transition, in the isotropic liquid, the anisotropy is due to the coupling of number density to the transient director of the system. In the case of the supercooled liquids the density relaxation also slows down several orders of magnitude Levesque et al. (1990); Gotze and Sjogren (1992). However, in the Gay-Berne liquid the number density, although anisotropic, relaxes in a comparable time scale as that of an isotropic liquid. In the case of a liquid in the pre-transition region of the I-N transition the non-ergodicity is due the slow relaxation of the director. The sharp fall in shows that mean square enthalpy () fluctuations decreases compared to the same for energy () fluctuations. If we write the enthalpy change at constant pressure as , then the present result suggests that a positive change in (melting of pseudo-nematic domains to the isotropic phase) is accompanied by a negative change in energy, which is in accordance with the understanding that the nematic phase has lower internal energy than the isotropic phase. On the other hand, the formation of a local nematic domain due to interaction with the propagating sound wave can give rise to a negative and positive . Similarly, increase of sound attenuation is due to the interaction of the sound propagation with the melting/formation of pseudo-nematic domains which consumes energy from the sound wave.
V Concluding remarks
In this paper we have presented a study of I-N transition from the perspective of molecular hydrodynamics using molecular dynamics simulations. In a system of 1125 particles the smallest wavenumber that can be studied is approximately is in the range of the number densities = 0.285 to = 0.32. The calculation finds a fairly well defined Brillouin peak in the range of the wavenumbers studied. These simulations show the role of density fluctuation and the orientational ordering in development of anisotropy at intermediate wavenumebrs in the density relaxation near the I-N transition. However, at large wavenumbers the calculation shows only marginal evidence for the existence and propagation of the density fluctuations. The main results of this work are that it shows the effect of the formation of the director on the relaxation of fluctuations of the collective density of the system. A fit of intermediate scattering function to the linearized hydrodynamic model at small wavenumbers () show the variation of the thermodynamic as well as transport properties across I-N transition. The ratio of the specific heats shows a discontinuity-like feature near the I-N transition. The thermal diffusion shows a dip; a similar behavior is reported in the recent experiments of Marinelly et al.Marinelli et al. (1998). The sound dispersion coefficient also shows a divergence like behavior near I-N transition. The sound velocity calculated from the peak position if the Brillouin peak deviate from its monotonic increase near I-N transition also that is in qualitative agreement with the experimental results of Eden Eden et al. (1973) et al..
This work demonstrates the effect of spatial and temporal propagation of anisotropy of the molecular potential in the medium at different state points across the I-N transition. Also effect of this in the thermodynamic and transport coefficients. Thus during the I-N transition the system shows the non-ergodicity due to the formation of director, that slowly relaxes due to the mutual coupling of the orientation within a pseudo nematic domain. Our results qualitatively agrees with experimental results even though the potential used is a simple ellipsoidal model. This shows that these results are related directly the anisotropy of the inter molecular potential.
In the context of continuing interest of the comparison between the dynamics of supercooled liquid and liquid crystalsGottke et al. (2002a, b); Jose and Bagchi (2004b); Chakrabarti et al. (2005), it is interesting to note that the anomalies observed in sound attenuation and sound absorption coefficients are not known to exist (at least significantly) in the former. This outlines the uniqueness of the liquid crystalline systems where large pseudo-nematic domains form and melts near the I-N boundary. Such a physical process does not exist in the supercooled liquid at a thermodynamic level.
We have argued that most of the features observed can be qualitatively understood from the melting/formation of the pseudo-nematic domains. A complete theory of the observed hydrodynamic anomalies need to consider translation-rotation couplingChandra and Bagchi (1990); Bagchi and Chandra (1991b) and is yet to be developed.
We are not aware of the existence of any theoretical treatment of the effects of slow down in the decay of the orientational time correlation function of nematogens near their I-N transition, on the isotropic dynamic structure factor. In earlier study, we have reported observation of an anomalous viscoelasticity of the nematogens near the I-N transition.Jose and Bagchi (2004a) Both the problems require inclusion of the effects of orientational slow down on the isotropic density relaxation. This is clearly a non-linear problem. While the orientational order parameter S is a non-conserved order parameter, the isotropic density is a conserved order parameter. The Landau-de Gennes-Ginzburg free energy for the isotropic phase of the liquid crystal can be written down without much difficulty. However, difficulty lies in the fact that the total free energy function should be a functional of both and , with a coupling between the two fields. A molecular hydrodynamic theory along the above line needs to be developed but still appears to be non-existing.
A valid criticism of the present work is the finite size of the system simulated, although N=1125 is quite large (and demanding) for long MD simulations, particularly when orientational degree of freedom is present. Also note that Gay-Berne is quite a complex potential to study. In addition to N=1125, we have also studied extensively the size N=500. The basic features remain unchanged. Nevertheless, the k–¿0 limit is expected to be sensitive to the system size, and a system size dependent study of the present results could be a worthwhile exercise. The intermediate wavenumber results, however, are not expected to be sensitive to system size. It will be worthwhile to study this range by neutron scattering.
Acknowledgements.
This work is supported in parts by grants from DST, India.References
- van Hove (1954) L. van Hove, Phys. Rev. 95, 249 (1954).
- Zwanzig (1965) R. Zwanzig, Ann. Rev. Phys. Chem. 16, 67 (1965).
- Berne and Pecora (1976) B. J. Berne and R. Pecora, Dynamic Light Scattering: With applications to Chemistry, Biology and Physics. (John Wiley & Sons, INC, New York, 1976).
- Copley and Lovesey (1974) J. R. D. Copley and S. W. Lovesey, Rep. Prog. Phys. 38, 461 (1974).
- Hansen and McDonald (1986) J. P. Hansen and I. R. McDonald, Theory of Simple Liquids (Academic Press, London, 1986).
- Balucani and Zoppi (1994) U. Balucani and M. Zoppi, Dynamics of the liquid state (Claredon Press, Oxford, 1994).
- Boon and Yip (1980) J. P. Boon and S. Yip, Molecular hydrodynamics (McGraw-Hill International book company, New Delhi, 1980).
- Rahman (1963) A. Rahman, Phys. Rev. 130, 1334 (1963).
- Rahman et al. (1962) A. Rahman, K. S. Singwi, and A. Sjolander, Phys. Rev. 126, 986 (1962).
- Mountain (1966) R. D. Mountain, Rev. Mod. Phys. 38, 205 (1966).
- de Schepper et al. (1988) I. M. de Schepper, E. G. D. Cohen, C. Bruin, J. C. van Rijs, W. Montfrooji, and L. A. de Graff, Phys. Rev. A 38, 271 (1988).
- Chung and Yip (1969) C. H. Chung and S. Yip, Phys. Rev. 182, 182 (1969).
- Stegeman and Stoicheff (1968) G. I. A. Stegeman and B. P. Stoicheff, Phys. Rev. Lett. 21, 202 (1968).
- Volterra (1969) V. Volterra, Phys. Rev. 180, 156 (1969).
- Chung and Yip (1971) C. H. Chung and S. Yip, Phys. Rev. A 4, 928 (1971).
- Stankus et al. (1993) J. J. Stankus, R. Torre, and M. D. Fayer, J. Phys. Chem. 97, 9478 (1993).
- Gottke et al. (2002a) S. D. Gottke, D. D. Brace, H. Cang, B. Bagchi, and M. D. Fayer, J. Chem. Phys. 116, 360 (2002a).
- Gottke et al. (2002b) S. D. Gottke, H. Cang, B. Bagchi, and M. D. Fayer, J. Chem. Phys. 116, 6339 (2002b).
- Cang et al. (2002) H. Cang, J. Li, and M. D. Fayer, Chem. Phys. Lett. 366, 82 (2002).
- Cang et al. (2003a) H. Cang, J. Li, V. N. Novikov, and M. D. Fayer, J. Chem. Phys. 118, 9303 (2003a).
- Cang et al. (2003b) H. Cang, J. Li, V. N. Novikov, and M. D. Fayer, J. Chem. Phys. 119, 10421 (2003b).
- Li et al. (2005) J. Li, I. Wang, and M. D. Fayer, J. Phys. Chem. B 109, 6514 (2005).
- Takagi and Tanaka (2004) S. Takagi and H. Tanaka, Phys. Rev. Lett. 93, 257802 (2004).
- Marinelli et al. (1998) M. Marinelli, F. Mercuri, U. Zammit, and F. Scudieri, Phys. Rev. E 58, 5860 (1998).
- Eden et al. (1973) D. Eden, C. W. Garland, and R. C. Williamson, J. Chem. Phys. 58, 1861 (1973).
- Jose and Bagchi (2004a) P. P. Jose and B. Bagchi, J. Chem. Phys. 121, 6978 (2004a).
- Jose and Bagchi (2004b) P. P. Jose and B. Bagchi, J. Chem. Phys. 120, 11256 (2004b).
- Bagchi and Chandra (1991a) B. Bagchi and A. Chandra, Adv. Chem. Phys. 80, 1 (1991a).
- Berne and Pechukas (1972) B. J. Berne and P. Pechukas, J. Chem. Phys. 56, 4213 (1972).
- Gay and Berne (1981) J. G. Gay and B. J. Berne, J. Chem. Phys. 74, 3316 (1981).
- Crain and Komolkin (1999) J. Crain and A. V. Komolkin, Adv. Chem. Phys. 109, 39 (1999).
- Ravichandran et al. (1998) S. Ravichandran, A. Perera, M. Moreau, and B. Bagchi, J. Chem. Phys. 106, 1280 (1998).
- Ravichandran et al. (1997) S. Ravichandran, A. Perera, M. Moreau, and B. Bagchi, J. Chem. Phys. 107, 8469 (1997).
- Vasanthi et al. (2001) R. Vasanthi, S. Ravichandran, and B. Bagchi, J. Chem. Phys. 115, 10022 (2001).
- DeMiguel et al. (1992) E. DeMiguel, L. F. Rull, and K. E. Gubbins, Phys. Rev. A 45, 3813 (1992).
- Smondyrev et al. (1995) A. M. Smondyrev, G. B. Loriot, and R. A. Pelcovits, Phys. Rev. Lett. 75, 2340 (1995).
- Levesque et al. (1990) D. Levesque, J. P. Hansen, and J. Zinn-Justin, eds., Liquid Freezing and Glass Transition (North Holland, Amsterdam, 1990).
- Gotze and Sjogren (1992) W. Gotze and L. Sjogren, Rep. Prog. Phys. 55, 241 (1992).
- Chakrabarti et al. (2005) D. Chakrabarti, P. P. Jose, S. Chakrabarty, and B. Bagchi, Phys. Rev. Lett. 95, 197801 (2005).
- Chandra and Bagchi (1990) A. Chandra and B. Bagchi, Physica A 169, 246 (1990).
- Bagchi and Chandra (1991b) B. Bagchi and A. Chandra, Adv. Chem. Phys. 130, 1 (1991b).