Variability in the cycle length of the supersoft source
RX J0513.9–6951
Abstract
Context. The supersoft X-ray binary RX J0513.9–6951 shows cyclic changes between optical-low / X-ray-on states and optical-high / X-ray-off states. It is supposed to be accreting close to the Eddington-critical limit and driven by “accretion wind evolution”.
Aims. We seek to derive the variations in the characteristic time scales of the long-term optical light curve and to determine the implications for the physical parameters of the system.
Methods. We used existing and new optical monitoring observations covering a total time span of 14 years and compared the durations of the low and high states with the model calculations of Hachisu & Kato.
Results. The cycle lengths and especially the durations of the optical high states show a longterm modulation with variations that, according to the accretion wind evolution model, would imply variations in the mass transfer rate by a factor of 5 on timescales of years.
Key Words.:
binaries: close – white dwarf – accretion disk – X-rays: stars – stars: individual: RX J0513.9–6951 – Large Magellanic Cloud1 Introduction
The supersoft X-ray source RX J0513.9–6951 (hereafter RXJ0513) was discovered with the ROSAT satellite (Schaeidt, Hasinger & Trümper SchHasTru93 (1993)). This object is the most luminous of the known supersoft X-ray binaries in the Milky Way and the Magellanic Clouds. The source was identified with a 16.7 magnitude emission line star (Pakull et al. Paketal93 (1993), Cowley et al. Cowetal93 (1993)). A few years later the monitoring capabilities of the MACHO Project (Alcock et al. Alcetal96 (1996)) revealed the unique feature which made this supersoft source a key object: the source has alternating high and low states of optical brightness and appears as a supersoft object during the optical low states. The high state lasts about 140 days typically, the low state about 40 days with a change in brightness by 0.8 to 1.0 magnitudes within a few days. Only the long-term optical photometry revealed that the supersoft X-ray outbursts occurred at times of low optical light. From this fact Southwell et al. (Souetal96 (1996)) concluded that the most likely cause of the X-ray outburst is a contraction of the white dwarf atmosphere from an expanded state to a steady shell burning phase as originally suggested by Pakull et al. (Paketal93 (1993)). In this concept, supersoft radiation could be triggered by a reduced accretion rate.
Van den Heuvel et al. (vdHetal92 (1992)) showed that the ultrasoft X-ray emission observed in supersoft sources can be explained by steady nuclear burning of hydrogen accreted onto the surface of a white dwarf in the mass range 0.7 to 1.2 solar masses. Processing hydrogen into helium at the rate of accretion requires a minimum mass accretion rate of /yr. Below this, burning is unstable and occurs in flashes. At /yr the accretion rate approaches the Eddington critical limit. Kato & Hachisu (KatHac94 (1994)) have shown that optically thick wind solutions exist which allow that steady nuclear burning on the white dwarf surface can continue even at super-Eddington accretion rates.
Reinsch et al. (ReivTeBeu96 (1996)) demonstrated that the observed optical and X-ray flux variations in RXJ0513 can be quantitatively explained by variations in the irradiation of the accretion disk caused by a contracting and expanding photosphere of the accreting white dwarf with nuclear burning at its surface. Also the lightcurve analysis of Meyer-Hofmeister & Schandl (MeySch96 (1996)) confirmed the importance of irradiation during the high state. But what causes the changes between the high and low optical state, or, between higher and lower mass accretion rates?
Reinsch et al. (Reietal00 (2000)) presented a self-maintained limit-cycle model which can qualitatively explain the optical and soft X-ray variability of RXJ0513 . They proposed that the behavior results from periodic changes of the accretion disk viscosity in response to changes of the irradiation by the hot white dwarf photosphere. In this model, the mass-flow rate at the surface of the white dwarf varies while the mass transfer from the companion star remains constant during the cycle.
Using their optically thick wind theory and OPAL opacities, Kato & Hachisu (KatHac94 (1994)) have shown that at levels already slightly below the Eddington luminosity an envelope around the white dwarf can no longer be static. Instead, optically thick strong winds will onset from the white dwarf when a critical accretion rate of /yr is exceeded (Hachisu et al. HacKatNom96 (1996)). Based on this work, a new self-sustained transition mechanism for the cyclic behavior of RXJ0513 was developed by Hachisu & Kato (2003a , 2003b ). In this model, excess matter above the critical accretion rate is expelled from the binary by winds and the system evolves according to the accretion wind solution (Hachisu & Kato HacKat01 (2001)). The mass-transfer rate and with it the wind mass-loss rate itself are periodically modulated as the strong wind interacts with the surface layer of the secondary star. Variations in the two rates occur with a delay between them due to the viscous time-scale of the accretion disk.
Both models (Reinsch et al. Reietal00 (2000), Hachisu & Kato 2003b ) allow predictions to be made on the variations in the temperature, the effective photospheric radius, and the accretion rate of the white dwarf during the X-ray and optical cycle of RXJ0513 which can be tested by dedicated multi-wavelength observations. In addition, the detailed parameter study contained in the Hachisu & Kato (2003b ) paper provides implications for the physical parameters of the binary system which can be evaluated by a careful analysis of the long-term optical light curve alone.
Two independent monitoring campaigns aimed at obtaining high-resolution X-ray spectroscopy of RXJ0513 have been initiated to gain further insight into the complex nature of this supersoft source. Both campaigns use optical monitoring to trigger X-ray observations during an optical low state of the source. The first campaign resulted in XMM-Newton observations in April/ May 2004 reported by McGowan et al. (McGetal05 (2005)). A second optical monitoring campaign has been carried out by us to trigger X-ray observations with the Chandra X-ray observatory, performed in December 2003 and in April/ May 2005. First results of the monitoring and the X-ray observations were presented in Burwitz et al. (Buretal07 (2007)) and Reinsch et al. (ReiBurSch06 (2006)). A detailed discussion of the X-ray observations and an analysis of the simultaneous X-ray and optical data will be given in a separate paper (Burwitz et al. Buretal08 (2008)).
In this paper, we will focus on the discussion of the combined optical monitoring data from our own campaign and from all campaigns available in the literature. Altogether these data cover the optical lightcurve of RXJ0513 over a time span of about 14 years and allow for the first time a detailed analysis of the varying lengths of the optical high and low states. In Sect. 2 we give a description of the optical observations that are used. We compare the observations with the predictions of the Hachisu & Kato (2003b ) model (Sect. 3) and discuss the implications for the long-term cycles in the light curve on the expected changes of the mass transfer rate (Sect. 4).
2 Observations
The optical monitoring data used in this paper come from three different sources: our own (described below), those published in McGowan et al (McGetal05 (2005)), and the MACHO data (Cowley et al. Cowetal02 (2002)).
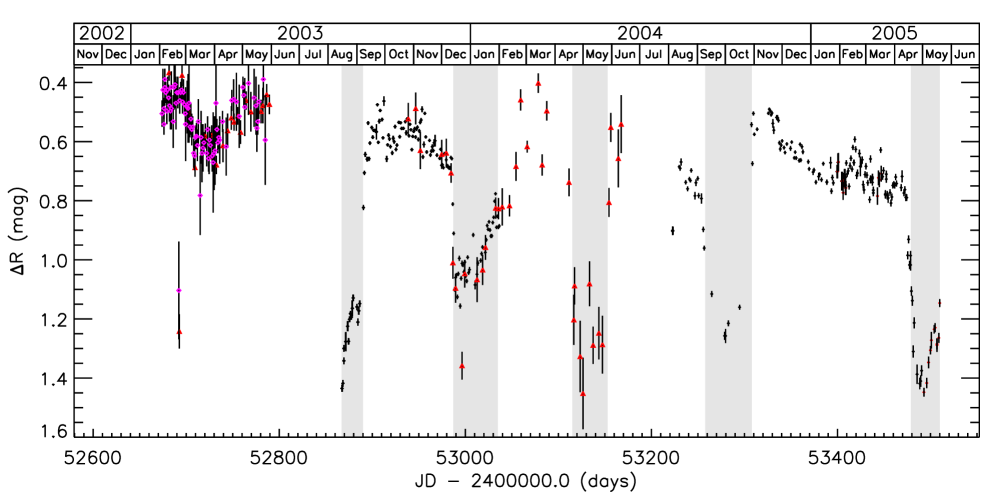
Our optical data were obtained during two monitoring programs using the telescopes run by the SMARTS Consortium at Cerro Tololo, Chile. We used the ANDICAM dual-channel photometer, mounted on the SMARTS/CTIO 1.3 m telescope, to obtain the CCD images during the first monitoring program from August 2003 to January 2004 and to obtain part of the data during the second monitoring program from August 2004 to May 2005. Most of the data during the second campaign were obtained with an Apogee AP7b CCD camera on the CTIO 1.0 m telescope. In both programs B and R images were taken every 1-2 days. In addition V images were taken every 3-4 days during the first campaign.
Aperture photometry, using the MIDAS data analysis package, was used to measure the fluxes of RXJ0513 and four comparison stars. Differential magnitudes in the R-filter are shown in Fig. 1.
The McGowan et al. (2005) data cover most of the gap between our two monitoring programs from February to July 2004. From December 2002 to June 2004 they obtained V-band and unfiltered observations from SAAO (Sutherland, South Africa), CTIO (La Serena, Chile), and Barfold Observatory (Victoria, Australia).
The MACHO data described in Cowley et al. (Cowetal02 (2002)) cover the time span from July 1992 up to January 2000 and provide a close to 8 year baseline of long-term monitoring observations of RXJ0513.
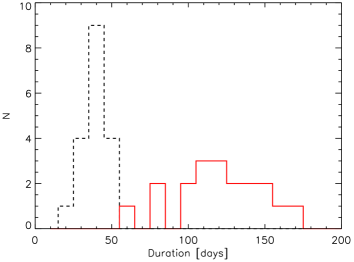
For our analysis of the variability in the cycle length the time of change between high and low states was extracted from all available observations in the same way: we take the date when the luminosity shows the steepest increase/ decrease. With this method we can determine the date of state change to 1 day. In Table 1 we list the dates of changes between the states and their duration. No observations exist for the low state expected between JD 2449321 and JD 2449370. Therefore, only lower and upper limits can be given in Table 1 for its onset and end, respectively. Also the changes to the low state around JD 2452867 and the change to the high state at JD 2453509 are uncertain. The distribution of both high and low state lengths is displayed as a histogram in Fig. 2.
| change down | change up to | duration of | duration of |
| to low state | high state | low state | high state+ |
| JD-2400000 | JD-2400000 | (days) | (days) |
| — | 48831 | — | 78 |
| 48909 | 48937 | 28 | 63 |
| 49000 | 49038 | 38 | 119 |
| 49157 | 49198 | 41 | 123 |
| 49321 | 49370 | 49 | 149 |
| 49519 | 49551 | 32 | 141 |
| 49692 | 49725 | 33 | 137 |
| 49862 | 49901 | 39 | 108 |
| 50009 | 50040 | 31 | 110 |
| 50150 | 50190 | 40 | 116 |
| 50306 | 50344 | 38 | 156 |
| 50500 | 50537 | 37 | 154 |
| 50691 | 50728 | 37 | 153 |
| 50881 | 50928 | 47 | 130 |
| 51058 | 51080 | 22 | 118 |
| 51198 | 51243 | 45 | 104 |
| 51347 | 51391 | 44 | 129 |
| 51520 | 51546 | 26 | — |
| … | … | … | … |
| 52867 | 52890 | 23 | 100 |
| 52990 | 53037 | 47 | 78 |
| 53115 | 53153 | 38 | 105 |
| 53258 | 53308 | 50 | 171 |
| 53479 | 53509 | 30 | — |
+ next high state
3 Comparison with the model of Hachisu & Kato
3.1 The sequence of states of nuclear burning in the model
In the model of Hachisu & Kato (2003a , 2003b ) diverse physical processes have to be included to reproduce the cycles present in RXJ0513. The basic input is the detailed computational results on the nuclear burning on the white dwarf surface (Hachisu & Kato 2003b ), which are based on the analysis of optically thick winds in nova outbursts (Kato & Hachisu KatHac94 (1994)). For the extended envelope a special surface boundary condition was chosen, combining the structure of a static envelope with maximal (Eddington) luminosity and a wind solution in which the sonic point is close to the photosphere. Using the results for given white dwarf mass and chemical abundances several physical quantities can be evaluated as a function of the envelope mass: the rate of nuclear burning, the white dwarf radius, the photospheric temperature, the luminosity, and the wind loss rate. These relations allow us to determine the change of envelope mass with time. Hachisu & Kato (2003a , 2003b ) assume that as a consequence of the strong wind the surface layer of the main sequence companion is stripped off. The mass transfer to the disk around the white dwarf is reduced by the stripping rate and stops if the latter becomes larger than the original mass-transfer rate. After a viscous timescale of the disk also the accretion onto the white dwarf stops, the wind ceases, the mass-transfer is resumed, and a new cycle begins.
3.2 The optical high/ X-ray low state
An important contribution to the luminosity during the optical high state is expected from a large and irradiated disk surface, which leads to a quick rise of the V luminosity. Hachisu & Kato (2003a , 2003b ) assumed that the disk size increases to three times the Roche lobe radius of the white dwarf (actually only a large radiating area is needed to explain the luminosity increase, the geometry is not constrained). This might appear as an ad hoc assumption, but such a contribution was found as appropriate for the fitting of the lightcurve of CI Aql in the outburst decline (Hachisu & Kato 2003a ).
The duration of the optical high/ X-ray low state is expected to depend mainly on the accretion rate. Monitoring observations have shown that this duration varies by more than a factor of 2 and accordingly large changes in the accretion rate from the secondary are expected to occur (see Section 4).
3.3 The optical low/ X-ray high state
At the end of the wind phase, the system enters an optical low/ X-ray high state. During this phase, supersoft radiation from the nuclear-burning white dwarf surface can emerge while optical emission is reduced by about 1 magnitude as the accretion disk has shrunk to its original size. While accretion from the secondary resumes as soon as the wind stops, it takes the viscous timescale of the accretion disk for the accreted material to reach the white dwarf surface. Therefore, this timescale largely determines the duration of the optical low/ X-ray high state. The radius of the white dwarf is a function of the amount of matter in the hydrogen layer on the white dwarf surface (Kato Kat85 (1985), Kato & Hachisu KatHac94 (1994)). The analysis of the X-ray data shows that the radius and temperature of the white dwarf roughly agree with the predictions of the Hachisu & Kato (2003b ) model (see Burwitz et al. Buretal07 (2007)).
3.4 What causes the cyclic behavior?
Essential in the model of Hachisu & Kato (2003a , 2003b ) is the assumption that the mass accretion onto the white dwarf is intermittent. This assumption causes a cyclic behavior. If, otherwise, the mass transfer could adjust to a certain amount of the wind mass loss the source could remain at this state. The same question can be raised in connection with the model of Reinsch et al. (Reietal00 (2000)). Could the disk exist in a stable state with a certain amount of irradiation and with a mass flow rate according to the transfer rate?
The question arises whether a hysteresis in the relation between optical radiation and amount of matter in the hydrogen layer could cause a cyclic behavior. Can the luminosity be different for different atmospheric structures, in one case for an extended photosphere (determined by wind loss), and in another case for a star not blown up (with the same amount of hydrogen at both stages)? The results for nova outbursts (Kato & Hachisu 1994) seem to yield a unique relation. The only free parameter taken is the value for the optical depth at the photosphere (as mentioned above), chosen in a way that the structure of the maximum static solution and that of the minimum wind solution are almost identical.
We performed a stability analysis for the equilibrium flow in the Hachisu & Kato model. The change of the envelope mass depends on the rate of mass burning on the white dwarf surface, the wind mass loss in Kato’s solution and the accretion rate on the white dwarf surface. Wind mass loss and burning rate are a function of the envelope mass and increase with the envelope mass, while mass transfer decreases with the increasing wind mass loss. This provides for a stationary solution. The finite diffusion time through the accretion disk introduces a time-lag between mass transfer from the secondary star and the accretion on the white dwarf surface. (For the detailed analysis see Appendix A.)
The result is that the stationary solution is stable: The mass accretion onto the white dwarf always can adjust to the wind from the photosphere, small deviations from the stationary state decay exponentially. In the model of Hachisu & Kato (2003a , 2003b ) the cyclic behavior is introduced by an assumed hysteresis in the interaction between wind and mass transfer from the secondary star.

4 Interpretation of the observed long-term evolution of cycle length
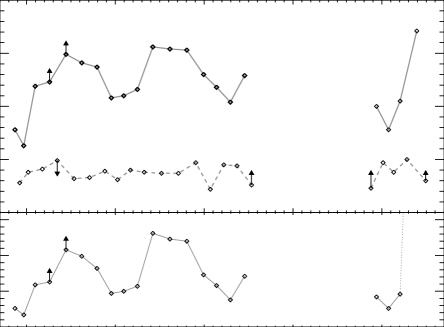
In general the duration of the optical high state is determined by the burning of the hydrogen in the envelope during the wind phase. The higher the rate of mass accretion onto the white dwarf during this time, that is, the higher the overflow rate from the companion star during the pre-wind phase, the longer the high state lasts. The length of the high states varies from about 63 days to 171 days in the recent cycle in 2005. In Fig. 3 (upper panel) we show the observed duration of optical high and low states as listed in Table 1. Hachisu and Kato (2003b ) used their model to calculate lightcurves for various mass transfer rates and determined the cycle length. In Fig. 4 we show their results for the dependence of the cycle length on the mass transfer rate (we take the results for the assumed viscous timescale of the disk = 20.5 days which agrees best with the observations).

Taking the relation between the length of high states and the mass accretion rate from Fig. 4 we can interpret the observed duration of the high states from Table 1 as a measure for the mass transfer rate (Fig. 3, lower panel). As can be seen the mass transfer rate is expected to vary by a factor up to 5 and a long-term modulation of the mass transfer rate appears to be indicated. In the framework of the model, we note particularly that the recently observed long cycle would be related to an episode of higher mass accretion rate.
According to the numerical calculations of Hachisu & Kato (2003b ) the duration of the optical low state depends also on the mass accretion rate, but with a higher rate leading to a shorter duration. In their model, mass transfer into the potential well of the white dwarf occurs only during the optical low states. Therefore, the mass transfer rate during these episodes is expected to be the relevant parameter which determines the duration of the low state itself as well as the duration of the subsequent optical high state. In Fig. 5 we have compared our measurements of times and show expected relations between them according to the parameter studies of Hachisu & Kato (2003b ). From the available data of all observed cycles there is no clear correlation in the sense that a relatively short optical low state is followed by a long optical high state and vice versa. In this respect the observations differ from the model predictions.
The origin of the possible long-term changes of the mass overflow rate is unclear. Stellar activity might be a potential mechanism. Stellar pulsations are less likely relevant. Hutchings et al. (Hutetal02 (2002)) argue, in their work on ultraviolet spectroscopy of RXJ0513, that the donor might be a more massive star. But long pulsation periods, of years, are known only for AGB stars.
5 Conclusions
The observations of RXJ0513 document long-term changes of the duration of the optical-high / X-ray-off and the optical-low / X-ray-on states. A model for the cyclic changes was presented by Hachisu & Kato (2003a , 2003b ). In this paper, we have discussed the assumptions made in their model and compared the model predictions with observational results from the long-term optical monitoring of RXJ0513.
An essential question is the cause of the limit cycle behavior. Our stability analysis (see Appendix A) shows that a stable stationary solution exists in which the mass accretion onto the white dwarf always can adjust to the wind from the photosphere. This analysis does not support the model assumption of Hachisu & Kato (2003a , 2003b ) that the wind from the white dwarf stops the mass overflow from the companion and thereby leads to the limit cycle behavior. We conclude that an as yet unspecified hysteresis seems to be required to naturally explain the cyclic behavior of RXJ0513.
The numerical calculations by Hachisu & Kato (2003a , 2003b ) for different mass overflow rates from the companion star provide a relation for the dependence of the cycle length on the mass transfer rate. We have used this relation to derive mass transfer rates from the lengths of the optical high states. In this picture, the observed variability of the cycle length would indicate that the mass overflow rate from the companion star varies by a factor of about 5 on a timescale of few years. The recent very long optical high state leads to the question whether RX J0513.9–6951 is in a transition from a phase of lower mass transfer in the past to higher rates and, maybe, even approaches an uninterrupted high state. But, looking back to the past, observations 100 years ago (Leavitt Lea1908 (1908)) show already variations in the luminosity at that time.
Acknowledgements.
R.E. Mennickent acknowledges the Grant Fondecyt 1030707. The State University New York (SUNY) Stony Brook membership in the SMARTS consortium is made possible by generous support from the Vice President for Research, the Provost, and the Dean of Arts & Sciences. We also would like to thank the anonymous referee for valuable comments and suggestions which helped to improve the structure of the paper.References
- (1) Abramowicz, M., Stegun, I.A. 1964, eds., Handbook of Mathematical Functions, National Bureau of Standards, Applied Mathematics Series 55
- (2) Alcock, C., Allsman, R.A., Alves, D. et al. 1996, MNRAS 280, L49
- (3) Burwitz, V., Reinsch, K., Greiner, J. et al. 2007, Advances in Space Research 40, 1294
- (4) Burwitz, V., Reinsch, K., Greiner, J. et al. 2008, in preparation
- (5) Cowley, A.P., Schmidtke, P.C., Hutchings, J.B. et al. 1993, ApJ 418, L63
- (6) Cowley, A.P., Schmidtke, P.C., Crampton, D., Hutchings, J.B. 2002, AJ 124, 2233
- (7) Hachisu, I., & Kato, M. 2001, ApJ 558, 323
- (8) Hachisu, I., & Kato, M. 2003a, ApJ 588, 1003
- (9) Hachisu, I., & Kato, M. 2003b, ApJ 590, 445
- (10) Hachisu, I., Kato, M., & Nomoto, K. 1996, ApJ 470, 97
- (11) Hutchings, J.B., Winter, K., Cowley, A.P. et al. 2002, ApJ 124, 2833
- (12) Kato, M. 1985, PASJ 37, 19
- (13) Kato, M., Hachisu, I. 1994, ApJ 437, 802
- (14) Leavitt, H.S. 1908, Ann. Astron. Obs. Harvard College, 60, 87
- (15) McGowan, K.E., Charles, P.A, Blustin, A.J, et al. 2005, MNRAS 364, 462
- (16) Meyer-Hofmeister, E., & Schandl, S. 1996, Astronomische Nachrichten, Abstract Series 12, p. 40
- (17) Pakull, M.W., Motch, C., Bianchi, L. et al. 1993, A&A 278, L39
- (18) Reinsch, K., van Teeseling, A., Beuermann, K., & Abbot, T.M.C. 1996, A&A 309, L11
- (19) Reinsch, K., van Teeseling, A., King, A.R. et al. 2000, A&A 354, L37
- (20) Reinsch, K., Burwitz, V., Schwarz, R. , 2006, In: Proceedings of the ‘The X-ray Universe 2005’ El Escorial, Madrid, Spain, Editor A. Wilson, ESA SP-604, 285
- (21) Schaeidt, S., Hasinger, G., & Truemper, J. 1993, A&A 270, L9
- (22) Southwell, K.A., Livio, M., Charles, P.A., O’Donoghue, D., & Sutherland, W. 1996, Lecture Notes in Physics 472, 159
- (23) van den Heuvel, E.P.J., Bhattacharya, D., Nomoto, K., et al. 1992, A&A 262, 97
Appendix A Stability analysis
We consider the time evolution of the mass in the white dwarf envelope fed by mass accretion , but consumed by nuclear burning and by wind loss ,
| (1) |
Mass accretion occurs via an accretion disk fed by mass transfer from the secondary star. With starting at some time (arbitrary), one has
| (2) |
with diffusion time of the disk.
The model assumptions (see Hachisu & Kato (2003a, 2003b) are: is a monotonically rising function of . is a monotonically decreasing function of (through interference of the wind with the mass transfer), such that mass transfer is shut off at some critical wind loss rate . For small , mass transfer is assumed larger than . We further neglect a weak dependence of on .
In steady state, = , and Eq. A1 becomes
| (3) |
The right hand side monotonically decreases with increasing , is positive for small and negative for , the value at which the wind loss rate reaches the value where mass transfer is shut off. In between those exists one value for which Eq. A3 is fulfilled and steady state holds.
This steady state is stable. We linearize Eqs. A1 and A2 in deviations and from equilibrium, and obtain
| (4) |
Here we have used the functional dependence of on and on , and defined the wind loss time scale and the interaction strength between wind and mass transfer as
| (5) |
Laplace transformation (Abramowicz & Stegun AbrSte64 (1964)) of Eq. A4 gives as a rational function of with two poles in the complex plane with negative real parts. Inverse Laplace transformation reduces to evaluation of the residuals at these poles and gives the solution as a damped oscillator,
| (6) |
, , and are combinations of , and ,
| (7) | |||||
| (8) | |||||
| (9) |
If the expression under the square root becomes negative, Eq. A6 becomes that of an overdamped oscillator with two exponentially decaying terms.
We conclude that the model does not lead to sustained cycles between states of high and low mass transfer by time delay in the disk accretion process alone, and that a well documented hysteresis either in the relation , or more simply, in the dependence is required to naturally explain the cyclic behavior of the supersoft source RX J0513.9–6951.