Y.-T. Shen
Department of Physics, National Taiwan University, Taipei
K.-F. Chen
Department of Physics, National Taiwan University, Taipei
P. Chang
Department of Physics, National Taiwan University, Taipei
I. Adachi
High Energy Accelerator Research Organization (KEK), Tsukuba
H. Aihara
Department of Physics, University of Tokyo, Tokyo
K. Arinstein
Budker Institute of Nuclear Physics, Novosibirsk
T. Aushev
École Polytechnique Fédérale de Lausanne (EPFL), Lausanne
Institute for Theoretical and Experimental Physics, Moscow
A. M. Bakich
University of Sydney, Sydney, New South Wales
V. Balagura
Institute for Theoretical and Experimental Physics, Moscow
K. Belous
Institute of High Energy Physics, Protvino
U. Bitenc
J. Stefan Institute, Ljubljana
A. Bondar
Budker Institute of Nuclear Physics, Novosibirsk
A. Bozek
H. Niewodniczanski Institute of Nuclear Physics, Krakow
M. Bračko
University of Maribor, Maribor
J. Stefan Institute, Ljubljana
T. E. Browder
University of Hawaii, Honolulu, Hawaii 96822
Y. Chao
Department of Physics, National Taiwan University, Taipei
A. Chen
National Central University, Chung-li
W. T. Chen
National Central University, Chung-li
B. G. Cheon
Hanyang University, Seoul
R. Chistov
Institute for Theoretical and Experimental Physics, Moscow
Y. Choi
Sungkyunkwan University, Suwon
J. Dalseno
University of Melbourne, School of Physics, Victoria 3010
M. Dash
Virginia Polytechnic Institute and State University, Blacksburg, Virginia 24061
A. Drutskoy
University of Cincinnati, Cincinnati, Ohio 45221
S. Eidelman
Budker Institute of Nuclear Physics, Novosibirsk
N. Gabyshev
Budker Institute of Nuclear Physics, Novosibirsk
B. Golob
University of Ljubljana, Ljubljana
J. Stefan Institute, Ljubljana
K. Hayasaka
Nagoya University, Nagoya
M. Hazumi
High Energy Accelerator Research Organization (KEK), Tsukuba
D. Heffernan
Osaka University, Osaka
Y. Hoshi
Tohoku Gakuin University, Tagajo
W.-S. Hou
Department of Physics, National Taiwan University, Taipei
H. J. Hyun
Kyungpook National University, Taegu
T. Iijima
Nagoya University, Nagoya
K. Inami
Nagoya University, Nagoya
A. Ishikawa
Saga University, Saga
H. Ishino
Tokyo Institute of Technology, Tokyo
M. Iwasaki
Department of Physics, University of Tokyo, Tokyo
Y. Iwasaki
High Energy Accelerator Research Organization (KEK), Tsukuba
J. H. Kang
Yonsei University, Seoul
N. Katayama
High Energy Accelerator Research Organization (KEK), Tsukuba
H. Kawai
Chiba University, Chiba
H. J. Kim
Kyungpook National University, Taegu
S. K. Kim
Seoul National University, Seoul
Y. J. Kim
The Graduate University for Advanced Studies, Hayama
P. Križan
University of Ljubljana, Ljubljana
J. Stefan Institute, Ljubljana
P. Krokovny
High Energy Accelerator Research Organization (KEK), Tsukuba
R. Kumar
Panjab University, Chandigarh
C. C. Kuo
National Central University, Chung-li
Y.-J. Kwon
Yonsei University, Seoul
J. Lee
Seoul National University, Seoul
S. E. Lee
Seoul National University, Seoul
T. Lesiak
H. Niewodniczanski Institute of Nuclear Physics, Krakow
S.-W. Lin
Department of Physics, National Taiwan University, Taipei
Y. Liu
The Graduate University for Advanced Studies, Hayama
D. Liventsev
Institute for Theoretical and Experimental Physics, Moscow
F. Mandl
Institute of High Energy Physics, Vienna
S. McOnie
University of Sydney, Sydney, New South Wales
T. Medvedeva
Institute for Theoretical and Experimental Physics, Moscow
W. Mitaroff
Institute of High Energy Physics, Vienna
K. Miyabayashi
Nara Women’s University, Nara
H. Miyake
Osaka University, Osaka
H. Miyata
Niigata University, Niigata
G. R. Moloney
University of Melbourne, School of Physics, Victoria 3010
M. Nakao
High Energy Accelerator Research Organization (KEK), Tsukuba
Z. Natkaniec
H. Niewodniczanski Institute of Nuclear Physics, Krakow
S. Nishida
High Energy Accelerator Research Organization (KEK), Tsukuba
O. Nitoh
Tokyo University of Agriculture and Technology, Tokyo
T. Ohshima
Nagoya University, Nagoya
S. Okuno
Kanagawa University, Yokohama
S. L. Olsen
University of Hawaii, Honolulu, Hawaii 96822
Institute of High Energy Physics, Chinese Academy of Sciences, Beijing
W. Ostrowicz
H. Niewodniczanski Institute of Nuclear Physics, Krakow
H. Ozaki
High Energy Accelerator Research Organization (KEK), Tsukuba
P. Pakhlov
Institute for Theoretical and Experimental Physics, Moscow
G. Pakhlova
Institute for Theoretical and Experimental Physics, Moscow
H. Park
Kyungpook National University, Taegu
K. S. Park
Sungkyunkwan University, Suwon
R. Pestotnik
J. Stefan Institute, Ljubljana
L. E. Piilonen
Virginia Polytechnic Institute and State University, Blacksburg, Virginia 24061
N. Sasao
Kyoto University, Kyoto
O. Schneider
École Polytechnique Fédérale de Lausanne (EPFL), Lausanne
K. Senyo
Nagoya University, Nagoya
M. E. Sevior
University of Melbourne, School of Physics, Victoria 3010
M. Shapkin
Institute of High Energy Physics, Protvino
H. Shibuya
Toho University, Funabashi
J.-G. Shiu
Department of Physics, National Taiwan University, Taipei
A. Somov
University of Cincinnati, Cincinnati, Ohio 45221
S. Stanič
University of Nova Gorica, Nova Gorica
M. Starič
J. Stefan Institute, Ljubljana
K. Sumisawa
High Energy Accelerator Research Organization (KEK), Tsukuba
T. Sumiyoshi
Tokyo Metropolitan University, Tokyo
F. Takasaki
High Energy Accelerator Research Organization (KEK), Tsukuba
K. Tamai
High Energy Accelerator Research Organization (KEK), Tsukuba
N. Tamura
Niigata University, Niigata
M. Tanaka
High Energy Accelerator Research Organization (KEK), Tsukuba
Y. Teramoto
Osaka City University, Osaka
T. Tsuboyama
High Energy Accelerator Research Organization (KEK), Tsukuba
S. Uehara
High Energy Accelerator Research Organization (KEK), Tsukuba
T. Uglov
Institute for Theoretical and Experimental Physics, Moscow
Y. Unno
Hanyang University, Seoul
S. Uno
High Energy Accelerator Research Organization (KEK), Tsukuba
P. Urquijo
University of Melbourne, School of Physics, Victoria 3010
G. Varner
University of Hawaii, Honolulu, Hawaii 96822
K. E. Varvell
University of Sydney, Sydney, New South Wales
K. Vervink
École Polytechnique Fédérale de Lausanne (EPFL), Lausanne
S. Villa
École Polytechnique Fédérale de Lausanne (EPFL), Lausanne
C. C. Wang
Department of Physics, National Taiwan University, Taipei
C. H. Wang
National United University, Miao Li
M.-Z. Wang
Department of Physics, National Taiwan University, Taipei
P. Wang
Institute of High Energy Physics, Chinese Academy of Sciences, Beijing
M. Watanabe
Niigata University, Niigata
Y. Watanabe
Kanagawa University, Yokohama
J. Wicht
École Polytechnique Fédérale de Lausanne (EPFL), Lausanne
E. Won
Korea University, Seoul
Y. Yamashita
Nippon Dental University, Niigata
M. Yamauchi
High Energy Accelerator Research Organization (KEK), Tsukuba
C. Z. Yuan
Institute of High Energy Physics, Chinese Academy of Sciences, Beijing
Y. Yusa
Virginia Polytechnic Institute and State University, Blacksburg, Virginia 24061
C. C. Zhang
Institute of High Energy Physics, Chinese Academy of Sciences, Beijing
Z. P. Zhang
University of Science and Technology of China, Hefei
V. Zhilich
Budker Institute of Nuclear Physics, Novosibirsk
A. Zupanc
J. Stefan Institute, Ljubljana
Abstract
We report an observation of the decay and evidence for .
These results are based on a 414 fb-1 data sample collected with the Belle detector at the KEKB asymmetric-energy collider operating at the resonance.
The branching fractions for these decay modes are measured to be and for invariant mass below 2.85 GeV/.
The corresponding partial rate asymmetry for the charged mode is measured
to be
.
We also study the decays and ,
where the and decay to final states with
four charged kaons. We find
with
the candidates within the mass region is
, consistent with no asymmetry.
Evidence of charmless decays has been reported by the Belle collaboration using pairs Huang .
In the Standard Model (SM), this decay channel requires the creation of an additional final quark pair in a process, such as .
Therefore, the study of provides useful information for
understanding quark fragmentation in decays. Moreover, our previous
study also reported results for the decays with
the decaying into four kaons in the final state, which can
proceed with mesons in the intermediate state.
It has been suggested that large direct violation up to 40%
is possible in if there is a sizable
transition with a non-SM -violating phase that interferes with the
decay amplitude via the resonance Hazumi .
Recently the BaBar collaboration has reported results of a study of
BaBar . The branching fraction for
that they obtained is around three times
larger than our previous
measurement Huang . Here we present improved measurements of
decays with not only larger
statistics but also proper consideration of the non-resonant
contribution
underneath the resonance.
The analysis is based on a data sample of containing
449 pairs. The data were collected with the Belle
detector at the KEKB asymmetric-energy (3.5 on 8 GeV) collider KEKB operating at the resonance.
The Belle detector is a large-solid-angle magnetic spectrometer that consists of a silicon vertex detector (SVD), a 50-layer central drift chamber (CDC),
an array of aerogel threshold Cherenkov counters (ACC), a barrel-like arrangement of time-of-flight scintillation counters (TOF), and an electromagnetic calorimeter comprised of CsI(Tl) crystals (ECL) located inside a superconducting solenoid coil that provides a 1.5 T magnetic field.
An iron flux-return located outside the coil is instrumented to detect mesons and to identify muons (KLM).
The detector is described in detail elsewhere Belle .
Two inner detector configurations were used.
A 2.0 cm radius beampipe and a 3-layer silicon vertex detector (SVD1) were used for the first sample of 152 pairs, while a 1.5 cm radius beampipe, a 4-layer silicon detector (SVD2) and a small-cell inner drift chamber were used to record the remaining 297 pairs Ushiroda .
Charged kaons are required to have impact parameters within 2 cm of the interaction point (IP) along the -axis (antiparallel to the positron direction) and within 0.2 cm in the transverse plane.
Each track is identified as a kaon or a pion according to a likelihood ratio, , where is the likelihood of kaons/pions derived from the responses of TOF and ACC systems and the energy loss measurements from the CDC.
The likelihood ratio is required to exceed 0.6 for kaon candidates; within the momentum range of interest, this requirement is 88% efficient for kaons and has a misidentification rate for pions of 8.5%.
Neutral kaons are reconstructed via the decay and have an invariant mass 0.482 GeV/ 0.514 GeV/ ( mass resolution).
The vertex is required to be displaced from the IP and the flight direction must be consistent with a that originated from the IP.
The required displacement increases with the momentum of the candidate.
meson candidates are reconstructed in the five-kaon final state.
Two kinematic variables are used to distinguish signal candidates from backgrounds: the beam-energy constrained mass and the energy difference , where is the beam energy, and and are the reconstructed energy and momentum of the signal candidate in the rest frame. The resolution of is approximately 2.8 MeV/, dominated by the beam energy spread, while the resolution is around 10 MeV.
Candidates with five kaons within the region 0.2 GeV and 5.2 GeV/ are selected for further consideration.
The signal region is defined as 5.27 GeV/ 5.29 GeV/ and 0.05 GeV.
The dominant backgrounds are () continuum events.
Event topology and flavor tagging are used to distinguish the jet-like continuum events and the spherically distributed events.
Seven event-shape variables are combined into a single Fisher discriminant fisher .
The Fisher variables include the angle between the thrust axis of the candidate and the thrust axis of the rest of the event (), five modified Fox-Wolfram moments SFW , and a measure of the momentum transverse to the event thrust axis () spher .
Two other variables that are uncorrelated with the Fisher discriminant and help to distinguish signal from the continuum are , where is the angle between the flight direction and the beam direction in the center-of-mass frame, and , the vertex difference between the signal candidate and its accompanying .
We form signal and background probability density functions (PDFs) for the Fisher discriminant, and using the signal Monte Carlo (MC) events and sideband data (5.2 GeV/ 5.26 GeV/), respectively.
The products of the PDFs for these variables give signal and background likelihoods and for each candidate, allowing a selection to be applied to the likelihood ratio .
Additional background discrimination is provided by the quality of the flavor tagging of the accompanying meson.
The standard Belle flavor tagging package TaggingNIM gives two outputs: a discrete variable indicating the flavor of the tagging and dilution factor , which ranges from zero for no flavor information to unity for unambiguous flavor assignment.
The continuum background is reduced by applying a selection requirement on the
variable for events in each region according to the figure of merit defined as , where denotes the expected signal yield based on MC simulation and the branching fraction reported in our previous measurements, and denotes the expected yields from sideband data.
This requirement removes (61-81)% of the continuum background while retaining (80-92)% of the signal, and depends on the decay channel ( or ) and the SVD configuration during the measurement (SVD1 or SVD2).
Backgrounds from other decays are investigated using a large MC sample and are found to be negligible after the requirement.
The signal yields are extracted by applying an unbinned extended maximum likelihood (ML) fit to the events with 5.2 GeV/ and
0.2 GeV.
For the mode, we simultaneously obtain the yield and the partial rate asymmetry using the likelihood, defined as:
(1)
where is the identifier of the -th event, indicates signal ()
or background (), is the two-dimensional PDF of and , and indicates the meson flavor, for and for , respectively.
For neutral events, the factor in Eq. (1) is replaced by 1.
The PDFs are modeled by a Gaussian function for signals and an ARGUS function argus for the continuum, while a Gaussian is used to describe the signal and a second-order Chebyshev polynomial is used for the background distribution.
The parameters of the PDFs are determined using high-statistics MC samples and sideband data for signal and background shapes, respectively.
The signal PDFs are calibrated by comparing the and distributions of the data with the MC expectation.
We search for charmless decays by requiring the invariant mass () to be less than 2.85 GeV/, the region below charmonium threshold.
Candidate mesons are identified by requiring the invariant masses of pairs () to be in the range 1.0 GeV/ to 1.04 GeV/ ().
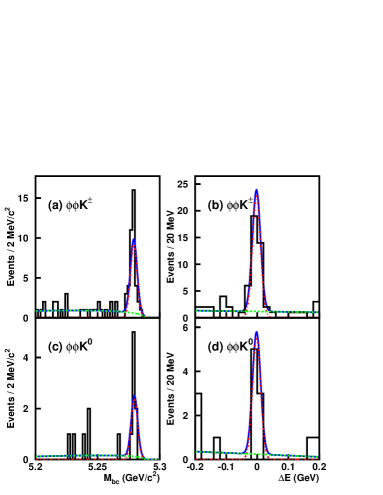
Figure 1 shows the and projections with the fit curves superimposed.
Clear signals appear in both and modes with signal yields of and , respectively.
Although candidates are required to lie in the mass region, non- backgrounds may also contribute.
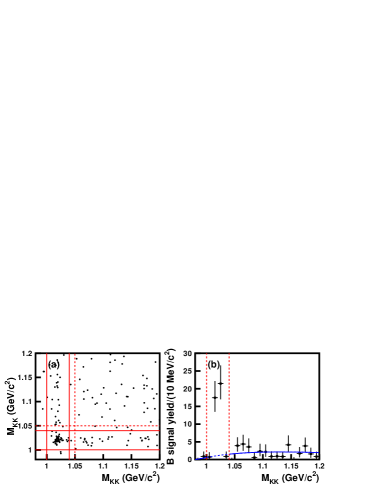
Figure 2(a) shows the vs. distributions for candidates in the signal region, where the two pairs are required to have invariant masses less than 1.2 GeV/.
Events in the two bands are used to estimate the contribution.
Figure 2(b) shows the signal yields B signal yields as a function of the invariant mass after requiring the other pair to have a mass in the mass region.
The signal yields are fitted with a threshold function in the region 0.98 GeV/ 1.20 GeV/, excluding the mass region (1.00 GeV/ 1.04 GeV/).
The size of the non- contribution is estimated by interpolating the yields in the sideband region to the mass region.
Since events in the two bands contain both true mesons and non-resonant pairs, the area underneath the mass region in Fig. 2(b) also includes the contribution and, due to combinatorics, a double counted contribution from the non-resonant
component.
The contribution of is estimated by extrapolating the signal yield in the upper right corner of the dashed region in Fig. 2(a) to the mass region.
The fraction of non- events in the mass region as obtained from both contributions is thus ()%.
The same procedure is applied to the sample; here we obtain a fraction of ()%.
Figure 1: Distributions of and for the decay modes (a,b) and (c,d), with invariant mass less then 2.85 GeV/.
The open histograms are the data, the solid curves show the result of the fit, the dash-dotted curves represent the signal contributions and the dashed curves show the continuum background contributions.Figure 2: (a) The distribution of vs. for the candidates in the signal box with 1.2 GeV/.
The two bands indicate the mass region (1.0 GeV/ 1.04 GeV/).
The horizontal and vertical dashed lines are located at = 1.05 GeV/.
The rectangle on the upper right is the sideband region; events in this region are used to estimate the non-resonant contribution.
(b) signal yield as a function of the after requiring the other pair to have a mass in the mass region.
A threshold function is used to fit the data; events with 1.0 GeV/ 1.04 GeV/ are excluded when the fit is performed.
Table 1 summarizes the results after subtracting the non- contribution.
Signal efficiencies are obtained by generating MC events, where the same 2.85 GeV/ requirement is applied.
Systematic uncertainties in the fit are obtained by performing fits in which the signal peak positions and resolutions of the signal PDFs are successively varied by .
The quadratic sum of each deviation from the central value of the fit gives the systematic uncertainty of the fit.
For each systematic check, the statistical significance is taken as , where and are the likelihoods at the expected non- yields and the best fit, respectively. The change in significance
that arises from uncertainties in the signal PDFs is negligible ().
We choose the
significance
calculated after increasing the non- yield by its
statistical uncertainty as our significance including systematic
uncertainty.
The numbers of and pairs are assumed to be equal.
Table 1: Mode, yield, efficiency including secondary branching fractions, branching fraction for and related charmonium decays.
Mode
Yield
Efficiency(%)
( 2.85 GeV/)
2.41
( 2.85 GeV/)
0.69
,
2.72
,
4.85
,
9.93
,
4.67
,
9.41
The systematic uncertainty resulting from the requirement is studied by checking the data-MC efficiency ratio using the sample.
The corresponding systematic error is 2.7-2.8% and again depends on the decay channel and SVD geometry.
The systematic errors on the charged track reconstruction are estimated to be around % per track using partially reconstructed events.
Therefore, the tracking systematic error is 5% (five tracks) for the mode and 4% for the mode (excluding reconstruction).
The kaon identification efficiency is studied using samples of inclusive decays.
The reconstruction is verified by comparing the ratio of and yields.
The resulting detection systematic error is 4.9%.
The uncertainty in the number of events is 1.4%.
The final systematic error is obtained by summing all correlated errors linearly and then quadratically summing the uncorrelated errors.
After subtracting the non- contribution, the branching fractions for charmless decays are with a 9.5 significance and with a 4.7 significance.
The measured charge asymmetry for decay is .
The first error is statistical and the second is systematic.
It is of interest to search for possible resonances above
charmonium threshold.
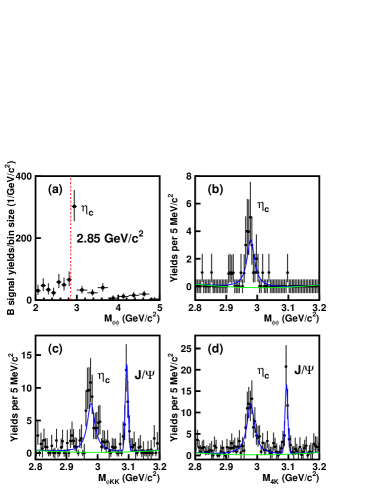
Figure 3(a) shows the signal yield divided by the bin size as a function of if the 2.85 GeV/ requirement is not applied.
There is no enhancement in the high mass region except for the peak near 3 GeV/.
Reference Hazumi suggests the possibility of a large asymmetry, which could arise from the interference between and decays.
Events with invariant mass within MeV/ of the nominal mass are selected to investigate this asymmetry.
The measured asymmetry is , which is consistent with no asymmetry.
We study possible charmonium states by measuring the yield with between 2.8 GeV/ and 3.2 GeV/.
Since and mesons may decay to and , mass fits are performed with and without the requirement that one or both
pairs lie in the mass region.
As shown in Fig. 3, clear and resonances are visible in the and samples while only an peak appears in the mode.
We obtain the signal yields for and by performing fits with asymmetric errors to the , and invariant mass distributions, which are presented in Figs. 3(b, c, d).
The signal PDF is modeled with a Gaussian function while the PDF is described by a Breit-Wigner function convoluted with a Gaussian resolution function, which has the same Gaussian width as the PDF.
Since sizable signals are observed in the mode, the parameters are determined using the sample and the same signal PDFs are then applied to the and samples.
The obtained Gaussian width is measured to be MeV/.
The resulting signal yields are summarized in Table 1.
The peak positions obtained for the and are
GeV/ and GeV/, respectively, consistent with the nominal and masses.
The Breit-Wigner width is measured to be MeV/, where the central value is consistent with the world average PDG and the second error is due to the uncertainty of the Gaussian width for
the mass resolution.
The validity of determining signal yields from a constrained fit with an asymmetric error is verified by toy MC.
Figure 3: signal yield as a function of (a,b) , (c) and (d) .
In (a) we use different bin sizes for less than 3 GeV/ and greater than 3 GeV/.
The subset with from 2.8 GeV/ to 3.2 GeV/ is shown in (b). The signal PDF is modeled with a Gaussian function while the
PDF is described by a Breit-Wigner function convoluted with a Gaussian resolution function, which has the same Gaussian width as the PDF.
The solid curves in (b,c,d) show the results of the fit and the contributions
(second order polynomial) not from the and .
For the and modes, the non- contribution is determined from the signal yields for events with one pair in the sideband region (1.05 GeV/ 1.09 GeV/) and the and masses in the charmonium resonance region, respectively.
We find events in the mode, events in the mode, and events in the mode.
For the yields of these modes, listed in Table 1, the corresponding feed-down yields have been subtracted.
Signal efficiencies are determined using signal MC and their systematic
uncertainties are similar to what was described in the charmless
part.
Systematic uncertainties in the fitting are obtained by performing fits in which the signal peak positions, the resolutions of the signal PDF’s and the width of the Gaussian resolution function convoluted with the PDF are successively varied by .
The quadratic sum of all deviations gives the systematic error of the fit.
The products of the branching fractions for various decays are listed in
Table 1.
Since the probabilities of and decays to and final states are measured with poor accuracy,
we can use the values from Table 1 as well as
the world average branching fractions
and PDG to determine independently the corresponding
branching fractions for the and ; the results are shown in
Table 2. The world average values given above are
based on datasets, which also include Belle measurements belle_ch ;
however, our estimate shows that effects of possible correlations are
negligible.
We also provide the ratios of branching fractions as shown in
Table 3. The systematic uncertainties are predominately due to
the Gaussian width for the mass resolution; other systematic uncertainties
either cancel out in the ratios or too small to be considered.
Table 2: The measured branching fractions of secondary charmonium decays.
Decay mode
Table 3: Ratios of branching fractions for the and decays.
Mode
Ratio
In summary, we have observed the charmless decay and evidence for .
We also report the asymmetry of the charged decay and measurements of other closely related charmonium decays.
The results are consistent with our previous measurements Huang
and supersede them, and have considerably better precision due to the increase in statistics. The obtained
branching fraction of charmless decay is
smaller than the measurement by the BaBar collaboration BaBar .
For the charmonium decays, we find that the decay
contributes around 42% and 24% of the and events, respectively. The latter is consistent with an early
Belle measurement gg using events produced in two
photon collisions.
For both the and decays into four charged kaons, the
contribution dominates.
We thank the KEKB group for excellent operation of the
accelerator, the KEK cryogenics group for efficient solenoid
operations, and the KEK computer group and
the NII for valuable computing and Super-SINET network
support. We acknowledge support from MEXT and JSPS (Japan);
ARC and DEST (Australia); NSFC and KIP of CAS (China);
DST (India); MOEHRD, KOSEF and KRF (Korea);
KBN (Poland); MES and RFAAE (Russia); ARRS (Slovenia); SNSF (Switzerland);
NSC and MOE (Taiwan); and DOE (USA).
References
(1)
H.C. Huang et al. (Belle Collaboration),
Phys. Rev. Lett. 91, 241802 (2003).
(2)
M. Hazumi,
Phys. Lett. B 583, 285 (2004).
(3)
B. Aubert et al. (BABAR Collaboration),
Phys. Rev. Lett. 97, 261803 (2006).
(4)
S. Kurokawa and E. Kikutani, Nucl. Instr. and. Meth. A 499, 1 (2003),
and other papers included in this volume.
(5)
A. Abashian et al. (Belle Collaboration),
Nucl. Instr. and Meth. A 479, 117 (2002).
(6) Y. Ushiroda,
Nucl. Instr. and Meth. A 511 6 (2003); Z. Natakaniec et al.,
(Belle SVD2 Group), Nucl. Instr. and Meth. A 560, 1 (2006).
(7)
R. A. Fisher, Ann. Eugenics 7, 179 (1936).
(8)
The Fox-Wolfram moments were introduced in G. C. Fox and S. Wolfram, Phys. Rev. Lett. 41, 1581 (1978).
The Fisher discriminant used by Belle, based on modified Fox-Wolfram moments (SFW), is described in K. Abe et al. (Belle Collaboration), Phys. Rev. Lett. 87, 101801 (2001) and K. Abe et al. (Belle Collabboration.), Phys. Lett. B 511, 151 (2001).
(9) R. Ammar et al. (CLEO Collaboration),
Phys. Rev. Lett. 71, 674 (1993).
(10)
H. Kakuno et al., Nucl. Instr. and Meth. A 533, 516 (2004).
(11)
H. Albrecht et al. (ARGUS Collaboration), Phys. Lett. B 229, 304 (1989).
(12)
Hereafter in this paper, the signal yield is obtained from 2D fits to the events in each bin of the plot.
(13)
W.-M. Yao et al. (Particle Data Group),
Journal of Physics G 33, 1 (2006) and 2007 partial update for
edition 2008.
(14)
F. Fang et al. (Belle Collaboration), Phys. Rev. Lett. 90,
071801 (2003); K. Abe et al. (Belle Collaboration), Phys. Rev. D
67, 032003 (2003).
(15)
S. Uehara et al. (Belle Collaboration), Euro. Phys. Jour. C 53, 1 (2008).