High-fidelity gates in a Josephson qubit
Abstract
We demonstrate new experimental procedures for measuring small errors in a superconducting quantum bit (qubit). By carefully separating out gate and measurement errors, we construct a complete error budget and demonstrate single qubit gate fidelities of 0.98, limited by energy relaxation. We also introduce a new metrology tool — a Ramsey interference error filter — that can measure the occupation probability of the state down to , a magnitude near the fault tolerant threshold.
pacs:
03.67.Ac, 03.67.Lx, 03.67.Pp, 74.50+r, 78.47.jm, 85.25.CpThe immense computational power of a quantum computer comes with a cost - the fragility of entangled quantum states from coherence loss. Although decoherence is present in all physical systems, the effect of the resulting logic errors can be overcome by using error-correcting codes, provided that gate errors fall below a fault-tolerance threshold Knill2005 ; Steane1999 ; Knill1998 ; Gottesman1998 ; DiVincenzo1996 . This threshold depends on system architecture and the specific form of decoherence, but is likely to be range Knill2005 . The measurement of gate fidelity in this range is thus a critical step in implementing fault-tolerant quantum computation. To date, high fidelity logic gates have only been demonstrated in ion traps Leibfried2003 ; Chiaverini2004 . Solid-state systems such as Josephson qubits Devoret2004 ; You2005 ; Bouchiat1998 ; Nakamura1999 ; Vion2002 ; Chiorescu2003 ; Makhlin2001 ; Sillanpaa2007 ; Majer2007 ; Plantenberg2007 ; Niskanen2007 ; Steffen2006 ; Martinis2002 , which have the potential advantage of scalability, have not achieved equivalent fidelities. Here, we measure the fidelity of a single qubit gate for a Josephson phase qubit, demonstrating substantial progress towards this goal. Using the new metrological technique of “Ramsey filtering”, we also show how one important error process can be measured and reduced to the fault-tolerant threshold.
Coherence is typically quantified through the energy decay time and coherence time (that includes dephasing) obtained from a Ramsey fringe experiment. The fidelity of a gate operation is then computed as the ratio of the gate time to coherence time. We note, however, that such an analysis assumes no loss in fidelity during a logic gate operation when the quantum state is changed, and thus it more properly corresponds to the fidelity of a memory operation. In addition, these coherence times are typically determined by the relative decay in an experimental signal assumed to be proportional to the state probability, thus ignoring any fidelity loss that might be constant in time. A full measurement of gate fidelity, applicable to the fault-tolerance threshold, should include gate errors that are determined via probabilities with an absolute calibration.
To illustrate the importance of these issues, we note that many experimental systems use qubit states and , often the ground and first excited states, chosen from a larger set of basis states Nielsen2000 . This encoding does not preclude unwanted excitations to other available states in the basis. For example, excitations to the next higher energy state are not necessarily small and correspond to gate errors that may not be included in standard measurements of and .
In the experiments described here we used a superconducting phase qubit, where the superconducting phase difference in a Josephson junction (with critical current ) serves as the quantum variable. When biased close to the critical current, the junction and its loop inductance generate a cubic potential where the two lowest energy eigenstates and have a transition frequency GHz (see Fig. 1A). This frequency can be adjusted by % using the junction bias current. The circuit layout and operation have been described previously Steffen2006 ; Katz2006 .
Single qubit logic operations, corresponding to rotations about the -, -, and -axes of the Bloch sphere, are generated as follows: Rotations about the -axis are produced from current pulses on the qubit bias line that adiabatically change the qubit frequency, leading to phase accumulation between the states and Steffen2006a . Rotations about any axis in the - plane are produced by microwave pulses resonant with the qubit transition frequency. The phase of the microwave pulses defines the orientation of the rotation axis in the - plane, and the pulse duration and amplitude control the rotation angle.
We perform single shot readout of the phase qubit by applying a fast ( rise time) current pulse . This fast pulse lowers the barrier height and increases the tunneling probability of the state (Fig. 1B). Once tunneled, the state quickly decays into an external lower energy state that can be easily distinguished from the untunneled state using an on-chip superconducting quantum interference device (SQUID) Martinis2002 .
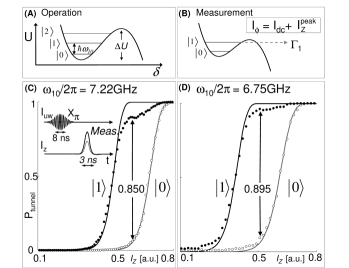
Non-ideal behavior of the qubit can arise from errors either in the logic gate or in the state measurement. The measurement errors can be accounted for by thoroughly understanding their physical mechanisms. In Josephson phase qubits, measurement fidelities below unity are due to stray tunneling of the state, the state leaking energy to spurious two-level states (TLS) Cooper2004 , and relaxation. To quantitatively confirm TLS effects as measurement errors, we determined the measurement fidelity above and below a large TLS splitting at (see supplementary material section), as shown in Fig. 1C and 1D. For each data set, the tunneling probability of the ground state is determined versus measurement pulse amplitude . The pulse is then calibrated for a -rotation to give maximum probability of the state, and the state probability is determined versus . After this calibration, is chosen to give maximum visibility, which is displayed in each figure by an arrow.
Theoretical predictions for the tunneling probabilities are given by the solid black and gray lines in Fig. 1C and 1D. The state is misidentified as a state with a probability of . This error is consistent with theory, and corresponds to stray tunneling events during measurement Cooper2004 . At the state is misidentified as the state with a probability of , but at a higher qubit frequency, this error increases to . The increase in measurement error with qubit frequency is attributed to a TLS located between these two frequencies. With a measurement of the TLS splitting using spectroscopy (see data in supplementary material section), we predict a state population decrease of , a value consistent with our data. The remaining measurement error is accounted for with an error budget of for decay, for coupling to other TLS, and for no tunneling of the state during measurement.
With good agreement between experiment and theory, we can reliably account for measurement errors in our data. Because the error for the state — due solely to stray tunneling — is simpler and less dependent on systematics, we choose to perform logic gate experiments that bring the final state close to , thus reducing uncertainties due to state measurement.
The fidelity of a gate is determined by applying two -pulses that produce the transitions , and then measuring the state of the qubit. A -pulse represents the maximum rotation of a single qubit operation and thus gives a measure of the maximum error for a gate. Both microwave -pulses were designed to have Gaussian envelopes (see supplementary material section), with a duration full-width at half maximum (FWHM). The correct sequential operation of this gate is checked by testing whether the probability for the final state is independent of the phase between the two microwave pulses, as illustrated in Fig. 2A. In Fig. 2B (2C) the experimental (theoretical) state tomography data is shown as a function of and microwave detuning from the qubit transition frequency . The experimental data is in excellent correspondence with theoretical predictions. On resonance (), the phase has no effect, as expected, which demonstrates that the two pulses are calibrated properly as -pulses.
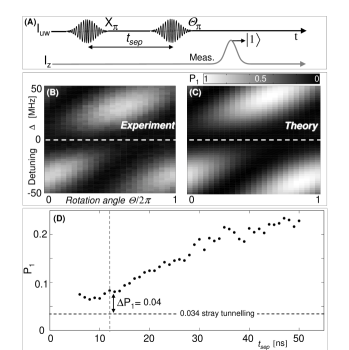
Gate error is directly measured by repeating this experiment with variable time separation between the two -pulses, as shown in Fig. 2D. The gate error grows with increasing time because the state decays, and the error has a slope consistent with separate measurements of . The error also increases at small times due to the overlap of the two Gaussian microwave pulses. The horizontal dashed line indicates taken without the application of microwaves; the difference between the data and the dashed line is the gate error. When the pulses are separated by a time , we find an error . Since two gate operations are used for this protocol, the fidelity for a single gate operation is NoteT2 .
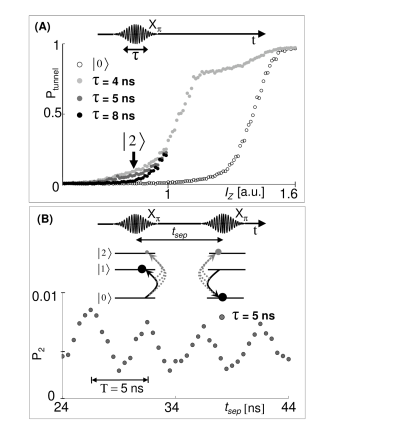
Initial experiments did not reach this level of performance. We only achieved high fidelity gates by using carefully shaped microwave pulses (see supplementary material section) to minimize excitation of the state Steffen2003 . There is a tradeoff between using a fast pulse for small errors, or a slow pulse for small Fourier amplitude at the transition frequency, as illustrated in the inset of Fig. 4. The measurement of this error is explicitly shown in Fig. 3A, where is plotted versus for a single -pulse using , and FWHM Gaussian pulses. Excitation to the state produces a shoulder in at a value of measurement current below the rise from the state, as indicated by the arrow. This probability is plotted versus Gaussian width in Fig. 4 and shows that this error decreases with increasing pulse width, as expected. Errors become difficult to measure below because of stray tunneling of the state.
The state error may be measured with much greater sensitivity by recognizing that excitation to the state is a coherent quantum process. Using a two-pulse sequence with variable time delay as illustrated in the inset of Fig. 3B, a Ramsey fringe may be set up between the transitions to the state from the two pulses. We plot in Fig. 3B the state probability versus pulse delay time . Since the periodic oscillation is due to coherent interference between the two pulses, the magnitude of this oscillation is four times the probability of exciting the state for a single pulse. More importantly, the “up-conversion” of a constant error to an oscillation allows a determination of the amplitude with fewer systematic errors; this error can now be reliably measured down to using this “Ramsey filter”. The oscillation frequency matches the beat frequency measured via spectroscopy (see supplementary material section), and represents a further check of this measurement technique.
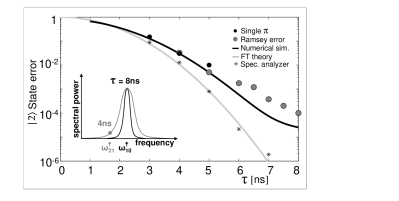
The state errors determined in this manner are also plotted in Fig. 4. For Gaussian pulses with width 4 and 5 ns, the data from the two methods give a consistent error probability. The error drops exponentially with increasing pulse width, reaching the value at 8 ns. A simple Fourier-transform prediction Steffen2003 is plotted as a solid gray line, which is computed from the power spectrum of the Gaussian pulse at frequency , normalized to the power at frequency . The asterisks are a measurement of this normalized power taken from the actual control pulses; this simple comparison is an excellent check on the shaping of the microwave pulses as we have found that large spectral leakage gives large qubit error. The solid black line is a prediction of the error obtained from numerical calculations Steffen2003 , which shows good agreement with the data.
In conclusion, we have demonstrated for single qubits an absolute gate fidelity of 0.98, the highest demonstrated in any solid state system to date. This level of performance was achieved through careful shaping of the microwave control signals. A new metrology tool, Ramsey error filtering, has been introduced, which uses the coherence of an error process for more accurate measurement. We have demonstrated that the probability of the state in our system can be reduced down to , a magnitude near the fault-tolerant threshold and that our quantum system remains in the qubit manifold during our single qubit operations. These measurements further demonstrate that superconducting qubits are a leading candidate for a solid-state quantum computer.
Devices were made at the UCSB and Cornell Nanofabrication Facilities, a part of the NSF-funded National Nanotechnology Infrastructure Network. This work was supported by ARDA under grant W911NF-04-1-0204 and NSF under grant CCF-0507227.
References
- (1) E. Knill, Nature 434, 39–44 (2005).
- (2) A. M. Steane, Nature 399, 124–126 (1999).
- (3) E. Knill, R. Laflamme, W. H. ZurekNature, Science 279, 342–345 (1998).
- (4) D. Gottesman, Phys. Rev. A 57, 127–137 (1998).
- (5) D. P. DiVincenzo, P. W. Shor, Phys. Rev Lett 77, 3260–3263 (1996).
- (6) D. Leibfried et al., Nature 422, 412–415 (2003).
- (7) J. Chiaverini et al., Nature 432, 602–605 (2004).
- (8) M. H. Devoret, J. M. Martinis, Quantum Inform. Process. 3, 163–203 (2004).
- (9) J. Q. You, F. Nori, Phys. Today 58, 42–47 (2005).
- (10) V. Bouchiat, D. Vion, P. Joyez, D. Esteve, M. H. Devoret, Physica Scripta T76, 165–170 (1998).
- (11) Y. Nakamura, Y. A. Pashkin, J. S. Tsai, Nature 398, 786–788 (1999).
- (12) D. Vion et al., Science 296, 886–889 (2002).
- (13) I. Chiorescu, Y. Nakamura, C. J. P. M. Harmans, J. E. Mooij, Science 299, 1869–1869 (2003).
- (14) Y. Makhlin, G. Schön and A. Schnirman, Rev. Mod. Phys. 73, 357 (2001).
- (15) M. Sillanpää, J. I. Park and R. W. Simmonds, Nature 449, 438–442 (2007).
- (16) J. Majer et al., Nature 449, 443–447 (2007).
- (17) J. H. Plantenberg, P. C. de Groot, C. J. P. M. Harmans and J. E. Mooij, Nature 447, 836–839 (2007).
- (18) A. O. Niskanen, K. Harrabi, F. Yoshihara, Y. Nakamura, S. Lloyd and J. S. Tsai, Science 316, 723–726 (2007).
- (19) M. Steffen et al., Science 313, 1423–1425 (2006).
- (20) J. M. Martinis, S. Nam, J. Aumentado, C. Urbina, Phys. Rev. Lett. 89, 117901 (2002).
- (21) M. A. Nielsen and I. L. Chuang, Quantum Computation and Quantum Information (Cambridge Univ. Press, 2000).
- (22) N. Katz et al. Science 312, 1498–1500 (2006).
- (23) M. Steffen et al., Phys. Rev. Lett. 97, 050502 (2006).
- (24) K. B. Cooper et al., Phys. Rev. Lett. 93, 180401 (2004).
- (25) We note that because of the short duration of these experiments, the coherence was not limited by ns.
- (26) M. Steffen, J. M. Martinis, I. L. Chuang, Phys. Rev. B. 68, 224518 (2003).
- (27) D. Slepian, The Bell system technical journal 57, 1371 (1978).
I Supplementary Material
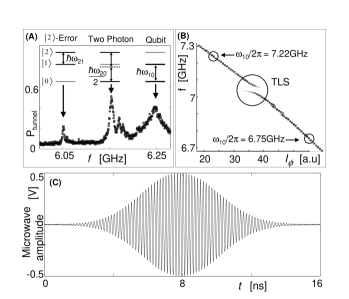
High-power spectroscopy reveals the transition frequencies between states , , and and directly measures the nonlinearity of the qubit. The probability of tunneling versus frequency is plotted in the Fig. 5A. The peak at corresponds to the qubit transition. The transition is lower in frequency, a value equal to the Ramsey error frequency. For this peak, the state is populated by off-resonant excitation of the transition due to the high power. A two-photon transition is also observed centered between these two resonances.
The Ramsey error filter data was taken for 4, 5, 6, 6.5, 7, 7.5, and 8 ns FWHM Gaussian pulses. For the longest length pulses, the experiment was repeated times.
Qubit spectroscopy is shown in Fig. 5B, where the probability of tunneling is plotted in grayscale for qubit frequency and qubit bias Cooper2004 . A two-level state (TLS) gives a resonance at that couples to the qubit with splitting size The qubit was operated above () and below () the TLS resonance.
Shown in Fig. 5C is an example of a Gaussian-shaped microwave pulse taken with a high-speed sampling oscilloscope. These pulses have nearly ideal spectral quality, and are significantly improved compared to those used in previous experiments Katz2006 . They are created with a continuous microwave source controlled by an IQ mixer fed by dual 1 GHz digital to analog converters (DAC). The microwave source drives in saturation the local oscillator input of the mixer at frequency . The DAC channels are generated in a custom board using AD9736 chips that have 14 bit resolution. They drive the I and Q ports through ( frequency) dissipative Gaussian lowpass filters and low distortion differential amplifiers. The microwave output of the mixer is filtered by a 7 pole Chebyshev lowpass filter at to suppress harmonics of . The large bandwidth of the control signal allows for sideband mixing. By applying sine and cosine waves at to the I and Q ports, the mixer generates an output signal at frequency . Sideband mixing allows for very high on/off ratios of qubit control since the (small) carrier leakage at is off resonance with the qubit. The digital control allows imperfections of the DAC chain and the IQ mixer to be corrected by first measuring its response function and then correcting it with deconvolution. The relative amplitudes and phases of the I and Q mixer channels are calibrated by minimizing the power at the opposite sideband . This is done at enough sideband frequencies so that all Fourier component of an arbitrary digital input signal can be corrected. In total, we obtain accurate pulse shapes with greater than suppression of spurious frequencies and harmonics.
For the gate fidelity measurements, the shape of the control pulses were Slepian Slepian1978 . These pulses have similar envelopes to Gaussians, but have tails that are strictly set to zero.