The spectrum of the Broad Line Region and the high-energy emission of powerful blazars
Abstract
High-energy emission (from the X-ray through the -ray band) of Flat Spectrum Radio Quasars is widely associated with the inverse Compton (IC) scattering of ambient photons, produced either by the accretion disk or by the Broad Line Region, by high-energy electrons in a relativistic jet. In the modelling of the IC spectrum one usually adopts a simple black body approximation for the external radiation field, though the real shape is probably more complex. The knowledge of the detailed spectrum of the external radiation field would allow to better characterize the soft-medium X-ray IC spectrum, which is crucial to address several issues related to the study of these sources. Here we present a first step in this direction, calculating the IC spectra expected by considering a realistic spectrum for the external radiation energy density produced by the BLR, as calculated with the photoionization code CLOUDY. We find that, under a wide range of the physical parameters characterizing the BLR clouds, the IC spectrum calculated with the black-body approximation reproduces quite well the exact spectrum for energies above few keV. In the soft energy band, instead, the IC emission calculated using the BLR emission shows a complex shape, with a moderate excess with respect to the approximate spectrum, which becomes more important for decreasing values of the peak frequency of the photoionizing continuum. We also show that the high-energy spectrum shows a marked steepening, due to the energy dependence of the scattering cross section, above a characteristic energy of 10-20 GeV, quasi independent on the Lorentz factor of the jet.
keywords:
quasars: general – X-rays: general – scattering – radiation mechanisms: non-thermal1 Introduction
Powerful gamma-ray emission (at energies MeV) is a distinctive feature of the group of Active Galactic Nuclei collectively known as blazars. As clearly shown by their Spectral Energy Distributions (e.g. Fossati et al. 1998), the gamma-ray emission belongs to a component different from the low-energy synchrotron bump, commonly ascribed to relativistic electrons in a jet pointing close to the observer. Among the models advanced to account for the high-energy component, the most widely discussed (also known as “leptonic models” to distinguish them from the other models involving hadronic reactions, e.g. Mücke et al. 2003) assumes that the emission is produced through the inverse Compton scattering between the synchrotron-emitting electrons and either the synchrotron photons (in the Synchrotron Self-Compton model, Maraschi et al. 1992) or photons from the regions outside the jet (the so-called External Compton models). In turn, external radiation can be dominated by the emission of the accretion disk (Dermer & Schlickeiser 1993), reaching the jet either directly or through reflection by free electrons, or by the emission of the clouds belonging to the Broad Line Region (Sikora et al. 1994). The most powerful blazars (Flat Spectrum Radio Quasars) display luminous broad emission lines and, in some cases, also show the clear presence of the “blue bump”, usually associated with the direct emission from the accretion disk (Sun & Malkan 1989). These indications strongly suggest that in FSRQs the high-energy component is dominated by the radiation produced through the EC process, likely with photons produced by the BLR (although the SSC emission can provide an important contribution in the medium-soft X-ray band).
Current models of the EC emission adopts a quite simplified description of the external radiation field, usually approximated with a bumpy, black-body like, spectrum (e.g. Inoue & Takahara 1996, Dermer, Sturner & Schlickeiser 1997, Ghisellini et al. 1998, Böttcher & Bloom 2000). In the case of EC models considering BLR radiation, this approach is justified with the argument that the spectrum of the seed photons is dominated by few strong emission lines (in particular the Lyα line). However, the actual spectrum of the soft photons can be more complex: besides the lines, there is the important contribution of the continuum emission, which (depending on the parameters characterizing the BLR clouds) could imprint important signatures in the EC emission. In particular, the shape of the soft radiation field would be reflected in the EC spectrum in the medium-soft X-ray band, produced by the electrons at the lower end of the energy distribution. The determination of the exact spectral shape in this band would be crucial for several reasons: 1) interesting constraints on the bulk Lorentz factor of the jet and the minimum electron energy can be derived from the observed spectral hardening below about 1 keV, expected to trace the shape of the seed photons (e.g. Tavecchio et al. 2007; Ghisellini et al. 2007); 2) alternatively, if the observed hardening below 1 keV in some high-redshift blazars is attributed to the presence of absorbing material at the quasar redshift (e.g. Elvis et al. 1994, Cappi et al. 1997, Reeves et al. 1997, Fiore et al. 1998, Fabian et al. 2001a,b, Bassett et al. 2004, Yuan et al. 2005, Page et al. 2005), the knowledge of the underlying continuum is essential to characterize the amount and the physical state of the intervening gas; 3) a correct description is also essential in view of the possible contribution in this band of the bulk-Comptonized radiation from cold leptons in the jet (Begelman & Sikora 1987, Celotti, Ghisellini & Fabian 2007).
Apart from these aspects, specifically related to the modelling of the soft X-ray emission, the knowledge of the diffuse radiation filling the regions surrounding the jet has a strong impact in the determination of the opacity of the environment to the gamma-ray photons (Liu & Bai 2006, Reimer 2007). The assessment of the effects of this “internal absorption” is mandatory in view of the possibility to use the absorption of gamma-rays to probe the optical-UV cosmic background (Chen et al. 2004, Reimer 2007).
With these motivations, in this work we intend to explore some of the implications of the detailed modelling of the diffuse radiation field from the BLR for the expected EC spectrum of powerful blazars. In particular, we calculate the spectrum emitted by the clouds, for a relatively large range of the parameters, using the photoionization code CLOUDY (Section 2). These spectra are then used to calculate the EC spectra (Section 3), which can be compared with the spectra obtained using the black-body approximation. Finally, in Section 4 we discuss the results.
2 The external radiation field
2.1 Setting the stage
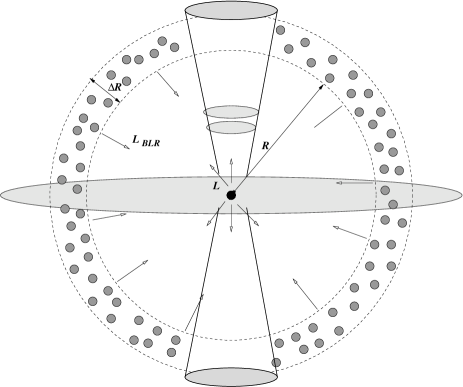
The geometry assumed for the modelling is depicted in Fig. 1. The central accretion flow illuminates the clouds residing in the BLR (characterized by the [total: ionized neutral] hydrogen density and the hydrogen column density ), assumed to be a spherical shell with inner radius and thickness . In the calculation we assume that the clouds cover a fraction of the solid angle viewed from the central illuminating source. The emission from the illuminated face of the clouds (comprising the reflected incident continuum, the emission lines and the diffuse continuum from clouds, see e.g. Korista & Ferland 1998) is assumed to isotropically fill the region within and it is calculated with version 05.07 of CLOUDY, described by Ferland et al. (1998)111See also http://www.nublado.org/. For simplicity we discuss only the case of solar abundance and we neglect the effect on the clouds of the net diffuse emission from the clouds themselves. We assume that the distance of the jet from the central black hole is negligible compared with the radius of the BLR. This assumption greatly simplifies the geometrical treatment. Furthermore we do not consider the possible contribution of photons originating in the disk, reaching the jet either directly or after being re-isotropized by intercloud gas (e.g. Celotti et al. 2007).
We adopt the spectrum of the illuminating continuum modelled as a combination of a UV bump with an X-ray power-law usually assumed in this kind of calculations (AGN model in CLOUDY, e.g. Korista & Goad 2001 and references therein):
| (1) |
Above 100 keV we assume a steep () power law mimicking the expected cut-off. This shape reproduces reasonably well the average spectra measured from AGNs (Francis et al. 1993; Elvis et al. 1994). The bump is assumed to have a cut-off in the IR band at 9.1 m (Korista et al. 1997), since most of the IR emission from AGNs is believed to originate in warm dust outside the BLR. The normalization constant is fixed to provide a value of , as typically observed in AGNs (e.g. Zamorani et al. 1981). The continuum is then fixed by assuming a normalization for the spectrum (parametrized using the bolometric luminosity ) and the temperature of the bump, .
Using this model for the continuum we calculate the diffuse emission of the BLR for the hydrogen density and the hydrogen column density of the clouds in the ranges cm-3 and cm-2, respectively. These intervals cover the region of the parameter space allowed by detailed modelling of the lines observed for few selected (radio-quiet) AGNs (e.g. Korista & Goad 2000; Kaspi & Netzer 1999). A caveat (which applies also to the choice of the spectral shape of the illuminating continuum) is that the present knowledge of the geometry and the physical state of the gas in the BLR mainly relies on the studies of (few) well-observed radio-quiet AGNs (mainly Seyfert galaxies). Indeed it is conceivable that for the sources for which we are interested here, namely powerful, radio-loud quasars, the conditions could be different. Note moreover that, for simplicity, we model the BLR with a unique value of the physical parameters, although the recent detailed models of emission lines quoted above seem to support the presence of a stratified BLR, with the parameters (density, column density, covering factor) varying with distance from the central source.
2.2 The spectrum of the BLR
In Fig. 2 we report some examples of the spectra of the diffuse BLR emission [plotted in the representation], calculated for different values of and , assuming the values K (which fixes the peak of the blue bump around Hz, dashed lines), erg/s and cm.

The large value of the luminosity is suitable to characterize the powerful quasars at medium-high redshift. Disk luminosity erg/s have been inferred from the optical-UV data of sources recently observed with Swift/UVOT (e.g. Tavecchio et al. 2007, Sambruna et al. 2007). The radius of the BLR has been fixed to a value between those provided by the relations found by Kaspi et al. (2007) and Bentz et al. (2006). These relations connect the luminosity at a given wavelength to the distance of the clouds emitting a given line, estimated through the reverberation mapping technique. The relations recently derived by Kaspi et al. is based on the CIV line and the continuum is evaluated at Å, while the Bentz et al. relation uses the H line and the continuum at Å. In both cases the relation has the same dependence, . The values of the monochromatic luminosities and depend on the spectral shape of the illuminating continuum. For the shape and the luminosity assumed here, the two relations provide relatively different values for , cm and cm for Kaspi et al. and Bentz et al., respectively. For the calculation shown in Fig. 2 we assume the (logarithmic) average value cm.
It is worth noting that, although calculated for a specific set of parameters, the spectra reported in Fig. 2 can be easily generalized to different values of and BLR radius. Indeed, the normalization of the diffuse spectrum simply scales as the luminosity , while the shape (continuum and lines) only depends (at the first order) on the ionization parameter (in terms of , the spectra in Fig. 2 correspond to and 3, from bottom to top, respectively). Different combination of , and can thus produce similar spectra. Note that, if and are linked by a relation of the form as discussed above, the ionization parameter in different sources would only depend on the density of the clouds (assuming similar spectra for the photoionizing continuum), since the ratio would be a fix number in different sources.
As expected, the total luminosity of the diffuse emission is dominated by the optical-UV emission, and, in particular, by few prominent lines in this band, most notably the Lyα lines of H (1216 Å) and HeII (303 Å). In all cases the underlying continuum around the peak (dominated by recombinations and scattering, both Thomson and Rayleigh) contributes to few percent of the total luminosity. However, the continuum (mainly due to free-free emission) dominates below the peak (below Hz), making the spectrum much broader than the black body approximation. As we discuss later, this fact has a direct consequence on the derived EC spectrum.
Some trends are clearly visible in Fig. 2. Increasing (left to right) has the effect to increase the total emitted luminosity and, importantly, to increase the relative contribution of the optical-UV continuum with respect to the emission lines. The increase of the density (bottom to top), instead, has the effect of reducing the ionization parameter and leads to increase the importance of the recombinations (as witnessed by the prominent edges).
An interesting feature of these spectra is the presence of an important X-ray component, originating from the Compton reflection on the cloud gas (analogously to the “reflection bump” from accretion disks). As expected, the fraction of the X-ray continuum (and of the overall continuum) reflected by the BLR increases (from left to right) with the column density . Increasing (from bottom to top) the density , instead, has the effect of reducing the reflected X-ray luminosity, since the ionization parameter (and thus, for the same value of the column density, the number of free electrons available for scattering) decreases. The decreased ionization state of the gas is also responsible for the deepening of the depression visible in the soft X-ray band, caused by photoelectric absorption. The presence of an important diffuse X-ray emission inside the BLR could have important consequences for the propagation of -rays with MeV produced by the jet (Ghisellini et al. 2008, in preparation).

The basic features of the BLR emission do not strongly depend on the actual shape of the photoionizing continuum. The effect of a different temperature is illustrated by Fig. 3, reporting the SEDs of the BLR reflection calculated for the case cm-3, cm-2 and K. The overall shape of the SEDs is similar to the high-temperature case (Fig. 2, central panel). However, the lower temperature has the effect to decrease the relative flux of the ionizing photons, leading to decrease the luminosity of the emission lines relative to that of the continuum (whose peak, moreover, moves to lower frequencies by a factor of ). As we show later, the increasing importance of the continuum with respect to the lines can significantly affect the resulting EC spectrum.

3 Inverse Compton spectra
3.1 The external energy density in the jet frame
To calculate the IC emission produced by relativistic electrons scattering off the diffuse emission of the BLR we have first to transform the spectrum of the seed photons to the jet frame, assumed to move with bulk Lorentz factor . We consider only the photons emitted by the emispheric portion of the BLR above the accretion disk, since the disk “occults” the other emisphere.
Because of relativistic aberration, all photons are observed in the jet frame as coming into a narrow cone of semiaperture with the axis aligned along the jet speed. Within this cone, the radiation field coming from different angles are observed to have different frequencies and intensities, maximum along the axis and minimum at the edge. The result is that an external monochromatic radiation field with frequency is observed in the jet frame to have a hard spectrum (, we use the prime to indicate quantities evaluated in the jet frame), between (photons coming from the cone edge) and (photons at the axis of the cone). This can be shown in the following way. For an external radiation field with specific intensity , the corresponding radiation energy density in the jet frame is:
| (2) |
where we use the invariance of the ratio (e.g. Rybicki & Lightman 1979) and the integral is extended over the angles in the range . Now we change the variable of integration from to using:
| (3) |
and we obtain:
| (4) |
where the new limits become and . In the case of a monochromatic external field, we obtain:
| (5) |
One can check that, es expected, .
Using Eq. (4) we can now calculate the energy density of the BLR radiation in the jet frame. An example is reported in Fig. 4 for the reference case cm-3, cm-2, K. The effect of the boosting is clearly visible for the Lyα line, which is transformed into a broad (extending from to ), hard () feature. Due to the relativistic broadening most of the lines merge in few broad features. In view of the comparison between the EC spectrum calculated by using the BLR emission and the approximated one, we define the black body which best approximate the boosted BLR emission, with the peak corresponding to the frequency and with normalization equal to that of the integral of the boosted BLR radiation energy density (dominated by the line). It is shown in Fig. 4 by the dashed line.

3.2 The EC spectrum
Using the energy density in the jet frame we can now compute the EC spectrum. To this aim we use the radiative model fully described in Maraschi & Tavecchio (2003). Briefly, we assume that the emission region, moving with bulk Lorentz factor at an angle (therefore the relativistic Doppler factor222given by is ) is isotropically filled with relativistic electrons, assumed to have a smoothed broken power-law electron energy distribution, extending from the energy to , with slopes and below and above the break located at Lorentz factor . This (purely phenomenological) form has been assumed to reproduce the observed shape of the blazar SEDs, without any specific assumption on the acceleration/cooling mechanism acting on the particles.
In Fig. 5 we report the spectra that we obtain for all the BLR models shown in Fig. 2 (EC/BLR), using ,, , , , (values usually derived from the modelling of FSRQs, see e.g. Ghisellini et al. 1998; Maraschi & Tavecchio 2003). The electron energy distribution has been normalized arbitrarily. For comparison, we also report (dashed line) the spectra calculated using the black-body approximation defined above (EC/BB). This can be simply described by three power laws with smooth transitions: 1) an extremely hard power law () below a “break frequency” Hz ; 2) a power law with spectral index between and (marking the position of the EC peak); 3) a steeper power law with slope from up to the frequency .
3.2.1 The low-energy spectrum
In all cases the EC/BLR spectra agree quite well with the EC/BB ones down to the frequency , marking the position of the peak of the emission from the electrons at the lower end . Below this frequency, the slope reflects the shape of the spectrum of the seed photons. Thus, the flux of the EC/BB decreases as . Instead, the corresponding EC/BLR spectra shows a tail in excess of the EC/BB spectra, clearly following the excess of soft photons with respect to a black-body shown by the BLR continuum (see Fig. 4). In other words, soft X-ray spectra calculated with the EC/BLR tends to be softer than the corresponding EC/BB spectra. To better clarify this point we report in Fig. 6 the EC/BB (top) and the EC/BLR (bottom) spectra (calculated for cm-3 and cm-2) with the contribution of electrons in different “slices” of energy. For sufficiently thin slices the EC spectral shape simply reflects the incoming spectrum of the seed photons (broadened by the boosting into the jet frame). The broad BLR spectrum results in a tail (roughly hardening from to ) in excess to the narrow peaked black-body shape.

EC/BLR spectra in Fig. 5 shows clear trends related to the features of the corresponding BLR spectra. In particular, the luminosity increases for increasing (left to right), following the corresponding increase of the luminosity displayed by the BLR emission. Moreover, a better agreement between the EC/BLR and EC/BB in the soft X-ray band spectra is visible for low . This is clearly related to the fact that low column densities imply a minor contribution of the continuum to the total BLR luminosity. At large column densities, instead, the relative importance of the continuum grows and therefore the discrepancy between the two kind of spectra becomes more and more important. Note that in this case even the power law above 1 keV becomes slightly softer.

All the effects described above become more important in the case of the low-temperature disk, reported in Fig. 7. In this case, as already noted, the continuum/line luminosity ratio is larger than in the high-temperature case (as clearly visible in the spectrum of the boosted BLR radiation energy density shown in the inset) and thus the discrepancy between the EC/BB and the EC/BLR increases. In particular, the EC/BLR continuum appears much broader than the corresponding EC/BB spectrum.
3.2.2 The high-energy spectrum
At high frequencies both the EC/BLR and the EC/BB spectra shows a rapid decrease above Hz. The reason for such a cut-off in the spectrum is the decreased rate of the IC scatterings in the Klein-Nishina (KN) regime. To derive an approximate estimate of the cut-off frequency expected from the KN, , let us assume a monochromatic radiation field with frequency . In the rest frame of the jet the boosted frequency is . Electrons with Lorentz factors scatter these photons in the Thomson regime as long as , producing photons with frequency . Using this expression for the frequency of the outcoming photon, the condition that the scattering happens in the Thomson limit can be written as . These photons are observed at the frequency . Thus, using quantities in the observer frame, we can express the condition above as:
| (6) | |||||

Note that typically and thus this expression does not contain the bulk Lorentz factor of the jet. In this case the frequency above which the EC spectrum starts to drop due to the KN effects only depends on the frequency of the soft photons, .
Even if peaked at , the external photon field is not monochromatic, thus, instead of an abrupt break, the EC spectrum shows a progressive decrease of the flux. Moreover, also the use of the KN cross section contribute to smooth the spectrum. An example of the high-energy spectrum (calculated for the case cm-3 and cm-2) is shown in Fig. 8, assuming a simple power-law electron energy distribution and two different spectral indices, and (solid lines). For comparison we also report (dashed lines) the same spectra calculated using the “step function” approximation for the KN cross section (e.g. Ghisellini et al. 1998). In this case a sudden drop of the emission, located at the frequency provided by Eq. (6), is visible. In the spectra calculated with the exact cross section this feature is instead “smoothed” and the spectrum displays a continuous decrease.
3.3 Application: GB B1428+4217
As an application of the model discussed above, in Fig. 9 we show the comparison between the emission calculated with the EC model and the XMM-Newton spectrum of GB B1428+4217, a powerful blazars located at high redshift (). The X-ray spectrum shows a large deficit of soft photons with respect to the extrapolation of the power-law fitting the data above 1 keV. The lack of soft photons in this and other high- radio-loud quasars has been often interpreted as the signature of the presence of large amounts of absorbing gas in the quasar environment (Worsley et al. 2004). However, a direct alternative is that the low-energy cut-off is due to the intrinsic hardening of the EC emission below (e.g. Celotti et al. 2007, Tavecchio et al. 2007). Here we tried to reproduce the spectrum with the EC/BLR model, trying to find the (probably not unique) set of parameters which closely reproduces the data. The corresponding EC/BB spectrum is also shown for comparison. We fix erg/s accordingly to that provided by optical-UV data, assumed to trace the disk emission. As before, is fixed close to the average of the values given by Kaspi et al. and the Bentz et al. relations. All the other relevant parameters have been fixed to “standard” values, cm-2, cm-2, , , .

As expected, the EC/BLR spectrum shows a tail below Hz (in the quasars rest frame) softer than . As discussed above, this seems to be an unavoidable and robust feature of the EC/BLR spectra, due to the contribution of the BLR continuum to the EC emission. Instead, if the lack of soft photons is the result of absorption, the emission should continue to decrease almost exponentially. Therefore, observations extending down to very low energy and/or sources located at minor distance (so that the spectrum is less redshifted) could be used to to discriminate between the alternative interpretation for the deficit of low-energy photons.
4 Discussion
We have calculated the expected diffuse emission filling the BLR region of radio-loud quasars, under quite general assumptions on the physical parameters of the system. This external radiation field is thought to dominate in the jet over the synchrotron photons (External Compton emission), hence contributing to the bulk of the inverse Compton emission (Sikora et al. 1994). In all cases, few emission lines dominate the total luminosity. However, for frequencies below Hz, the emission is dominated by the continuum (mainly from free-free emission). We have presented for the first time the EC spectra expected from the comptonization of realistic BLR spectra, showing that the black body approximation (peaked at 1.5 ) for the external radiation field is rather good down to the soft X-ray band. Below 1 keV, however, the spectra calculated with the BLR spectra show an excess, due to the important contribution of the BLR continuum.
The presence of this tail in the EC emission can be used to effectively discriminate the origin of the observed lack of soft photons observed in several high-redshift radio-loud quasars. This evidence is generally attributed to the absorption by a huge amount (column densities of the order of cm-2) of gas in the vicinity of the jet (e.g., Elvis et al. 1994, Cappi et al. 1997, Reeves et al. 1997, Fiore et al. 1998, Fabian et al. 2001a,b, Bassett et al. 2004, Yuan et al. 2005, Page et al. 2005), whose presence is predicted to be important especially at high redshifts (e.g. Fabian et al. 1999). However, the fact that, apparently, only the radio-loud quasars display such a deficit of soft photons can suggest that it can be due to the intrinsic shape of the EC emission dominating in this energy band (e.g. Tavecchio et al. 2007, Sambruna et al. 2007). Indeed, as we have shown for the specific case of GB B1428+4217, this possibility seems to be viable even considering a realistic spectrum for the BLR emission. However, after the hardening around 1 keV, the EC spectrum should display a softer tail extending at low energies. Future observations could be effectively reveal such a tail. On the contrary, very hard spectra extending down into the soft X-ray band can be a strong support to the absorption scenario.
Another interesting point related to the physics of jets concerns the value of the minimum Lorentz factor of the emitting electrons, . Having fixed the spectral shape of the seed photons for the EC process, the position of the break in the spectrum is only related to the product (see also Maraschi & Tavecchio 2003, Ghisellini et al. 2007). Values of larger than 1 would move the position of the break at frequencies larger than observed. The break could be located at the right position decreasing the value of the bulk Lorentz factors. For instance assuming in the case of GB B1428+4217 would require . These values however, seem to be inconsistent with those inferred from the modelling of the SED, usually in the range 15-20 (e.g. Celotti & Ghisellini 2008).
The discussion above does not consider the contribution to the EC process of the soft radiation coming from other regions, as the disk itself (directly or reprocessed) or from the putative obscuring torus (Błażejowski et al. 2000). In the cases the corresponding EC emissions should extend at very low frequencies (close to the optical band), unless the value of is rather large (e.g. Celotti et al. 2007). Therefore in this case the absorption would be the only possible explanation for the presence of cut-offs the soft X-ray band. Moreover, we also neglect in the discussion the contribution of the SSC component, important especially in the soft X-ray band. However, from the observational point of view the the SSC component seems to be less important in powerful sources (maybe due to an increasing importance of the accretion disk and then of the external radiation field: e.g., Celotti et al. 2007), leaving an almost “naked” EC component.
Besides the problems related to the description of the soft EC spectrum, the modelling of the BLR radiation field is rather important also in view of the estimate of the opacity of the quasar environment to -rays. Indeed absorption of multi GeV photons inside the quasar can represent a serious problem for the possible use of blazars as probes of the optical-UV cosmic background. Recent works (Liu & Bai 2006, Reimer 2007) uses approximate spectra of the BLR to calculate the expected opacity to gamma-rays. We note here that another effect, besides internal absorption, is important in shaping the intrinsic high-energy spectrum of powerful quasars. Indeed, as we have discussed in Sect. 3.2.2, the EC spectrum above few tens of GeV is affected by a strong depression, due to KN effects. The coupling of these effects (KN regime and internal absorption) will probably result in a rather soft and dim emission above GeV, making it rather difficult to use blazars as probes of the optical-UV extragalactic background, unless some other radiative mechanisms dominates the high energy emission.
Acknowledgments
We thank Gary Ferland for maintaining his freely distributed code CLOUDY.
References
- [\citeauthoryearBassett et al.2004] Bassett L. C., Brandt W. N., Schneider D. P., Vignali C., Chartas G., Garmire G. P., 2004, AJ, 128, 523
- [\citeauthoryearBegelman & Sikora1987] Begelman M. C., Sikora M., 1987, ApJ, 322, 650
- [\citeauthoryearBentz et al.2006] Bentz M. C., Peterson B. M., Pogge R. W., Vestergaard M., Onken C. A., 2006, ApJ, 644, 133
- [\citeauthoryearBłażejowski et al.2000] Błażejowski M., Sikora M., Moderski R., Madejski G. M., 2000, ApJ, 545, 107
- [\citeauthoryearBöttcher & Bloom2000] Böttcher M., Bloom S. D., 2000, AJ, 119, 469
- [\citeauthoryearCappi et al.1997] Cappi M., Matsuoka M., Comastri A., Brinkmann W., Elvis M., Palumbo G. G. C., Vignali C., 1997, ApJ, 478, 492
- [\citeauthoryearCelotti, Ghisellini, & Fabian2007] Celotti A., Ghisellini G., Fabian A. C., 2007, MNRAS, 375, 417
- [\citeauthoryearCelotti& Ghisellini 2008] Celotti A., Ghisellini G., 2008, MNRAS, submitted
- [\citeauthoryearChen, Reyes, & Ritz2004] Chen A., Reyes L. C., Ritz S., 2004, ApJ, 608, 686
- [\citeauthoryearDermer & Schlickeiser1993] Dermer C. D., Schlickeiser R., 1993, ApJ, 416, 458
- [\citeauthoryearDermer, Sturner, & Schlickeiser1997] Dermer C. D., Sturner S. J., Schlickeiser R., 1997, ApJS, 109, 103
- [\citeauthoryearElvis et al.1994] Elvis M., et al., 1994, ApJS, 95, 1
- [\citeauthoryearFabian1999] Fabian A. C., 1999, MNRAS, 308, L39
- [\citeauthoryearFabian et al.2001] Fabian A. C., Celotti A., Iwasawa K., Ghisellini G., 2001a, MNRAS, 324, 628
- [\citeauthoryearFabian et al.2001] Fabian A. C., Celotti A., Iwasawa K., McMahon R. G., Carilli C. L., Brandt W. N., Ghisellini G., Hook I. M., 2001b, MNRAS, 323, 373
- [\citeauthoryearFerland et al.1998] Ferland G. J., Korista K. T., Verner D. A., Ferguson J. W., Kingdon J. B., Verner E. M., 1998, PASP, 110, 761
- [\citeauthoryearFiore et al.1998] Fiore F., Elvis M., Giommi P., Padovani P., 1998, ApJ, 492, 79
- [\citeauthoryearFossati et al.1998] Fossati G., Maraschi L., Celotti A., Comastri A., Ghisellini G., 1998, MNRAS, 299, 433
- [\citeauthoryearFrancis, Hooper, & Impey1993] Francis P. J., Hooper E. J., Impey C. D., 1993, AJ, 106, 417
- [\citeauthoryearGhisellini et al.2007] Ghisellini G., Foschini L. Tavecchio F. & Pian E., 2007, MNRAS, 382, L82
- [\citeauthoryearGhisellini et al.1998] Ghisellini G., Celotti A., Fossati G., Maraschi L., Comastri A., 1998, MNRAS, 301, 451
- [\citeauthoryearInoue & Takahara1996] Inoue S., Takahara F., 1996, ApJ, 463, 555
- [\citeauthoryearKaspi & Netzer1999] Kaspi S., Netzer H., 1999, ApJ, 524, 71
- [\citeauthoryearKaspi et al.2007] Kaspi S., Brandt W. N., Maoz D., Netzer H., Schneider D. P., Shemmer O., 2007, ApJ, 659, 997
- [\citeauthoryearKorista et al.1997] Korista K., Baldwin J., Ferland G., Verner D., 1997, ApJS, 108, 401
- [\citeauthoryearKorista & Ferland1998] Korista K., Ferland G., 1998, ApJ, 495, 672
- [\citeauthoryearKorista & Goad2000] Korista K. T., Goad M. R., 2000, ApJ, 536, 284
- [\citeauthoryearKorista & Goad2001] Korista K. T., Goad M. R., 2001, ApJ, 553, 695
- [\citeauthoryearLiu & Bai2006] Liu H. T., Bai J. M., 2006, ApJ, 653, 1089
- [\citeauthoryearMaraschi, Ghisellini, & Celotti1992] Maraschi L., Ghisellini G., Celotti A., 1992, ApJ, 397, L5
- [Maraschi & Tavecchio(2003)] Maraschi L., & Tavecchio F. 2003, ApJ, 593, 667
- [\citeauthoryearMücke et al.2003] Mücke A., Protheroe R. J., Engel R., Rachen J. P., Stanev T., 2003, APh, 18, 593
- [\citeauthoryearPage et al.2005] Page K. L., Reeves J. N., O’Brien P. T., Turner M. J. L., 2005, MNRAS, 364, 195
- [\citeauthoryearReeves et al.1997] Reeves J. N., Turner M. J. L., Ohashi T., Kii T., 1997, MNRAS, 292, 468
- [\citeauthoryearReimer2007] Reimer A., 2007, ApJ, 665, 1023
- [\citeauthoryearRybicki & Lightman1979] Rybicki G. B., Lightman A. P., 1979, New York, Wiley-Interscience
- [\citeauthoryearSambruna et al.2007] Sambruna R. M., Tavecchio F., Ghisellini G., Donato D., Holland S. T., Markwardt C. B., Tueller J., Mushotzky R. F., 2007, ApJ, in press (arXiv:0707.2925)
- [\citeauthoryearSikora, Begelman, & Rees1994] Sikora M., Begelman M. C., Rees M. J., 1994, ApJ, 421, 153
- [\citeauthoryearSun & Malkan1989] Sun W.-H., Malkan M. A., 1989, ApJ, 346, 68
- [\citeauthoryearTavecchio et al.2007] Tavecchio F., Maraschi L., Ghisellini G., Kataoka J., Foschini L., Sambruna R. M., Tagliaferri G., 2007, ApJ, 665, 980
- [\citeauthoryearWorsley et al.2006] Worsley M. A., Fabian A. C., Pooley G. G., Chandler C. J., 2006, MNRAS, 368, 844
- [\citeauthoryearWorsley et al.2004] Worsley M. A., Fabian A. C., Celotti A., Iwasawa K., 2004, MNRAS, 350, L67
- [\citeauthoryearYuan et al.2005] Yuan W., Fabian A. C., Celotti A., McMahon R. G., Matsuoka M., 2005, MNRAS, 358, 432
- [\citeauthoryearZamorani et al.1981] Zamorani G., et al., 1981, ApJ, 245, 357