The Structure of Protoplanetary Disks Surrounding Three Young Intermediate Mass Stars ††thanks: Based on observations collected at the European Southern Observatory, Paranal, Chile. (Program ID 077.C-0521A)
We present high spectral resolution optical spectra of three young intermediate mass stars, in all of which we spectrally resolve the 6300 Å [OI] emission line. Two of these have a double peaked line profile. We fit these data with a simple model of the [OI] emission caused by photo-dissociation of OH molecules in the upper layer of a circumstellar disk by stellar UV radiation and thus translate the Doppler broadened [OI] emission profile into an amount of emission as a function of distance from the central star. The resulting spectra are in agreement with the expected disk shapes as derived from their spectral energy distribution. We find evidence for shadowing by an inner rim in the disk surrounding HD101412 and see a flaring disk structure in HD179218 while the [OI] spectrum of HD135344 B is more complex. The [OI] emission starts for all three targets at velocities corresponding to their dust sublimation radius and extends up to radii of 10 – 90 AU. This shows that this method can be a valuable tool in the future investigation of circumstellar disks.
1 Introduction
HD101412, HD135344 B and HD179218 are three isolated young intermediate mass stars. Two of them, HD101412 and HD179218 are Herbig Ae/Be (HAEBE) stars while the third, HD135344 B (often incorrectly referred to as HD135344 in the literature), is a classical T Tauri star of spectral type F. HAEBE stars are the more massive counterparts of T Tauri pre-main-sequence stars with typical masses of 2 - 8 M⊙. Their spectral energy distribution (SED) is characterized by the presence of an infrared excess due to thermal re-emission of circumstellar dust which is thought to be the signature of a circumstellar disk. Previous studies of these stars and their circumstellar disks have focused mainly on this dust (e.g Hillenbrand et al. (1992), Natta et al. (2001), Mannings & Sargent (1997) and Meeus et al. (2001)).
Dust however contains only 1 % of the mass of the disk and it is unclear whether this dust is coupled to the other 99% of the disk mass, the gas. To check this coupling and to get a better picture of circumstellar disks in general, it is necessary to study the dust as well as the gas located in circumstellar disks simultaniously. Next to the abundance, there are other reasons such as its potential to probe the dynamics and the physical and chemical structure of disks that illustrate why the circumstellar gas is of interest. Historically it has been very difficult to study the circumstellar gas, but the development of bigger mirrors and better spectrographs in the recent years has opened the way for several gas diagnostics. These include hot and cold CO gas (e.g. Bik & Thi (2004); Blum et al. (2004); Blake & Boogert (2004) and Najita et al. (2003)), hot water (e.g. Carr et al. (2004)) and molecular hydrogen (e.g. Carmona et al. (2008); Bitner et al. (2007) and Martin-Zaïdi et al. (2007)).
Acke et al. (2005) and Acke & van den Ancker (2006) have added molecular oxygen to this list. They have developed a method for examining excited neutral oxygen atoms in the surface of a flared, rotating passive disk that they have tested on 2 HAEBE stars: HD97048 and HD100546. With their method, they resolve the disk rotation and the distribution of the emitting gas in the surface layer of the circumstellar disk and also find evidence for a gap in the disk around HD100546 that they interpret as due to the presence of an orbiting body of planetary mass within the circumstellar disk.
In this paper we apply the method of Acke et al. (2005) on three more stars, one of which has a non-flaring (flat) disk geometry. We first describe these stars, together with our observations and data reduction in Sections 2 and 3, then proceed to describe the method and the resulting spectra in Section 4 and discuss these results in Section 5. We have also observed our targets with VLT/MIDI to get spatially resolved observations of the 10 m silicate bump whose emission originates from warm dust in the same region as the [OI] emission. The results of these interferometric observations will be presented in Fedele et al. (2008, in prep; Paper II).
2 Observations and Data Reduction
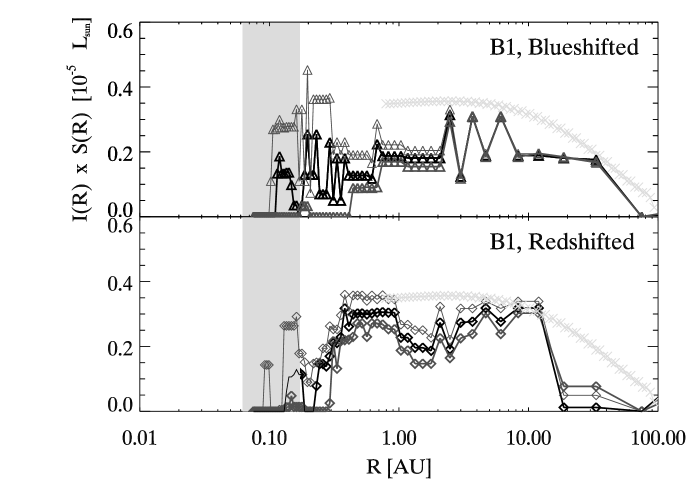
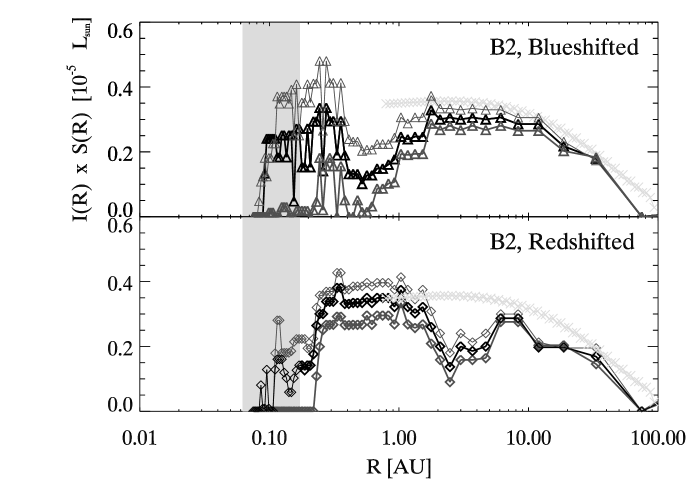
We obtained high spectral resolution échelle spectra of HD101412 , HD135344 B and HD179218 during 4 nights with the KUEYEN 8.2 meter ESO VLT coupled to the UVES spectrograph (Dekker et al. 2000). The observation log is presented in table 1. The data was reduced with the UVES111http://www.eso.org/instruments/uves/ pipeline222http://www.eso.org/projects/dfs/dfs-shared/web/uves/uves-pipe-recipes.html which performs wavelength calibration, order extraction, background subtraction and flatfield correction. The observations consist of 4 data sets per target. Half of these sets were taken with the slit unrotated (0 degrees), and the other half with the slit rotated 90 degrees. The spectra have a spectral resolution of , determined using the telluric absorption lines around the 6300 Å [OI] feature. All three sources are spatially unresolved. We derive upper limits on their angular size using a 3 detection limit and following the same procedure as e.g. Hirth et al. (1994), Hirth et al. (1997) and Acke & van den Ancker (2006). The upper limits to the size of the emitting region are 0.25 arcsec corresponding to 39 AU for HD101412, 0.26 arcsec or 36 AU for HD135344 B and 0.22 arcsec or 53 AU for HD179218 . These sizes represent the radii that contain 95 of the flux in the 6300 Å [OI] line. The observations were made at two different dates to coincide with VTLI/MIDI observations of the same targets in the mid-infrared (N-band). Since the spectra taken with different slit orientation show negligible variation they have been averaged. The data procured at different times however do show temporal change and therefore are handled independently. They will be referred to as B1 (May 15 - 17) and B2 (June 16 & July 3, 4) in this paper.
| Object | Date | UT | Exp. time | PA | B | S/N |
| dd/mm/yy | hh:mm:ss | [s] | [∘] | |||
| HD101412 | 15/05/06 | 23:37:48 | 300 | 0 | B1 | 174 |
| 15/05/06 | 23:43:45 | 300 | 0 | B1 | 199 | |
| 15/05/06 | 23:50:04 | 300 | 0 | B1 | 189 | |
| 15/05/06 | 23:56:01 | 300 | 0 | B1 | 175 | |
| 17/05/06 | 00:39:17 | 300 | 90 | B1 | 183 | |
| 17/05/06 | 00:45:15 | 300 | 90 | B1 | 207 | |
| 17/05/06 | 00:51:13 | 300 | 90 | B1 | 155 | |
| 17/05/06 | 00:57:09 | 300 | 90 | B1 | 199 | |
| 03/07/06 | 23:52:01 | 300 | 0 | B2 | 149 | |
| 03/07/06 | 23:58:00 | 300 | 0 | B2 | 141 | |
| 04/07/06 | 00:03:58 | 300 | 0 | B2 | 161 | |
| 04/07/06 | 00:09:53 | 300 | 0 | B2 | 151 | |
| 04/07/06 | 00:18:58 | 300 | 90 | B2 | 137 | |
| 04/07/06 | 00:24:53 | 300 | 90 | B2 | 144 | |
| 04/07/06 | 00:30:48 | 300 | 90 | B2 | 135 | |
| 04/07/06 | 00:36:46 | 300 | 90 | B2 | 155 | |
| HD135344 B | 17/05/06 | 04:19:43 | 300 | 0 | B1 | 197 |
| 17/05/06 | 04:25:39 | 300 | 0 | B1 | 196 | |
| 17/05/06 | 04:35:08 | 300 | 90 | B1 | 234 | |
| 17/05/06 | 04:41:04 | 300 | 90 | B1 | 262 | |
| 16/06/06 | 03:49:40 | 300 | 0 | B2 | 144 | |
| 16/06/06 | 03:55:36 | 300 | 0 | B2 | 143 | |
| 16/06/06 | 04:06:12 | 300 | 90 | B2 | 227 | |
| 16/06/06 | 04:12:29 | 300 | 90 | B2 | 240 | |
| HD179218 | 17/05/06 | 06:50:00 | 180 | 0 | B1 | 309 |
| 17/05/06 | 06:56:28 | 180 | 90 | B1 | 237 | |
| 16/06/06 | 04:22:43 | 180 | 0 | B2 | 293 | |
| 16/06/06 | 04:28:05 | 180 | 90 | B2 | 251 |
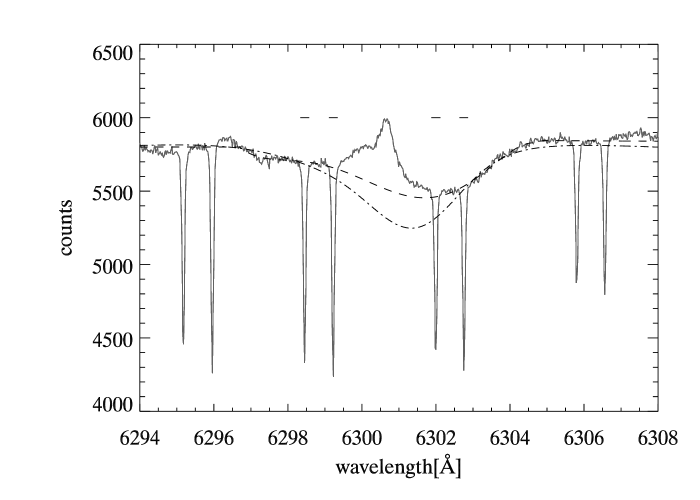
We determined the radial velocity for our targets from the difference between the measured line center and the theoretical line center for 9 to 31 atmospheric absorption lines observed in the same spectrum. The errors have been determined by bootstrapping the data set, i.e. by estimating the variability of the radial velocity from the variability of this velocity between sub samples. The size of the sub samples used are 90% of the total sample and we have estimated the variability by calculating the mean of the subsample a 1000 times. The results are shown in Table 2. The [OI] 6300 Å line is located in between several telluric absorption lines. To remove these, we fit and fill the absorption lines with a Gaussian, and average the telluric line region over 3/2 FWHM to suppress telluric line residuals. These telluric absorption lines only overlap the [OI] spectral region on the red wing of HD101412. The results are shown in Figures 1 - 3. In these Figures we also show the location of the 6300 Å [OI] sky emission line. This line has been removed by calculating the sky emission from averaging above and below the echelle order and subtracting this from the final spectrum. Because the sky emission is very weak compared to the flux collected from the targets, the procedure has no significant effect on either the resulting spectrum or the signal to noise.
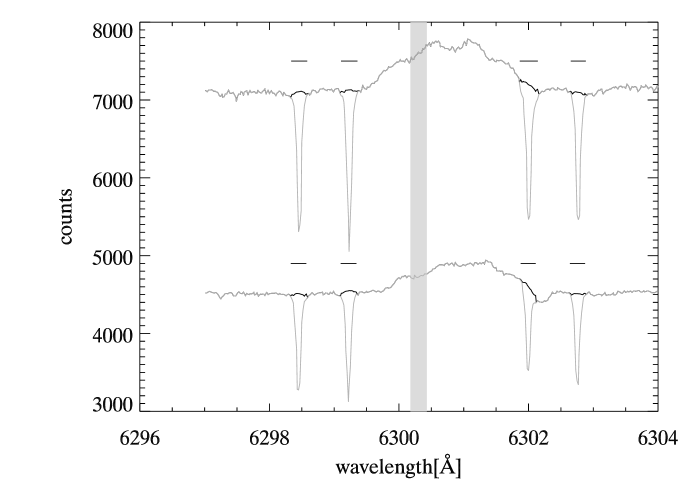
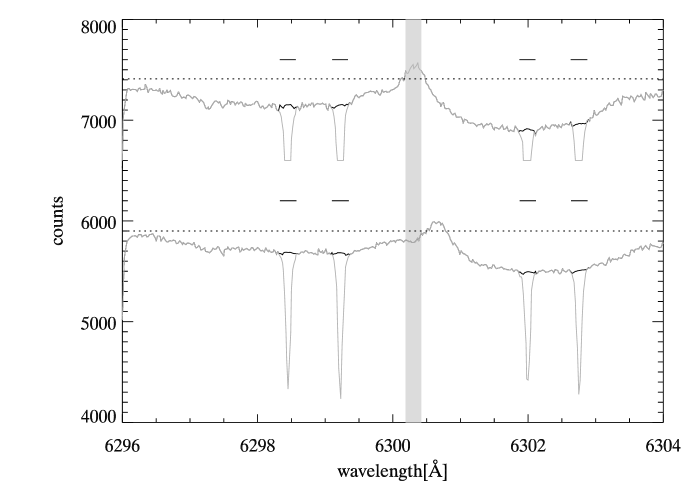
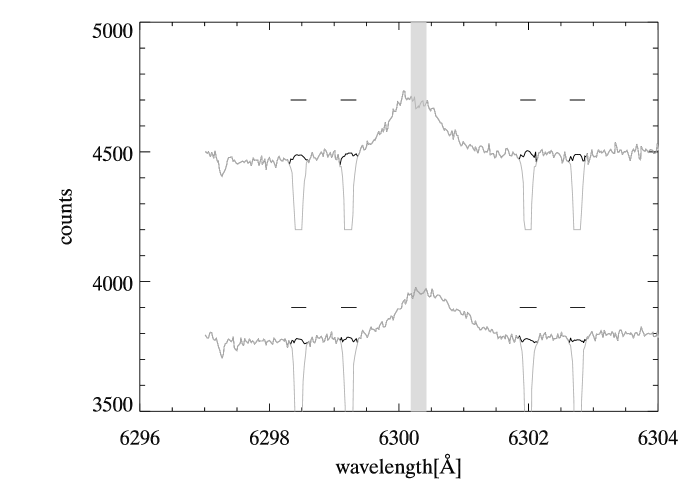
The spectra were also corrected for their radial and barycentric velocity. Then we normalize the spectra and convert them to velocity profiles around the central wavelength of the [OI]6300 Å line (6300.304 Å). The resulting spectra of HD101412 and HD179218 are shown in Figures 4 and 6 while the spectrum of HD135344 B in Figure 5 needs to undergo one more reduction step to correct for the underlying photospheric absorption lines as discussed in section 4.2.2.
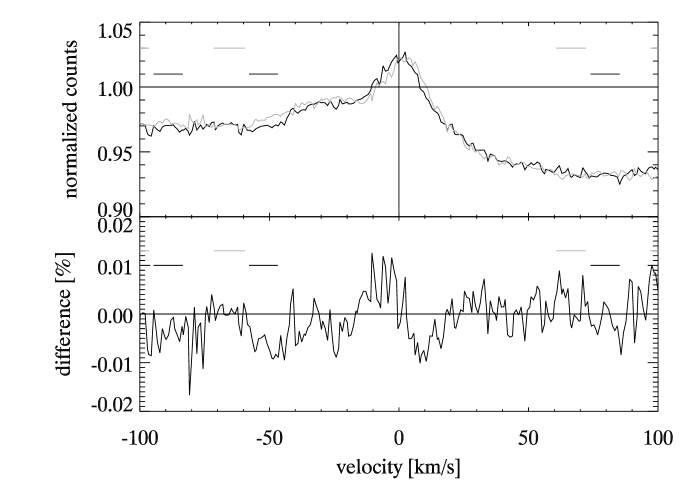
The spectra of HD101412 and HD179218 both show a double peaked [OI] line profile indicating the presence of a circumstellar disk and temporal variance indicating disk inhomogeneity. HD101412 shows a maximum signal of 10 % above the continuum, has 60 km s-1 wide wings and displays next to the double peak two extra ’shoulders’. The data also show temporal change with a more pronounced double peak in the B1 data as well as more flux in the shoulders. We deduce that the difference between the two lines on the red wing at 50 km s-1 in the B2 data seen in Figure 4 is not due to temporal variability because it drops below the continuum. It is also not present in the [OI] emission at 6363 Å and thus real absorption. This line coincides with the telluric absorption in the B1 data and therefore does not show in that spectum. We have compared this spectrum with that of HD34364, another B9.5V star but failed to identify the absorption feauture, thus ruling out photospheric absorption. We also exclude telluric emission because the width of the line of 15 km s-1 is larger than the telluric line width of 4 km s-1. We therefore conclude that the nature of this absorption line is probably interstellar, but we cannot identify the exact origin. For further analysis we replace the affected part of the spectrum between 35 and 65 km s-1 with the -65 to -35 km s-1 data of the same spectrum333 In order to compare how much this changes our final results we show the results obtained with the two seperate wings in Figure 11 as well as the results obtained with the above mentioned changes in Figure 13.. We show this replacement with the grey dotted line, while the original absorption is shown with a grey solid line in Figure 4.
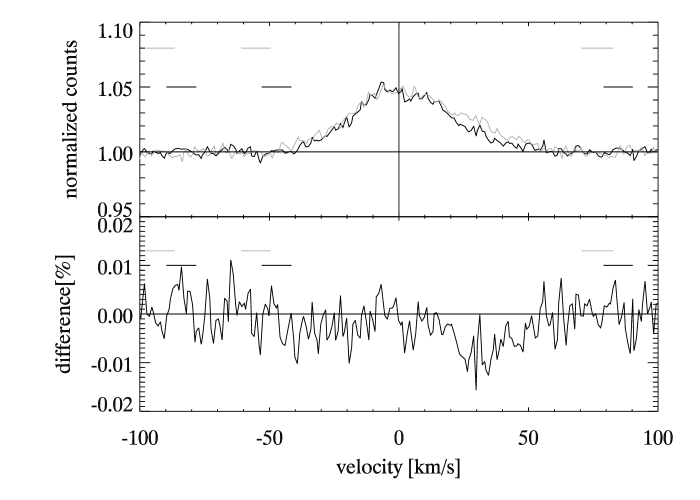
The [OI] emission line seen in HD179218 rises a maximum of 5 % above the continuum, is 50 km s-1 wide and also shows intrinsic temporal change. The red wing of the line changes between both data sets; This is not caused by normalizing effects.
The [OI] emission in HD135344 B has a maximum of approximately 8 % above the continuum and a single peaked profile. Because of the overlapping photospheric absorption lines it is difficult to accurately determine the velocity broadening of the line. We estimate it to be inbetween 60 and 100 km s-1. The [OI] line shows no descernible temporal change and, contrary to HD101412 and HD179218, peaks at 3.9 km s-1 (3 ) away from the expected stellar photospheric zero velocity.
3 Stellar Parameters
The Spectral Energy Distributions (SED) of HAEBE stars can be divided into two groups based on the shape of the mid-IR (20-100 m) emission; groups I and II (Meeus et al. 2001). Group I sources have a rising mid-IR flux excess indicative of a flared disk, while group II sources display a more modest IR excess indicating a geometrically flat disk. This division between groups is made more quantitative by a classification using the vs. IRAS [12] - [60] colour diagram (c.f. Acke et al. (2004)). We show the SED for each of our sources in Figures 7 - 9. By using this classification and comparing the SEDs, HD179218 and HD135344 B are group I sources. In the vs. IRAS [12] - [60] diagram HD101412 is located close to the line separating the two groups. Although it is a group II source, it may be considered a transitional object in between both groups.
A Kurucz (1991) model atmosphere corresponding to the photospheric parameters of the central star is fitted through the data to represent the photospherical contribution. From this, the shape and excess emission from the disk become clear. The shortest wavelength for which the excess is discernible is 0.9 m for HD101412, 1.5 m for HD135344 B and 1.0 m for HD179218 . From here on, the excess emission for HD101412 shows a steady decline that ’flares up’ at 100 m. This behavior is displayed by more IRAS sources at long wavelengths and is probably caused by the inclusion of interstellar material heated up by, but not directly associated with, the central star in the rather large (1 arcmin) IRAS beam. The other two SEDs show a re-brightening at mid-IR wavelengths. The fractional luminosity of the dust compared to the stellar luminosity, , is listed in Table 2.
To determine the projected rotational velocity, the , we have fitted a Doppler profile to mimic the broadening of the lines by stellar rotation to the rotational line profile of several atmospheric absorption lines.
| Name | Spectral Type | log | M | Distance | ||||
|---|---|---|---|---|---|---|---|---|
| log [K] | log [] | [] | [] | [pc] | [km s-1] | [km s-1] | ||
| HD101412 | A0IIIe | 4.02 | 1.40 | 0.27 | 2.3 0.2 | 160444Acke et al. (2005) | 16.9 0.2 | 8 1 |
| HD135344 B | F4Ve | 3.82 | 1.01 | 0.43 | 1.7 0.2 | 140555van Boekel et al. (2005) | 1.6 1.3 | 75 5 |
| HD179218 | B9e | 4.02 | 1.88 | 0.28 | 2.7 0.3 | 240666van den Ancker et al. (1998) | 15.4 2.3 | 72 5 |
| Name | [OI] EW | L([OI]) | [OI] inner radius | [OI] outer radius | Inclination | Group |
|---|---|---|---|---|---|---|
| [Å] | [] | [AU] | [AU] | [∘] | ||
| HD101412 | -0.13 0.01 | 0.15 | 10 | 30 | II | |
| HD135344 B | -0.13 0.06 | 0.1 | 90 | 45777Doucet et al. (2006) | I | |
| HD179218 | -0.053 0.005 | 0.4 | 65 | 40888Dent et al. (2005) | I |


3.1 HD101412
HD101412 has a spectral type between B9.5Ve (Houk & Cowley 1975) and A0 III/IVe (Guimarães et al. 2006) and has a distance of 160 pc. By integrating under the SED shown in Figure 7 (using a reddened Kurucz model to interpolate between observed data points in the optical, a spline in the infrared and a grey body to extrapolate they last data points), and adopting this distance of 160 pc, we derive a bolometric luminosity of 25 for HD101412. The Spitzer-IRS spectrum of HD 101412 has an unusual shape due to the presence of strong PAH emission bands on top of a plateau-like 10 m silicate feature over a weakly rising continuum (Bouwman et al. 2007, in prep.). The same authors also note the presence of emission bands due to the presence of crystalline silicates at 19, 24, 28 and 34 m. This presence of strong PAH emission is, just like the presence of strong [OI] emission, unexpected for a group II source (Acke & van den Ancker 2004). This reinforces our suggestion that the disk of HD101412 is in transition between flaring and being self shadowed.
We estimate the mass of HD101412, derived by comparing the position in the HR diagram to the theoretical pre-main-sequence tracks of Palla & Stahler (1993), to be 2.3 0.2 . Guimarães et al. (2006) find a v of 7 1 km s-1 by modeling high resolution (R = 48000) spectra, suggesting we see HD101412 almost pole-on. This agrees well with the value derived from our data of 8 1 km s-1.
3.2 HD135344 B
HD135344 B is a wide visual binary with a separation of 19.6 arcsec located at a distance of 140 pc. In this paper we will discuss component HD135344 B which has spectral type F4Ve and an estimated mass of 1.7 0.2 . It has a bolometric luminosity of 10 , obtained by fitting the SED shown in Figure 9. Bouwman et al. (2007, in prep.) note only very weak PAH features in the Spitzer-IRS spectrum of HD135344 B. They also note that its SED is quite unusual, with an IR excess starting at 1.5 m, but a deep bump at 13 m. Doucet et al. (2006) have imaged HD135344 B in the mid-infrared (20.5 m) and find a disk with an inclination of 45∘ and a PA of 100 . Based on these spatially resolved observations they estimate the disk to extend up to 200 AU. Brown et al. (2007) classify the disk around HD135344 B as a ’cold disk’, interpreting the lack of mid-IR emission in the SED as missing warm dust. From modeling the SED they derive the disk to have an inner rim starting at 0.18 AU, a gap (i.e. missing warm dust) from 0.45 to 45 AU and outside that a gas rich disk.
A simple model fit to the CO(J=3-2) double peaked line profile done by Dent et al. (2005) indicates an inner radius of the emitting gas AU, an outer radius of 75 5 AU, an estimated circumstellar dust mass of and an inclination of 11. The value of this inclination is notably different from the result of Doucet et al. (2006) and implies that the star rotates at breakup velocity. We will use the result of Doucet et al. (2006) in our model because it is obtained in a more direct way.
3.3 HD179218
HD179218 is a B9e star at a distance of 240 pc and is the Herbig star with the largest known percentage of crystalline dust (van Boekel et al. 2005). It has a bolometric luminosity of 76 , obtained with the SED shown in Figure 8. HD179218 is the star with the greatest richness in terms of number of infrared spectral features in the overview of infrared spectra of Herbig Ae/Be stars by Bouwman et al. (2007, in prep.). Its Spitzer-IRS spectrum is dominated by strong emission features due to the presence of abundant crystalline silicates. Polycyclic Aromatic Hydrocarbons are also detected, in agreement with its classification as a group I source (Acke & van den Ancker 2004). We estimate the mass based on the position in the HR diagram to be 2.7 0.3 . Guimarães et al. (2006) find a v of 72 3 km s-1 agreeing well with the value derived from our data of 72 5 km s-1.
Elia et al. (2004) fit the continuum spectrum of HD179218 with a model including a polar cavity, suggesting a disk-like geometry in the innermost part of the envelope. Moreover, it is noteworthy that their model corresponds to a dust absorption coefficient exponent which is typical of large dust grains and agrees with the results of Acke et al. (2004). This is in agreement with the idea that the grain size is expected to increase with time in circumstellar envelopes, as a result of the ongoing growth processes activated in high-density environments. Liu et al. (2007) have resolved warm dust using 10 micron nulling interferometric observations around the star with a diameter of 27 5 AU. Their observations suggest circular symmetry and thus a small inclination, but inclinations up to 45∘ are still within the error bars. A simple model fit to the CO(J=3-2) line profile done by Dent et al. (2005) indicates an outer radius of 120 20 AU, an inclination of 40 and an estimated circumstellar dust mass of .
4 Data Analysis
4.1 Method
In pioneering work on the mechanism responsible for [OI] emission in young stars, Hartigan et al. (1995) modeled the broad [OI] 6300 Å line emission seen in T Tauri stars as being due to a combination of dense stellar jets and a disk wind or magnetic accretion columns. Acke et al. (2005) have developed a model that explains the narrow [OI] emission lines seen around many HAEBE stars.This simplified model assumes that the entire UV luminosity (2-13.6 eV) of the central star (represented by a Kurucz model for the stellar photosphere) is used to photo dissociate OH in the upper layers of the disk. The disk structure (i.e. densities and temperatures) is computed with a Chiang & Goldreich (1997) type disk, with small olivine dust grains as the opacity source. The OH to H abundance is fixed a priori and constant at each location in the disk. The absorption of UV photons by the dust in the disk is taken into account in the same way as in the models of Störzer & Hollenbach (2000) for photo dissociation regions along the direction of the in falling photons. The line profiles are deduced assuming Keplerian rotation and integration over the spatial coordinates. Details about the method we employ here can be found in Acke et al. (2005) and Acke & van den Ancker (2006).
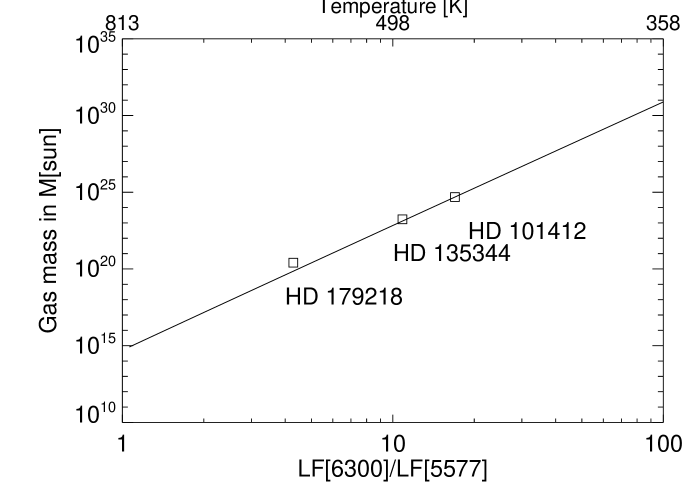
To verify the validity of this assumption for the three systems we study here we compare the Line Flux (LF) of the 5577 Å [OI] emission to that of the 6300 Å [OI] emission. If this emission is caused by thermal emission originating from a disk with a temperature of 500 K, the Boltzmann factor renders the ratio of these two very low (Figure 10).
We follow Acke et al. (2005) and Acke & van den Ancker (2006) in concluding that the observed [OI] emission is caused by illumination of the upper disk layer by UV radiation.
We expect that the pattern and intensity of the [OI] emission is influenced by differences in disk geometry. The part of the disk that lies in the shadow of the puffed up inner rim characteristic for group II sources will emit less compared to the parts that are directly illuminated by the central star. Therefore we predict that there is a drop in intensity at the location of the shadow cast by the inner rim in HD101412. How extended this shadow is depends on when -and if- the disk rises out of the shadow again. We also expect the flaring disks to appear larger in [OI] emission, because they are illuminated by stellar UV flux at greater distance and with more intensity due to their shape than the self shadowing disks.
We note that the radius scale of our results is dependent on the inclination of the disk used in the model. Taking a smaller inclination angle shifts the emission region closer to the star. If we compare the onset of the [OI] emission with the location of the dust sublimation radius, we see that these agree for the inclinations used for HD135344 B and HD179218 . We use this to guess an inclination for HD101412. Values between 24∘ and 41∘ allow the inner rim to be at the dust sublimation radius. In the rest of this paper we will use a value of 30∘. This low inclination is in agreement with both the low v and the double peaked line profile seen in [OI].
4.2 Results
4.2.1 HD101412 and HD179218
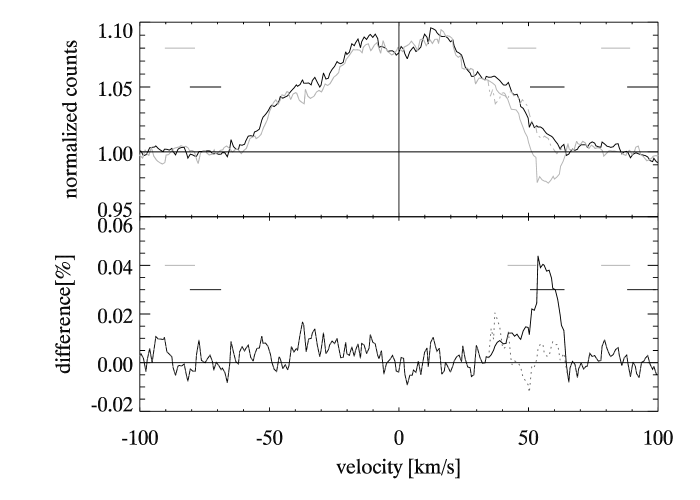
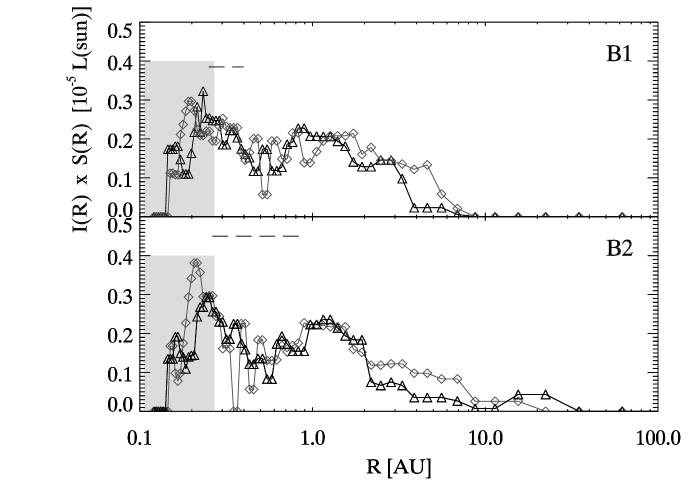
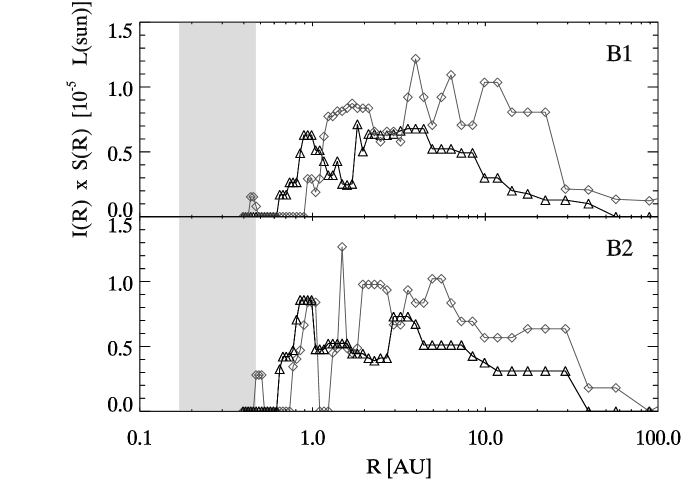
By comparing the blue- and red shifted Doppler profiles, it is possible to distinguish between the parts of the disk that rotate towards us or away and thus track possible inhomogeneities. We have done this for HD101412 and HD179218 and show the results in Figures 11 and 12 plotted together with the dust sublimation radius for temperatures between 1200 and 2000 K in grey. The blue- and red-shifted wings of HD101412 look approximately the same in the upper (B1) and bottom (B2) graph apart from some excess flux at larger distances in the blue shifted part of the disk. HD179218 looks mildly asymmetric, showing for the red shifted part emission that starts at a closer distance to the star and lacking intensity at larger distances compared to the blue shifted part. The blue side also seems to harbor more flux and is detectable up to larger distances. The results discussed below for HD101412 and HD179218 are obtained by averaging the red- and blue shifted profiles of both stars.
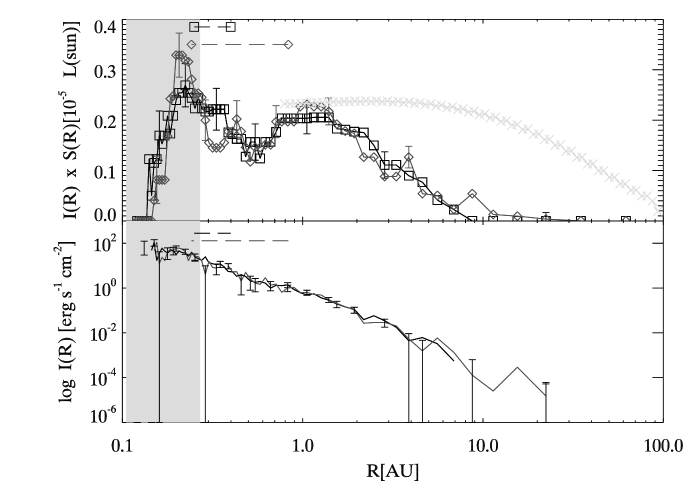
The distribution of emitting atomic oxygen gas as a function of radius for HD101412 is plotted in Figure 13 and for HD179218 in Figure 14. We have plotted the log - log dependency of the received flux as well as a semi log scale plot where we have normalized the intensity with the surface of the ring at distance R : S(R) where = with and the outer and inner radius of the ring at distance R. In this sense is the total luminosity in a ring at distance R and the fluxes of the inner and outer part of the disk can be directly compared this way. The error bars drawn in these graphs are solely a function of the signal to noise of the data. The [OI] emission of HD101412 starts within the expected location of the inner rim at 0.15 AU and extends to 10 AU with a clear drop of almost 50 in the I(R) vs. S(R) curve around 0.5 AU. Since HD101412 is a group II source, characterized by a puffed up inner rim, and because the [OI] emission mechanism is directly proportional to (stellar) UV flux, the drop in intensity can be caused by the shadowing effect of the inner rim. Once the disk emerges out of the shadow (around 1 AU), the disk is again directly illuminated by the central star and keeps receiving enough flux up to 10 AU to be detectable. If we compare the [OI] emission of HD101412 with that expected from a flared disk in Keplerian rotation, shown with light grey crosses in Figure 13, one sees that for a flared disk the emission should have been detected up to much larger radii. We interpret these discrepancies with the flared disk model that both can be explained by a self-shadowed disk; the local drop in intensity at 0.6 AU and the dissapearance of emission at 10 AU, as direct evidence that in the disk surrounding HD101412, the inner rim indeed shadows part of the outer disk - as expected for a group II source.
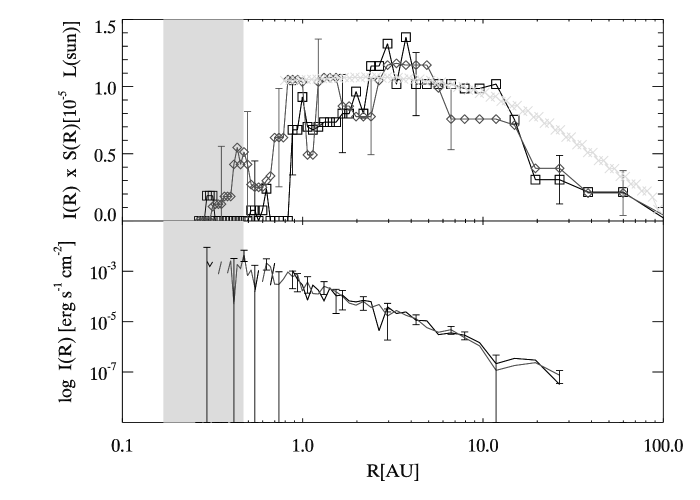
The intensity vs. radius distribution for HD179218, a group I source, looks different. It starts at 0.3 AU from the central star, extends999 This number given here is larger than the in section 2 inferred upper limit for the disk size. This is caused by the fact that the disk emission is concentrated towards the center and drops of exponentially as can be seen e.g. in the log - log part of Figure 13. The the emission originating from 2 AU of the central star already has dropped in intensity by a factor of 100 compared to the maximum. up to 65 AU and has no clearly discernible local drop in intensity as seen in HD101412. This disk has a flaring geometry, meaning that it has - depending on the disk models used - no or negligible shadowing by the inner rim. The flaring also allows the disk to intercept more stellar flux at larger distance, causing the [OI] emission up to a larger distance from the central star. The onset of emission for the B2 data of HD179218 is located beyond the dust sublimation radius. This result is reached by assuming the inclination found by Dent et al. (2005) of 40. When the lower limit of the inclination of is assumed, the onset of emission starts at the dust sublimation radius. Both the shape and the inner plus outer radii of the [OI] emission are in reasonable agreement with those expected from a flared disk model. The discrepancy between the observed and modeled emission at large radii is also seen in the two group I sources investigated by Acke & van den Ancker (2006). This may be due to the model assumption that the OH abundance is homogeneous throughout the disk.
4.2.2 HD135344 B
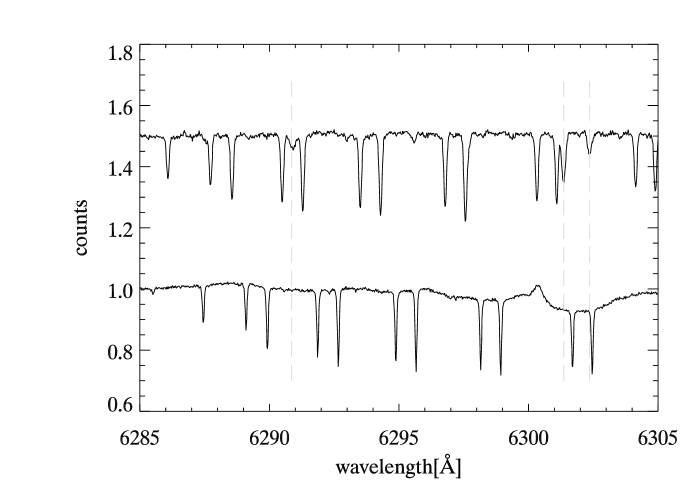
The spectrum of HD135344 B is contaminated by very broad atmospheric absorption lines. Because of this and because of the fact that the [OI] feature is overlapped by two of these lines as shown in Figure 15, we have undertaken one extra step to reduce these data and therefore will discuss this source separately. We correct the absorption by these two lines with two models: (1) A double Voigt model, because a Voigt profile closely mimics the expected profile of a stellar atmospheric line and (2) a polynomial model (a good fit was found using a 6th order Chebyshev-polynomial), both shown in Figure 16. A problem when fitting the Voigt profile was that we were unable to fit the absorption using the location of the lines found in HIP53070, a reference star with the same spectral type as HD135344 B (Figure 15). Using these values results in over(under) fitting the right(left) wing of the absorption. For the further modeling of HD135344 B we use these two models and their average, as shown in Figure 17. This Figure also shows that the blue- and red shifted sides are asymmetric. This can either be caused by an asymmetry in the emitting region, or by an imprecise correction for the photospheric absorption (close inspection of Figure 15 suggests that the blue side of the line lies on a monotonous rising slope, while the red side of the line may overlap with the minimum of the mixed absorption line). Because of this, the blue- and red shifted sides are considered separately in Figures 18 and 19. There is a big difference between the red and blue wing in the first AU, as well as between the different models and data procured at different times. The blue shifted profile shows a steep initial rise followed by a big drop resembling HD101412, whereas the red side rises more slowly, and displays a smaller drop in intensity at a larger radius. There is also a big difference between the two models (and thus also their average) used in the first couple of AU. For the Chebyshev model the emission consistently starts at larger radii than that of the Voigt model. In all cases however, the emission extends up to a larger distance and with more brightness than the other two sources and vanishes around 90 AU. This value is comparable with the outer radius of CO gas of 75 5 AU from Dent et al. (2005).
Considering (1) that it is not possible to properly correct for the photospheric absorption, (2) the fact that HD135344 B has an SED that is uncharacteristically for either a flaring or a self-shadowing disk because of the high (near) infrared excess between 1 and 4 m and (3) the fact the peak of the [OI] emission velocity distribution does not coincide with the stellar photosphere we consider it likely that the observed [OI] emission could also be influenced by other components than solely a disk such as an outflow with thermally exited oxygen. We will therefore limit our interpretation of our [OI] data on this star to a purely phenomenological description of the spectra.

5 Discussion and Conclusions
We have detected non-thermal [OI] emission in all three targets, one of which shows a double peaked emission profile and another one showing a a tentative double peak but certainly flattened emission profile indicating emission from a circumstellar disk. We see in the [OI] emission of one of these sources, HD101412, evidence for the existence of a puffed up inner rim followed by a shadow, supporting the disk model of Dullemond et al. (2001). Although this model can explain most of our observations there is one unexpected feature; the re-brightening (the 2nd bump) of the disk of HD101412 shortly after the shadow cast by the inner rim. We expect the disk to remain in the shadow much longer and possibly never emerging from it, thus preventing the disk to become more bright. We offer a possible explanation for this behavior by speculating that the dust could have a lower scale height than the gas, allowing for a layer of gas above the dust disk. This layer may well (partially) rise above the shadow of the inner rim causing the behavior seen in Figure 13. The [OI] emission of HD179218 is in good agreement with emission from the surface of a flaring circumstellar disk inclined at a 30 degree angle. Finally, we encounter several difficulties in explaining the [OI] emission of HD135344 B by a disk and therefore suggest the possibility of more components responsible for the emission than just the disk.
We will improve on the modeling done in this paper in the next papers, where we will present MIDI observations of these stars showing warm dust enabling us to compare the coupling between gas and dust. We will then also model all our observations together with the SEDs to further test and improve on the method employed in this paper, as well as to constrain as many stellar parameters on our targets as possible.
Acknowledgements.
The authors of this paper wish to thank J. Liske for his assistance with modeling the atmospheric absorption lines. We also want to thank the referee for his helpful suggestions that helped to improve the presentation of the results in this paper.References
- Acke & van den Ancker (2004) Acke, B. & van den Ancker, M. E. 2004, A&A, 426, 151
- Acke & van den Ancker (2006) Acke, B. & van den Ancker, M. E. 2006, A&A, 449, 267
- Acke et al. (2005) Acke, B., van den Ancker, M. E., & Dullemond, C. P. 2005, A&A, 436, 209
- Acke et al. (2004) Acke, B., van den Ancker, M. E., Dullemond, C. P., van Boekel, R., & Waters, L. B. F. M. 2004, A&A, 422, 621
- Bik & Thi (2004) Bik, A. & Thi, W. F. 2004, A&A, 427, L13
- Bitner et al. (2007) Bitner, M. A., Richter, M. J., Lacy, J. H., et al. 2007, ApJ, 661, L69
- Blake & Boogert (2004) Blake, G. A. & Boogert, A. C. A. 2004, ApJ, 606, L73
- Blum et al. (2004) Blum, R. D., Barbosa, C. L., Damineli, A., Conti, P. S., & Ridgway, S. 2004, ApJ, 617, 1167
- Brown et al. (2007) Brown, J. M., Blake, G. A., Dullemond, C. P., et al. 2007, ApJ, 664, L107
- Carmona et al. (2008) Carmona, A., van den Ancker, M. E., Henning, T., et al. 2008, A&A, 477, 839
- Carr et al. (2004) Carr, J. S., Tokunaga, A. T., & Najita, J. 2004, ApJ, 603, 213
- Chiang & Goldreich (1997) Chiang, E. I. & Goldreich, P. 1997, ApJ, 490, 368
- Dekker et al. (2000) Dekker, H., D’Odorico, S., Kaufer, A., Delabre, B., & Kotzlowski, H. 2000, in Presented at the Society of Photo-Optical Instrumentation Engineers (SPIE) Conference, Vol. 4008, Proc. SPIE Vol. 4008, p. 534-545, Optical and IR Telescope Instrumentation and Detectors, Masanori Iye; Alan F. Moorwood; Eds., ed. M. Iye & A. F. Moorwood, 534–545
- Dent et al. (2005) Dent, W. R. F., Greaves, J. S., & Coulson, I. M. 2005, MNRAS, 359, 663
- Doucet et al. (2006) Doucet, C., Pantin, E., Lagage, P. O., & Dullemond, C. P. 2006, A&A, 460, 117
- Dullemond et al. (2001) Dullemond, C. P., Dominik, C., & Natta, A. 2001, ApJ, 560, 957
- Elia et al. (2004) Elia, D., Strafella, F., Campeggio, L., et al. 2004, ApJ, 601, 1000
- Guimarães et al. (2006) Guimarães, M. M., Alencar, S. H. P., Corradi, W. J. B., & Vieira, S. L. A. 2006, A&A, 457, 581
- Hartigan et al. (1995) Hartigan, P., Edwards, S., & Ghandour, L. 1995, ApJ, 452, 736
- Hillenbrand et al. (1992) Hillenbrand, L. A., Strom, S. E., Vrba, F. J., & Keene, J. 1992, ApJ, 397, 613
- Hirth et al. (1994) Hirth, G. A., Mundt, R., & Solf, J. 1994, A&A, 285, 929
- Hirth et al. (1997) Hirth, G. A., Mundt, R., & Solf, J. 1997, A&AS, 126, 437
- Houk & Cowley (1975) Houk, N. & Cowley, A. P. 1975, Michigan Catalogue of two-dimensional spectral types for the HD star (Ann Arbor: University of Michigan, Departement of Astronomy, 1975)
- Kurucz (1991) Kurucz, R. L. 1991, in Precision Photometry: Astrophysics of the Galaxy, ed. A. G. D. Philip, A. R. Upgren, & K. A. Janes, 27–+
- Liu et al. (2007) Liu, W. M., Hinz, P. M., Meyer, M. R., et al. 2007, ApJ, 658, 1164
- Mannings & Sargent (1997) Mannings, V. & Sargent, A. I. 1997, ApJ, 490, 792
- Martin-Zaïdi et al. (2007) Martin-Zaïdi, C., Lagage, P.-O., Pantin, E., & Habart, E. 2007, ApJ, 666, L117
- Meeus et al. (2001) Meeus, G., Waters, L. B. F. M., Bouwman, J., et al. 2001, A&A, 365, 476
- Najita et al. (2003) Najita, J., Carr, J. S., & Mathieu, R. D. 2003, ApJ, 589, 931
- Natta et al. (2001) Natta, A., Prusti, T., Neri, R., et al. 2001, A&A, 371, 186
- Palla & Stahler (1993) Palla, F. & Stahler, S. W. 1993, ApJ, 418, 414
- Störzer & Hollenbach (2000) Störzer, H. & Hollenbach, D. 2000, ApJ, 539, 751
- van Boekel et al. (2005) van Boekel, R., Min, M., Waters, L. B. F. M., et al. 2005, A&A, 437, 189
- van den Ancker et al. (1998) van den Ancker, M. E., de Winter, D., & Tjin A Djie, H. R. E. 1998, A&A, 330, 145