SIGNATURES OF STRONG ELECTROWEAK SYMMETRY
BREAKING IN
ppbbtt+X AT LHC.
M. Gintner, gintner@fyzika.uniza.sk, I. Melo, melo@fyzika.uniza.sk, and B. Trpišová, trpisova@fyzika.uniza.sk
Katedra fyziky, Žilinská univerzita, Univerzitná 1, 01026 Žilina,
Slovak Republic
ABSTRACT.We study the possible production of the
-resonance from the Strong Electroweak
Symmetry Breaking sector at LHC. Due to enhanced coupling of
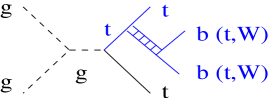
to the top and bottom quarks we focus on the process
where either or
are the products of the decay.
1 INTRODUCTION
Strong Electroweak Symmetry Breaking (Strong ESB or SESB) is an alternative mechanism of ESB, different from the Standard Model (SM) and Supersymmetry in that it generates masses of elementary particles via new strongly interacting physics. SESB is motivated by the chiral symmetry breaking in QCD. Just as unitarizes scattering in QCD, so does a new strong vector (spin = isospin =1) resonance in the form of an isospin triplet , with mass around 1 TeV scale, unitarize WW scattering. The role of pions (Goldstone bosons) of the new strong interactions is played by the longitudinal W bosons to which the resonance is coupled strongly. is thus a generic prediction of the SESB models [2]. An effective Lagrangian description of the interactions with SM particles was developed and has become known as the BESS model [3]. This model is minimal in the sense that is the only new particle in the spectrum of SM where it replaces the Higgs boson.
We introduced modifications to the BESS model [4],[5] which allow to couple significantly not only to the W bosons but also to the top and bottom quarks. The study of the size of these couplings could indicate whether the mechanism of the W and Z mass generation is the same as the mechanism of the top mass generation or not. This motivates our study of the process(es) ppt+X bt+X and ppb+X bt+X in this contribution. (Previous studies found that ppjjW+W-+X is a good probe of , ppjjt+X is overwhelmed by the ppt+X background and pptW+W-+X has a small cross-section).
2 LAGRANGIAN
The model is described by the effective chiral Lagrangian based on the gauged non-linear sigma model respecting the symmetries of the Higgs sector of SM: SU(2)U(1)Y local and SU(2)SU(2)R global [4],[5]. We will focus here on the interactions of the neutral with the top and bottom quarks which are relevant for ppt b (for completeness we also show interaction with longitudinal W bosons denoted as below):
| (1) | |||||
where are coupling constants, denotes the electroweak scale 246 GeV and is the mass.
On the basis of the BESS model studies we have for our model the low energy limit . We do not have a strict low energy limit on and . The unitarity limit requires that .
3 RESULTS
For the pptb we took into account only the dominant gluon-gluon channel with 155 Feynman diagrams. Unfortunately we haven’t been able to do the calculation for such a large number of diagrams. Instead we singled-out 8 diagrams for ppt+X bt+X ( b signal), 8 diagrams for ppb+X bt+X ( t signal) and treated the remaining diagrams as the continuum background on the top of which we hope to see the signal. The number of background diagrams was further reduced by choosing the gauge invariant set of 35 diagrams containing only quarks and gluons which dominate the rest. We call this set the “QCD background”.
The first step was to compute cross-sections and generate events using CompHEP [6]. The events were then passed to Pythia [7] for decays and hadronization and after that to Atlfast which simulates the ATLAS detector effects. Everything was run within the Athena framework. The output from Atlfast was a ROOT file on which we did the final reconstruction.
In Tab.1 we show cross-sections for several values of the coupling constants for both signal processes. As can be noticed, they range from tenths of fb up to a few hundred fb. Note the higher values for the t signal as compared to b by a factor of about 30. In Tab.1 we also give the cross-section for the QCD background. As this number indicates, the QCD background is high but it dominates at small values of invariant masses mtt, mbb.
| [GeV] | [fb] | |||
|---|---|---|---|---|
| 0.02 | 20 | 4.1 | 0.2 | |
| 0.08 | 20 | 42.4 | 4.3 | |
| 0.08 | 40 | 166.4 | 17.8 | |
| 0.02 | 20 | 4.1 | 6.7 | |
| 0.08 | 20 | 42.4 | 136.2 | |
| 0.08 | 40 | 166.4 | 610.1 | |
| QCD | 16388.8 |
We chose for the reconstruction the channel with one charged lepton, b bbjjb (j denotes light jet, b stands for b-jet) which has the highest branching ratio among all channels (43.5%).
The cuts imposed during the reconstruction were as follows: pT of electron 30 GeV, pT of muon 20 GeV, pT of jets 25 GeV. We assumed the b-tagging efficiency of 50%. One of the W bosons was reconstructed from the reconstructed lepton and neutrino, the remaining W was reconstructed from the light jets. In the case of the leptonic decay the W mass (mW) constraint was used to determine the longitudinal component of the neutrino.The jet-jet invariant mass mjj was required to fall within the m GeV window. For the reconstruction of each event we took such combination of two light jets and four b-jets (one can make 12 combinations to pair two W’s and four b-quarks) which minimizes the expression
| (2) | |||||
where mWb is the W-b invariant mass and mt is the mass of the top quark. The indeces combine in such a way that for all combinations and the order of the numbers in a combination matters.
In Fig.2 are shown reconstructed distributions of the invariant mass of the b pair obtained for the b process (Fig.2a) and for the QCD background (Fig.2b). The resonance depicted in Fig.2a has mass =1000 GeV and width GeV. For both signal and background we assumed integrated luminosity 100 fb-1. is the total number of events that passed through the cuts. Note the clear peak at 1000 GeV exhibited by the resonance.
4 CONCLUSIONS
To compare signal and backround, we choose a window 150 GeV around = 1 TeV. In this window we find 0.8 signal events (corresponding to the resonance in Fig.2a) and 8 background events (corresponding to the distribution in Fig.2b). The signal at this point seems weak and calls for the highest possible luminosity at LHC. However, further analysis is required which may lead to the improvement of the signal to background ratio. The work on the reconstruction of the t signal which has a higher cross-section is in progress.
Fig. 2. Reconstructed distributions of the invariant mass of the b pair obtained for the b process with =1000 GeV and GeV (a), and for the QCD background (b).
ACKNOWLEDGEMENT: We wish to thank Jonathan Ferland, University of Montreal, for his help with the reconstruction procedure.
REFERENCES
- [1]
- [2] For a review see K. Lane, “Technicolor 2000”, lectures given at LNF Spring School in Nuclear, Subnuclear and Astroparticle Physics, Rome, Italy, May 15-20, 2000. hep-ph/0007304
- [3] R. Casalbuoni et al., Phys. Lett. B155, 95 (1985). D. Dominici, Riv. Nuovo Cim. 20, 1 (1997). R. Casalbuoni et al., Phys. Lett. B258, 161 (1991).
- [4] M. Gintner, I. Melo, Acta Phys. Slov. 51, 139 (2001)
- [5] M. Gintner, I. Melo, B. Trpišová, Acta Phys. Slov. 56, 473 (2006)
- [6] E. Boos et al. [CompHEP Collaboration], Nucl. Instrum. Meth. A534, 250 (2004)[hep-ph/0403113]. A.Pukhov et al.: [hep-ph/9908288].
- [7] T. Sjostrand et al., Computer Physics Commun. 135, 238 (2001)