The Expansion and Radio Spectral Index of G21.5–0.9: Is PSR J18331034 the Youngest Pulsar?
Abstract
We report on new 5-GHz VLA radio observations of the pulsar-powered supernova remnant G21.50.9. These observations have allowed us to make a high-quality radio image of this remnant with a resolution of 0.7″. It has a filamentary structure similar to that seen in the Crab Nebula. Radio structure suggestive of the torus seen around the Crab pulsar is tentatively identified. We also compared the new image with one taken 15 yr earlier at 1.5 GHz, both to find the expansion speed of the remnant and to make a spectral index image. Between 1991 and 2006, we find that the average expansion rate of the remnant is % yr-1, corresponding, for a distance of 5 kpc, to a speed of km s-1 wrt. the centre of the nebula. Assuming undecelerated expansion, this expansion speed implies that the age of G21.50.9 is yr, which makes PSR J18331034 one of the youngest, if not the youngest, known pulsars in the Galaxy.
keywords:
ISM: supernova remnants1 Introduction
The supernova remnant G21.50.9 (SNR 021.500.9) has been known for over 30 years (e.g., Altenhoff et al., 1970), and has long been classified as a filled-centre or a Crab-like remnant (e.g., Wilson & Weiler, 1976). Such supernova remnants are powered by a central pulsar rather than by the interaction of the expanding ejecta shell with its surroundings. We will refer to them using the term “pulsar wind nebula” or PWN. G21.50.9 is a bright, centrally condensed radio and X-ray source, with a diameter of 1′. A larger, low surface brightness halo, of diameter 2.5′, is seen in the X-ray (Bocchino et al., 2005; Matheson & Safi-Harb, 2005; Safi-Harb et al., 2001; Slane et al., 2000). The distance to G21.50.9 is 5 kpc (Camilo et al., 2006; Davelaar et al., 1986). Its radio and X-ray luminosities are 10% and 1% of those, respectively, of the Crab Nebula.
However, despite numerous searches, no pulsar was seen in G21.50.9 until very recently, when two teams announced the discovery of PSR J18331034 (Gupta et al., 2005; Camilo et al., 2006). The pulsar is very faint, with a pulse-averaged flux density of Jy at 1.4 GHz. It has a period of 61.8 ms and a period derivative of , giving it a characteristic age of 4800 yr. Although no other relatively direct measurements of G21.50.9’s age have been made, various arguments have led other authors to suggest an age of 1000 yr (Bock et al., 2001; Bocchino et al., 2005; Camilo et al., 2006). Despite its faint pulsed emission, the pulsar is in fact very energetic, having a spindown luminosity of erg s-1, which, in our Galaxy, is second only to that of the Crab pulsar.
The powerful winds of young pulsars with high spindown luminosities have been shown to excite complex structures, visible from the X-ray to the radio (e.g., Gaensler & Slane, 2006). In particular, in the Crab Nebula, narrow emission features, called “wisps” are seen. The wisps are thought to be associated with the shock in the pulsar wind, and with a torus seen in the X-ray. They move rapidly outward and are seen in the radio, optical and X-ray (e.g., Bietenholz et al., 2001a, 2004, and references therein). 3C 58, which is also the wind nebula of a young, energetic pulsar, exhibits a narrow radio feature which is probably associated with the pulsar outflow, although it is not as mobile as the Crab wisps (Frail & Moffett, 1993; Bietenholz, 2006).
While numerous radio images of G21.50.9, at frequencies from 330 MHz to 94 GHz, have been published (Becker & Kundu, 1976; Wilson & Weiler, 1976; Becker & Szymkowiak, 1981; Morsi & Reich, 1987; Fürst et al., 1988; Kassim, 1992; Bock et al., 2001), none of them had a resolution higher than 4″, which is not sufficient to see such wisps and other radio features in detail. Frail & Moffett (1993) observed G21.50.9 with the VLA specifically to search for radio emission associated with the (then still unknown) pulsar, but found none. Now the pulsar location is known, it seemed well worthwhile to revisit G21.50.9 with deeper and higher-resolution radio observations. We therefore observed G21.50.9 using the NRAO111The National Radio Astronomy Observatory, NRAO, is a facility of the National Science Foundation operated under cooperative agreement by Associated Universities, Inc. Very Large Array (VLA) with the goals of making a sub-arcsecond resolution radio image, searching for features near the pulsar, and, by comparing our observations to older ones, determining the expansion rate, age, and spectral index distribution of the synchrotron nebula. We describe the observations in § 2, present the new image in § 3, determine the expansion rate and form a spectral index image in § 4, and discuss our findings in § 5.
2 Observations and Data Reduction
We observed G21.50.9 at 5 GHz, using the A and B array configurations of the VLA. All our observations were phase-referenced to the radio source PMN J18321035. The details of the observations are given in Table 1, which also describes the two archival data sets that we use in this paper. The flux density calibration for all observing sessions was done by observing 3C 286. The data reduction was carried out using standard procedures from NRAO’s AIPS software package, which were also used to re-reduce the archival data.
| Date | Frequency (GHz) | Array Configuration | Observing Timeb (hrs) |
| 2006 Mar 7 | 4.93, 4.56 | A | 6 |
| 2006 Sep 9 | 4.93, 4.56 | B | 2 |
| 1991 Jul 3cd | 1.46, 1.51 | B | 6 |
| 1985 Nov 30c | 4.89, 4.84 | D | 1.5 |
a The sky frequencies of the two intermediate
frequencies (IF) used. In each case the bandwidth per IF was 50 MHz.
b The approximate total observing time, including
calibrator observations; note that for 1985 Nov 30, only 10 min
were spent on-source for G21.50.9.
c Data from the NRAO data archive
d Original results published in Frail & Moffett (1993).
To make the best possible image, we used maximum entropy deconvolution, which is better suited to extended objects like G21.50.9 than the more common CLEAN deconvolution. However, since the diameter of the PWN is 1′, even the shortest spacings with the B-array recover only around half the total flux density. Therefore the large-scale structure may not be well recovered without some additional short-spacing information. We used an archival 5 GHz VLA data set taken in the D configuration on 30 Nov 1985 to supply additional short spacing information.
3 High Resolution Image
In Figure 1 we show the full radio-image of G21.5, obtained by combining the A, B, and D array observations at 5 GHz222In anticipation of our result on the expansion, described in § 4.1 below, the D-configuration data, taken 21 years before the A and B-configuration data, was scaled up by 2.3%, based on our measurement of the expansion speed. The effect on the image of this small correction to the D-configuration data is minimal., and using a AIPS’ implementation of the Briggs robustness parameter (Briggs et al., 1999) of 1.5, which achieves a resolution somewhat better than available through natural weighting with only slightly increased noise. The full-width at half-maximum (FWHM) of the elliptical Gaussian restoring beam was at p.a. 10°. The total flux density recovered was Jy, consistent with the earlier total flux density measurements at cm wavelengths (Wilson & Weiler, 1976; Salter et al., 1989). The off-source rms background brightness was 19 . This image has notably higher resolution and lower rms background than any previously published radio images of G21.50.9. Prominent filamentary structure, reminiscent of that seen in radio images of the Crab nebula (Bietenholz et al., 2001a, 2004) and 3C 58 (Bietenholz, 2006; Bietenholz et al., 2001b), is clearly visible.
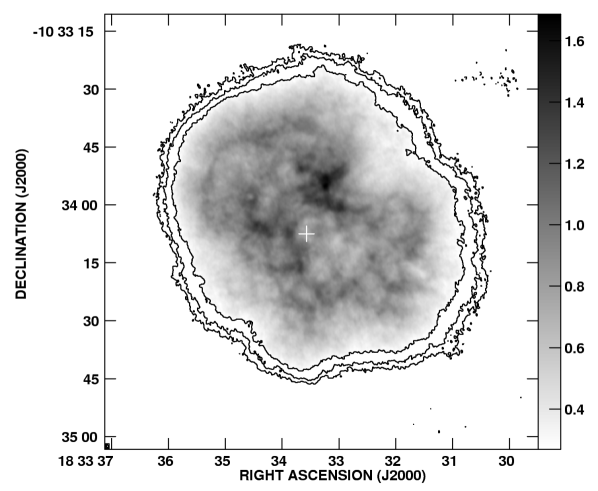
The remnant has a double-lobed structure, with the axis of symmetry running approximately from the northwest to the southeast. This structure has also been noted in the X-ray (e.g., Matheson & Safi-Harb, 2005; Safi-Harb et al., 2001). Unlike in the X-ray, however, there is no bright central condensation in the radio, and the northwest lobe is somewhat brighter than the southeast one.
The position of the pulsar is known to within from Chandra X-ray images (Camilo et al., 2006)333We note that the position of the pulsar itself has not been accurately measured, but that the position of the bright, although un-pulsed, central condensation in X-rays is identified as the pulsar position by Camilo et al. (2006).. Although the pulsar is too faint to discern in our radio images, we can accurately locate it, since our observations were phase-referenced to the radio calibrator PMN J18321035. We estimate the uncertainty of our astrometric calibration is also about 0.5″. The pulsar position is indicated in Fig. 1. The pulsar is displaced by 4″ southeast of the centroid of the remnant. Loop-like filaments are seen, with the most prominent being to the northwest.
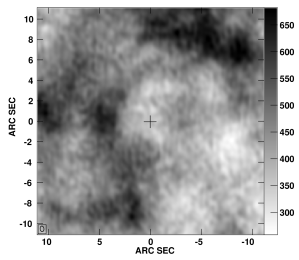
We show a detail of the region near the pulsar, made with a slightly higher resolution (AIPS robustness parameter ) of at p.a. 7° in Fig. 2. The brightest region is 10″ north-northwest of the pulsar. The pulsar itself is in a region of somewhat lower surface brightness of diameter 8″, which is open to the southeast. There is possibly an elliptical structure, incomplete to the southeast, oriented at p.a. 45° and of major axis diameter 8″ (corresponding to cm at 5 kpc), although a conclusive identification is not possible at this combination of signal-to-noise and resolution. If the structure is real, then its minor axis is oriented along the axis of symmetry of the nebula (i.e., northwest to southeast).
4 Expansion Speed and Spectral Index
We set out to both determine G21.50.9’s rate of expansion and to map its radio spectral index by comparing our 5 GHz image from 2006 to a 1.5 GHz one made from data taken in 1991 in the A array configuration (see Frail & Moffett, 1993, for the original results from the 1991 data). Although an archival image at our observing frequency would have been preferable for determining the expansion, no older 5-GHz image of sufficient sensitivity and resolution was available. Since the two images differ in both epoch and frequency, the expansion and spectral index cannot be determined independently of each other. However, for a source such with well-resolved, small-scale structure such as G21.50.9, and for a range in frequency of only three, it is highly unlikely that variation in the spectral index would cause the source to appear larger or smaller at different frequencies. Furthermore, earlier results on G21.50.9 (Morsi & Reich, 1987; Fürst et al., 1988) suggest that G21.50.9’s radio spectral index is relatively uniform across the nebula. Large variations in spectral index are not in fact expected in PWNe, if the remarkably uniformity of spectral index over each of the two most prominent remnants, the Crab Nebula and 3C 58, is any guide (Bietenholz et al., 1997, 2001b). Therefore, since the expected variations in spectral index are small, and very unlikely to mimic a frequency-dependent change size, we proceed to compare the 2001 1.5-GHz and 2006 5-GHz images to determine the expansion rate. Once the expansion rate is known, we can “expand” the 1991 1.5-GHz image in order to make a spectral-index image.
4.1 Expansion
We used the same approach to determining the expansion as was used in Bietenholz (2006) and Bietenholz et al. (2001b, 1991), and repeat a brief description here for the convenience of the reader. The goal is to determine the overall or average expansion rate of the radio nebula. Since there are few well-defined compact features, the expansion is measured not by determining the proper motion of individual features, but by determining an overall scaling between a pair of images by least-squares. This was accomplished by using the MIRIAD (Sault et al., 1995) task IMDIFF444As a check we also re-implemented the IMDIFF algorithm as an AIPS script. The results from this re-implementation, which uses different image-interpolation and minimisation and schemes, were consistent to within our uncertainties. which determines how to make one image most closely resemble another, by calculating unbiased estimators for the scaling in size, , the scaling and the offset in flux density, and respectively, and the offsets in RA and decl., and respectively, by least squares. Our chief interest is in the expansion factor, , but because of uncertainties in flux calibration, absolute position, and image zero-point offsets caused by missing short spacings, all five parameters needed to be determined. This method was originally developed by Tan & Gull (1985).
In order not to contaminate our results on the expansion, we used an image made from the 2006 data set without the added D-configuration data from 1985. Although the structure at relatively small spatial scales, namely the filamentary structure visible in Fig. 1, was well sampled by our A and B-configuration VLA observations, the largest scale structure was less well sampled, and may thus not have been sufficiently well recovered by the deconvolution. We will therefore obtain more reliable results on the expansion if we use high-pass filtered images, which exclude the poorly sampled structure on the largest scales. To make the images for determining the expansion, we performed an initial high-pass filtering by using only visibility data at - distances K. Then, we used CLEAN deconvolution, since the positivity constraint applied in MEM deconvolution is not applicable to such high-pass filtered images. Finally, the resulting CLEAN images were further high-pass filtered in the image plane by applying a Gaussian high-pass filter of FWHM 15″, and then the region exterior to G21.50.9 was blanked555We use a slightly modified version of IMDIFF which treats blanked regions correctly. The 1991 1.5-GHz data were re-reduced in a manner consistent with the 2006 data, and a similarly high-pass filtered image was made. The FWHM resolution of this data set was at °, the peak brightness was 6.2 mJy bm-1, and the rms background was 0.12 mJy bm-1. Before running IMDIFF, the 2006 image was convolved to the resolution of the 1991 one. The fitting region encompassed 2.8 square arcminutes or 5000 beam areas.
The fitted value of the expansion parameter, , between epoch 1991.5 and 2006.3 was 1.017, in other words, the nebula has expanded by 1.7% over the 14.8 yr period between the observations. The rms residual to the expansion fit was 0.11 mJy bm-1, which is comparable to the combined background rms in the two images.
The uncertainty of the expansion parameter is difficult to estimate reliably. The purely statistical uncertainty will be small due to the large number of image elements ( beam areas). However, the image elements are not strictly independent, so the expansion uncertainty is likely dominated by systematics such as deconvolution errors. We estimate our uncertainty from the largest differences in the value of the expansion parameter, , observed between IMDIFF and the AIPS minimisation and between different levels of high-pass filtering. Our uncertainty is therefore not a statistical value, but rather an estimated confidence interval.
Since the two images are taken at different frequencies, caution is warranted when comparing them. However, as mentioned, we think it highly unlikely that any possible spectral index variations might cause a spurious apparent change in size with frequency for such a complex source structure. We therefore believe our measured expansion factor accurately reflects true spatial expansion of the nebula. Expansion by a factor of % over a 14.8 yr period suggests an expansion rate of % yr-1, and in the absence of any acceleration or deceleration, an age of yr. We note here that a small amount of acceleration, and therefore a slightly older age is expected. We discuss this subject further in § 5 below.
4.2 Spectral Index Image
Having established the expansion rate, we can correct the 1.5 GHz image for the expansion between 1991 and 2006, and then form a spectral index image with the two images, i.e., between 1.5 and 4.9 GHz. For the spectral index image, we used different images than for the expansion which are filtered neither in the visibility or the image-plane. The 5-GHz image was made incorporating the small amount of D-configuration data from 1985, after scaling of the latter, as described in § 2 above in order to recover the large-scale structure as accurately as possible. We show our spectral index image in Fig. 3. The average spectral index over our image (with spectral index, , defined so that ) was666The uncertainty is the estimated systematic uncertainty due to flux calibration and a possibly slightly incomplete recovery of the total flux density in the 1.5 GHz image . The rms of over the image was 0.14. The average value of is consistent with the earlier integrated values of (Morsi & Reich, 1987) and (Salter et al., 1989).
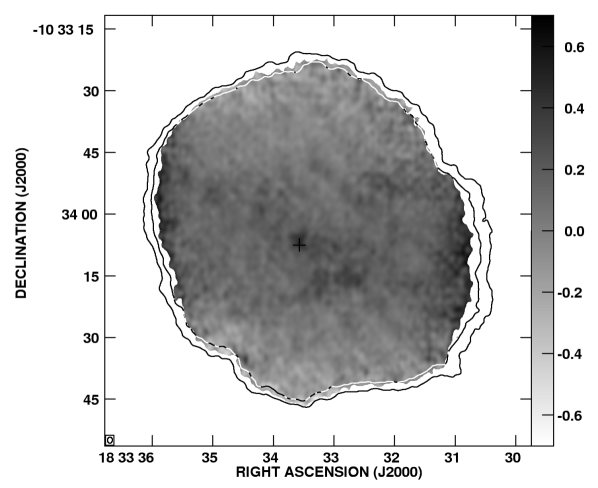
The spectral index is relatively uniform over the nebula. Although a fairly large range of spectral index is visible in the image, a large uncertainty in the spectral index is unavoidable in regions of relatively low signal-to-noise. The formal uncertainty in the spectral index is, on average, 0.1 over the central 40″ of the nebula, and as there are many image elements, a number of deviations exceeding , i.e., 0.2 in , are to be expected merely because of the noise. The regions showing larger deviations from the mean spectral index are near the edge of the nebula where the uncertainty is higher. In addition, a wide band of slightly steeper spectral index () running almost east-west is seen across the center of the nebula. This “feature” is almost certainly an artefact due to slight deconvolution errors due to incomplete sampling near the center of the - plane.
No systematic deviations from the mean spectral index are visible near the edge of the nebula, with a the mean spectral index of a strip of width 10″ around the circumference of the nebula differing only insignificantly (by ) from the overall mean. No strong deviations are seen near the filamentary structures. The region near the pulsar has an larger (i.e., the spectrum is more inverted) than that of its surroundings by and the brightest region has a slightly smaller (i.e., the spectrum is slightly steeper). Although both of these deviations may be real, they are not larger than the uncertainties due to the noise and deconvolution errors.
5 Discussion
We have made new, high-resolution 5-GHz radio images of the pulsar wind nebula, G21.50.9, whose pulsar was only recently detected and found to have a very high spindown luminosity. By comparing our image to an earlier image at 1.5 GHz we determined both the expansion rate and the radio spectral index of the nebula .
Our image clearly shows that G21.50.9 has a filamentary structure in the radio, similar to that seen in radio images of the Crab and of 3C 58. Large loop-like structures are seen especially towards the northeast and southwest. Such structure seems to be present in all young PWNe. Slane et al. (2004) suggested that they were loops torn by the kink instability from the toroidal field produced by the pulsar.
The nebula is expanding fairly rapidly: our estimate of the expansion rate between 1991 and 2006 is % yr-1. At 5 kpc this rate corresponds to a speed (wrt. the centre) of km s-1. This is similar to although a little slower than the expansion speeds seen for two other young PWNe: the Crab Nebula and 3C 58.
If we assume constant velocity expansion, then the age of G21.50.9 is yr. This is considerably younger than the characteristic age of the pulsar, which is 4800 yr. In fact, the nominal age of 870 yr is 100 yr younger then the Crab pulsar and would make PSR J18331034 the youngest known Galactic pulsar with the possible exception of PSR J18460258 in the remnant Kes 75777No expansion-speed measurement is available for Kes 75. The spindown age of PSR J18460258 is 723 yr (e.g., Livingstone et al., 2006). Arguments have been advanced that Kes 75, and thus its pulsar, are considerably older. These arguments, however, were based in part on a large distance to Kes 75. Very recently, Leahy & Tian (2007), have shown that a considerably smaller distance is likely for PSR J18460258, and thus an age nearer the spindown age is quite possible. The other possible exception is PSR J0205+6449 in 3C 58, which has often been associated with the supernova of 1181 A.D., which would give it an age of 825 yr. A number of arguments, however, suggest that 3C 58 and PSR J0205+6449 are considerably older (see for example the discussions in Bietenholz 2006 or Chevalier, 2005). We note, however, that the expansion of a young PWN is expected to accelerate slightly as it expands into the freely expanding ejecta for the first 1000 yr of its life (van der Swaluw et al., 2001; Blondin et al., 2001; Jun, 1998). Such acceleration is in fact observed in the case of the Crab Nebula (Trimble, 1968; Nugent, 1998; Bietenholz et al., 1991). If G21.50.9 is similarly accelerated, then its age would be somewhat older than 870 yr. In fact, it would have very nearly the same age as the Crab nebula, since both the constant-velocity expansion age of both the Crab’s synchrotron nebula (Bietenholz et al., 1991) is almost the same as that we have determined for G21.50.9. The only other pulsar known to be younger than this is that in , whose age is also determined by measuring the expansion speed of the nebula, albeit from the optical spectrum rather than from radio imaging (Kirshner et al., 1989). With the exception of the pulsar spindown age, which often differs from the true age of the pulsar by factors of a few, this is the first age measurement for G21.50.9.
The supernova responsible for creating PSR J18331034 and G21.50.9 would then have exploded around the year 1140 AD. It might be considered surprising that no historical supernova was recorded at that time near G21.50.9, although we note that Wang et al. (1986) suggested that G21.50.9 might be the remnant of the “guest star” (supernova) of 48 BC, making it 2100 yr old, which is compatible with our measurement only if strong acceleration has occurred since the supernova explosion. However, as pointed out by Camilo et al. (2006), the hydrogen column density implied by various X-ray measurements ( cm-2, Warwick et al., 2001; Safi-Harb et al., 2001) in the direction of G21.50.9 corresponds to sufficient visual extinction (10–11 mag) for it to be unlikely that the supernova event was noticed.
We also produced a radio spectral index image, which shows that G21.50.9’s spectrum is fairly uniform, with an average spectral index between 1.5 and 5 GHz of . G21.50.9 is similar in this regard to two other young PWNe, the Crab and 3C 58, whose radio spectra have been found to be remarkably uniform over the nebulae. The spectral uniformity suggests there is a single source for the relativistic electrons responsible for the radio emission, namely the pulsar.
One might also expect some radio emission from electrons accelerated in the shocks produced by the interaction of the expanding supernova ejecta with their surroundings, and those bounding the pulsar nebula as it expands into the ejecta. Such shocks are expected to give rise to radio spectra steeper than those observed in PWNe (typically with ). No such regions are seen in G21.50.9. In particular, on our image, a region of width 10″ around the edge of the nebula has a mean spectral index which differed by from the mean over the entire nebula.
As mentioned earlier, a faint “halo” of 2.5′ in diameter is seen surrounding the PWN in the X-ray, with about 1% of the latter’s surface brightness (Bocchino et al., 2005; Matheson & Safi-Harb, 2005; Safi-Harb et al., 2001; Slane et al., 2000). This halo might be X-ray emission associated with the outer shock, although its nature is not yet clear. Both Matheson & Safi-Harb (2005) and Bocchino et al. (2005) argue that most of the halo X-ray emission is not from the outer shock, but is due to dust scattering.
Is there any radio emission associated with this halo? Previous radio observations have not shown the presence of a corresponding radio halo to a surface brightness limit of 4 W m-2 Hz-1 sr-1 (30 mJy arcmin-2) at 1 GHz (Bock et al., 2001; Slane et al., 2000). We produced a wide-field radio image from our new radio data to search for such extended emission, but found no features above the noise outside the region shown in Fig. 1. We note, however, that our image background rms of only about 1% of the brightness of the PWN is probably not low enough to detect a halo comparable to the X-ray one, and is in fact somewhat higher than existing limits on the halo radio emission. Deeper, low-frequency radio observations of G21.50.9 should be undertaken to determine, or set lower limits to, the radio brightness of the halo.
It has already been pointed out, by Woltjer et al. (1997) and Salvati et al. (1998), that interpreting the relatively low break frequency (100 GHz) measured in the broadband spectrum of G21.50.9 (see Bock et al., 2001; Gallant & Tuffs, 1998; Salter et al., 1989) as being caused by synchrotron ageing implies either an unrealistically high magnetic field or an unrealistically large age. For example, if we take the minimum energy field calculated from synchrotron theory of 440 G (Slane et al., 2000), and take the break frequency to be 100 GHz, one would arrive at an age of 13,000 yr (Bock et al., 2001). Our measurement of the expansion speed now provides firm observational evidence against such large ages. A much larger magnetic field, on the other hand, is not feasible on energetic grounds. Possibly the break in the spectrum is not due to synchrotron ageing. Fleishman & Bietenholz (2007) showed that, in the case of a tangled magnetic field, several breaks occur in the synchrotron spectrum even for a single power-law distribution of relativistic electrons, and these breaks can naturally explain the broadband spectra of PWNe, both ones like the Crab with break frequencies in the infrared, and ones like G21.50.9 or 3C 58, which have much lower break frequencies. Such a model might be applicable to G21.50.9 as well.
Can we identify any radio features associated with the termination shock in the pulsar wind? The termination shock’s radius can be estimated by balancing the ram pressure of the pulsar wind against the nebular pressure, and one finds that the radius of the termination shock is 16 where is the fractional solid angle covered by the wind (Camilo et al., 2006, see also Slane et al. 2000, who obtained a termination shock angular radius of 15 for input parameters somewhat different than ours.) .
The pulsar in G21.50.9 is surrounded by a region of somewhat lower radio surface brightness, and the possible elliptical structure mentioned in § 3 (see Figure 2), which has a radius of 4″. In high-resolution X-ray images, there is a central, bright region which has an elliptical shape, elongated along the northwest-southeast direction, with a size of (Camilo et al., 2006, see also Matheson & Safi-Harb 2005; Slane et al. 2000). If both these radio and X-ray structures are interpreted as being associated with the pulsar wind termination shock, then a radius for the latter of 4″ is suggested, which implies that . Given that the only two well-resolved termination shock structures, being those in the Crab Nebula and in Vela, seem to lie predominately in the pulsar’s equatorial plane, and thus have , it seems this interpretation is not unreasonable. A more conclusive interpretation will have to await higher-resolution radio and/or X-ray observations.
References
- Altenhoff et al. (1970) Altenhoff, W. J., Downes, D., Goad, L., Maxwell, A., & Rinehart, R. 1970, Astron. Astrophys. Suppl. Ser., 1, 319
- Becker & Kundu (1976) Becker, R. H., & Kundu, M. R. 1976, ApJ, 204, 427
- Becker & Szymkowiak (1981) Becker, R. H., & Szymkowiak, A. E. 1981, ApJL, 248, L23
- Bietenholz (2006) Bietenholz, M. F. 2006, ApJ, 645, 1180
- Bietenholz et al. (2001a) Bietenholz, M. F., Frail, D. A., & Hester, J. J. 2001a, ApJ, 560, 254
- Bietenholz et al. (2004) Bietenholz, M. F., Hester, J. J., Frail, D. A., & Bartel, N. 2004, ApJ, 615, 794
- Bietenholz et al. (1997) Bietenholz, M. F., Kassim, N., Frail, D. A., Perley, R. A., Erickson, W. C., & Hajian, A. R. 1997, ApJ, 490, 291
- Bietenholz et al. (2001b) Bietenholz, M. F., Kassim, N. E., & Weiler, K. W. 2001b, ApJ, 560, 772
- Bietenholz et al. (1991) Bietenholz, M. F., Kronberg, P. P., Hogg, D. E., & Wilson, A. S. 1991, ApJL, 373, L59
- Blondin et al. (2001) Blondin, J. M., Chevalier, R. A., & Frierson, D. M. 2001, ApJ, 563, 806
- Bocchino et al. (2005) Bocchino, F., van der Swaluw, E., Chevalier, R., & Bandiera, R. 2005, Astron. Astrophys., 442, 539
- Bock et al. (2001) Bock, D. C.-J., Wright, M. C. H., & Dickel, J. R. 2001, ApJL, 561, L203
- Briggs et al. (1999) Briggs, D. S., Schwab, F. R., & Sramek, R. A. 1999, in Astronomical Society of the Pacific Conference Series, Vol. 180, Synthesis Imaging in Radio Astronomy II, ed. G. B. Taylor, C. L. Carilli, & R. A. Perley, 127
- Camilo et al. (2006) Camilo, F., Ransom, S. M., Gaensler, B. M., Slane, P. O., Lorimer, D. R., Reynolds, J., Manchester, R. N., & Murray, S. S. 2006, ApJ, 637, 456
- Chevalier (2005) Chevalier, R. A. 2005, ApJ, 619, 839
- Davelaar et al. (1986) Davelaar, J., Smith, A., & Becker, R. H. 1986, ApJL, 300, L59
- Fleishman & Bietenholz (2007) Fleishman, G. D., & Bietenholz, M. F. 2007, MNRAS, 376, 625
- Frail & Moffett (1993) Frail, D. A., & Moffett, D. A. 1993, ApJ, 408, 637
- Fürst et al. (1988) Fürst, E., Handa, T., Morita, K., Reich, P., Reich, W., & Sofue, Y. 1988, PASJ, 40, 347
- Gaensler & Slane (2006) Gaensler, B. M., & Slane, P. O. 2006, Ann. Rev. Astron. Astrophys., 44, 17
- Gallant & Tuffs (1998) Gallant, Y. A., & Tuffs, R. J. 1998, Memorie della Societa Astronomica Italiana, 69, 963
- Gupta et al. (2005) Gupta, Y., Mitra, D., Green, D. A., & Acharyya, A. 2005, Current Science, 89, 853
- Jun (1998) Jun, B.-I. 1998, ApJ, 499, 282
- Kassim (1992) Kassim, N. E. 1992, AJ, 103, 943
- Kirshner et al. (1989) Kirshner, R. P., Morse, J. A., Winkler, P. F., & Blair, W. P. 1989, ApJ, 342, 260
- Leahy & Tian (2007) Leahy, D. A., & Tian, W. 2007, ArXiv e-prints, 711
- Livingstone et al. (2006) Livingstone, M. A., Kaspi, V. M., Gotthelf, E. V., & Kuiper, L. 2006, ApJ, 647, 1286
- Matheson & Safi-Harb (2005) Matheson, H., & Safi-Harb, S. 2005, Advances in Space Research, 35, 1099
- Morsi & Reich (1987) Morsi, H. W., & Reich, W. 1987, Astron. Astrophys. Suppl. Ser., 69, 533
- Nugent (1998) Nugent, R. L. 1998, PASP, 110, 831
- Safi-Harb et al. (2001) Safi-Harb, S., Harrus, I. M., Petre, R., Pavlov, G. G., Koptsevich, A. B., & Sanwal, D. 2001, ApJ, 561, 308
- Salter et al. (1989) Salter, C. J., Reynolds, S. P., Hogg, D. E., Payne, J. M., & Rhodes, P. J. 1989, ApJ, 338, 171
- Salvati et al. (1998) Salvati, M., Bandiera, R., Pacini, F., & Woltjer, L. 1998, Memorie della Societa Astronomica Italiana, 69, 1023
- Sault et al. (1995) Sault, R. J., Teuben, P. J., & Wright, M. C. H. 1995, in Astronomical Society of the Pacific Conference Series, Vol. 77, Astronomical Data Analysis Software and Systems IV, ed. R. A. Shaw, H. E. Payne, & J. J. E. Hayes, 433
- Slane et al. (2000) Slane, P., Chen, Y., Schulz, N. S., Seward, F. D., Hughes, J. P., & Gaensler, B. M. 2000, ApJL, 533, L29
- Slane et al. (2004) Slane, P., Helfand, D. J., van der Swaluw, E., & Murray, S. S. 2004, ApJ, 616, 403
- Tan & Gull (1985) Tan, S. M., & Gull, S. F. 1985, MNRAS, 216, 949
- Trimble (1968) Trimble, V. 1968, AJ, 73, 535
- van der Swaluw et al. (2001) van der Swaluw, E., Achterberg, A., Gallant, Y. A., & Tóth, G. 2001, Astron. Astrophys., 380, 309
- Wang et al. (1986) Wang, Z. R., Liu, J. Y., Gorenstein, P., & Zombeck, M. V. 1986, Highlights of Astronomy, 7, 583
- Warwick et al. (2001) Warwick, R. S., Bernard, J.-P., Bocchino, F., Decourchelle, A., Ferrando, P., Griffiths, R. G., Haberl, F., La Palombara, N., Lumb, D., Mereghetti, S., Read, A. M., Schaudel, D., Schurch, N., Tiengo, A., & Willingale, R. 2001, Astron. Astrophys., 365, L248
- Wilson & Weiler (1976) Wilson, A. S., & Weiler, K. W. 1976, Astron. Astrophys., 49, 357
- Woltjer et al. (1997) Woltjer, L., Salvati, M., Pacini, F., & Bandiera, R. 1997, Astron. Astrophys., 325, 295