Contribution to the study of narrow low mass hadronic structures
Abstract
New data are presented, concerning narrow exotic structures in mesons, baryons and dibaryons. The sequence of narrow baryons is quite well described starting from the sequence of narrow mesons. In the same way, the sequence of narrow dibaryons is rather well described starting from the sequence of narrow baryons. Lastly it is shown that the masses of these narrow hadronic structures lie on straight line Regge-like trajectories.
pacs:
13.60.Le, 13.60.Rj, 13.85.Ni, 13.85.Hd, 14.20.PtI Introduction
This paper presents new data concerning narrow hadronic structures in several species, namely in mesons, baryons, and dibaryons. Many data were already published, and therefore are not repeated here, the corresponding papers are only quoted. Some new data, not published up to now, are shown.
It is also desirable to look at possible similitudes between mass spectra of the three hadronic species. Indeed, if such connection exist, it will give a strong argument in favor of the genuine existence of these structures, which therefore could not be associated to accidental statistical effects.
II Mesons
II.1 Short summary of previously published data
A paper, recently published btetg , shows evidence for narrow and weakly excited mesonic structures, with masses below and just above the pion mass (M=139.56 MeV). These data are mainly missing mass precise spectra of the ppppX reaction, studied at SPES3 (Saturne) and also selected results from COSY, Celsius, MAMI, and JLAB Hall A, Hall B, and Hall C. The statistical confidence is often large. In some cases, this confidence is not large, but several structures at approximately the same masses are observed. These masses are M=62 MeV, 80 MeV, 100 MeV, 181 MeV, 198 MeV, 215 MeV, 227.5 MeV, and 235 MeV, although the last one may be uncertain, since determined by only three data, and being located at the limit of the spectra.
II.2 New data from the pp reaction studied at MAMI
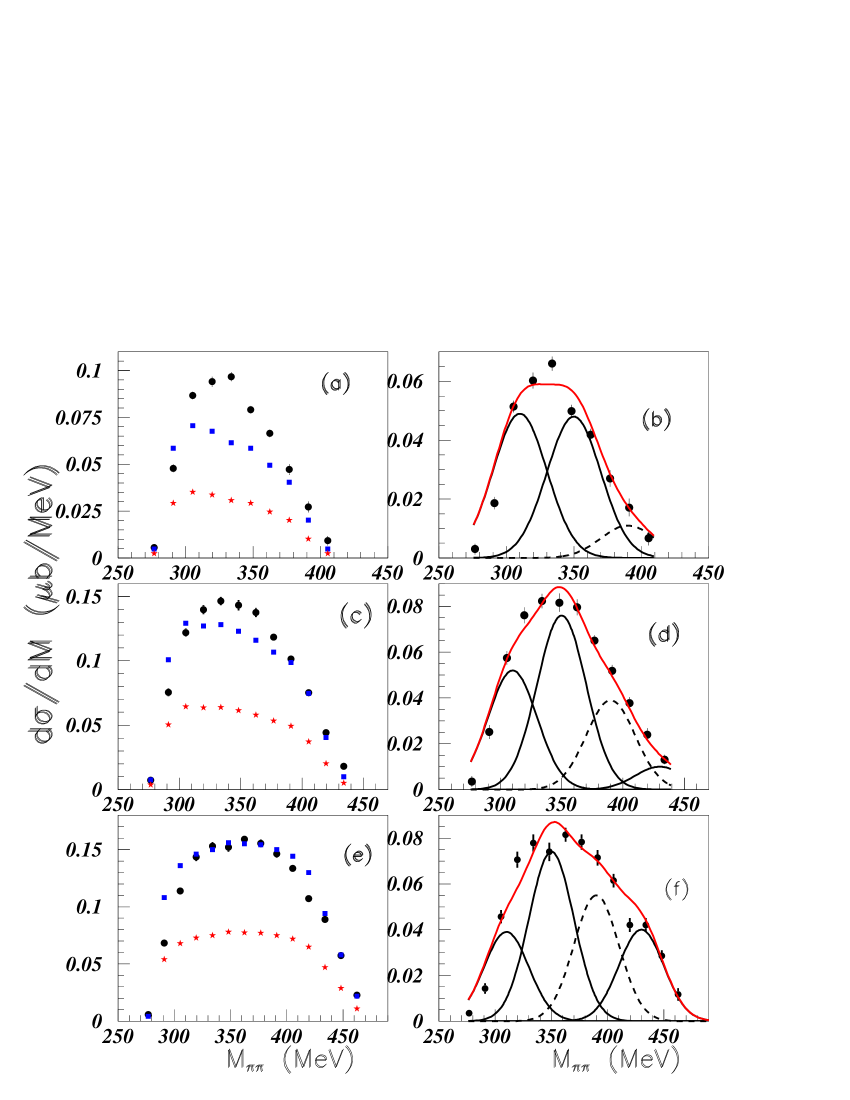
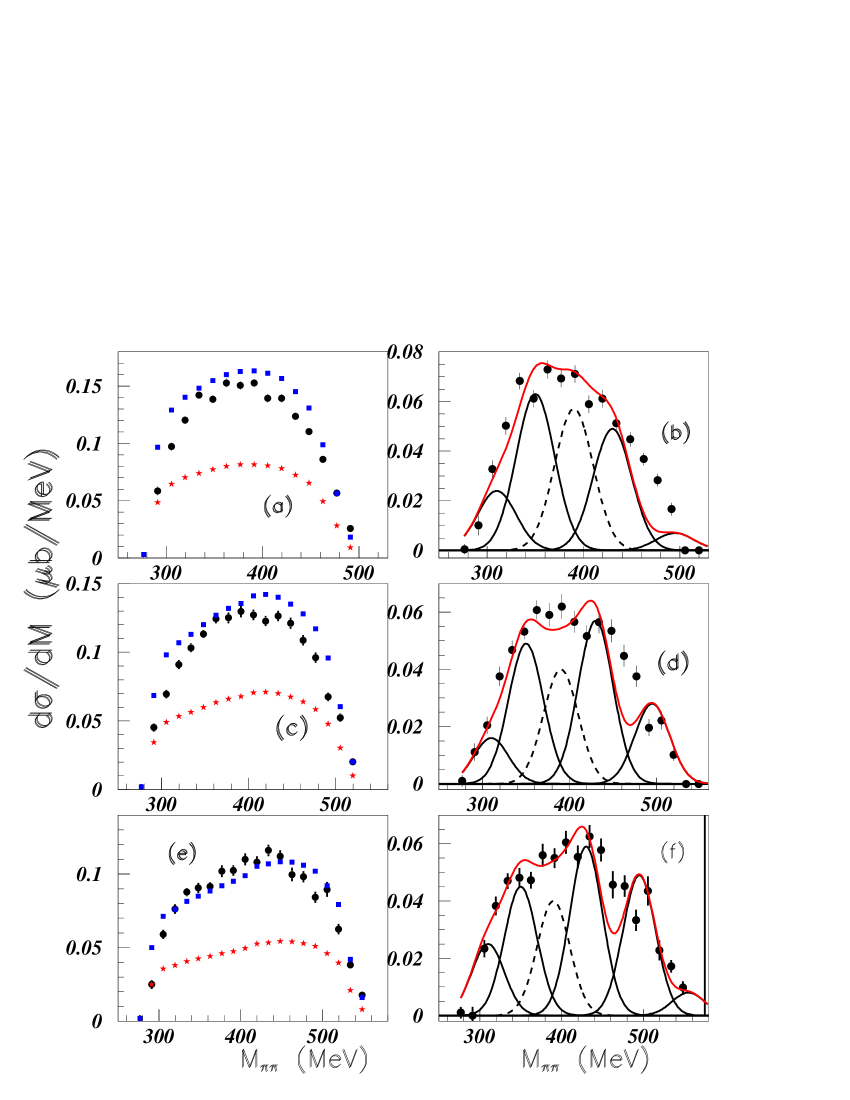
The helicity dependence for the pp reaction was studied with the detector DAPHNE at the tagged photon beam facility at the MAMI accelerator in Mainz ahrens . The cross sections were assembled into six ranges of photon incident energy, with photon energy interval widths of 50 MeV, altogether between 500 MeV and 800 MeV. The spectra were compared by the authors ahrens to the predictions of the Fix-Arenhövel model arenhovel (FA).These spectra, versus the two-pion invariant mass Mππ, show some small structures well outside the statistical uncertainties.
An attempt is done here, to look how better agreement can be achieved, with the assumption to add small narrow mesonic structures to the Fix-Arenhövel model, at the same masses as those extracted from previous papers. Since the model gives in some cases larger cross sections than the measured ones, we have arbitrarily renormalized the model values by 0.5, in order to suppress all negative differences. Fig. 1 and fig. 2 show the cross sections for the six incident photon energies. The masses of the gaussians are Mππ=310 MeV, 350 MeV, 390 MeV, 430 MeV, 495 MeV, and 555 MeV. A gaussian at M=390 MeV is introduced here although not extracted before. The gaussians widths are fixed to =20 MeV. Fig. 3, and fig. 4 show the cross sections for the spin-1/2 state for the p system.
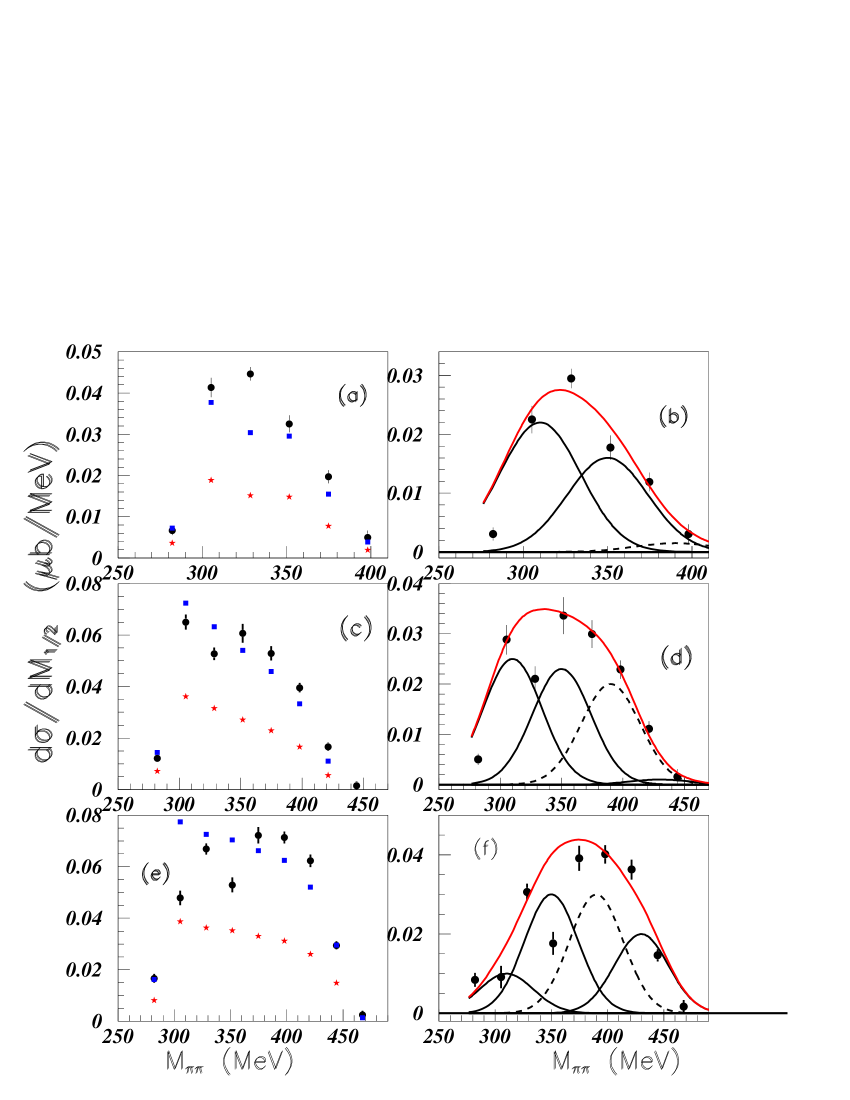
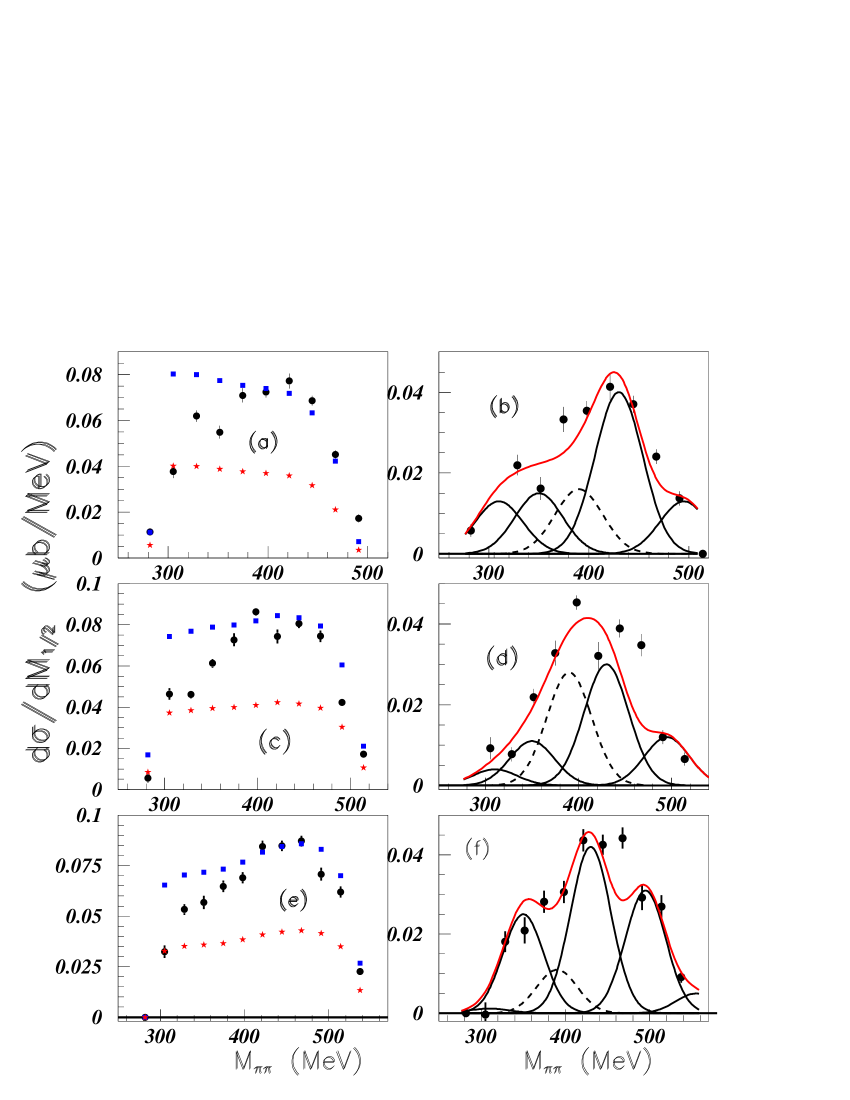
Fig. 5 and fig. 6 show the cross sections for the spin-3/2 state for the p system. The same masses are used for all six figs., but in figs. 3, 4, 5, and 6 a larger width (=24 MeV) is used for gaussians, since the experimental binning is larger.
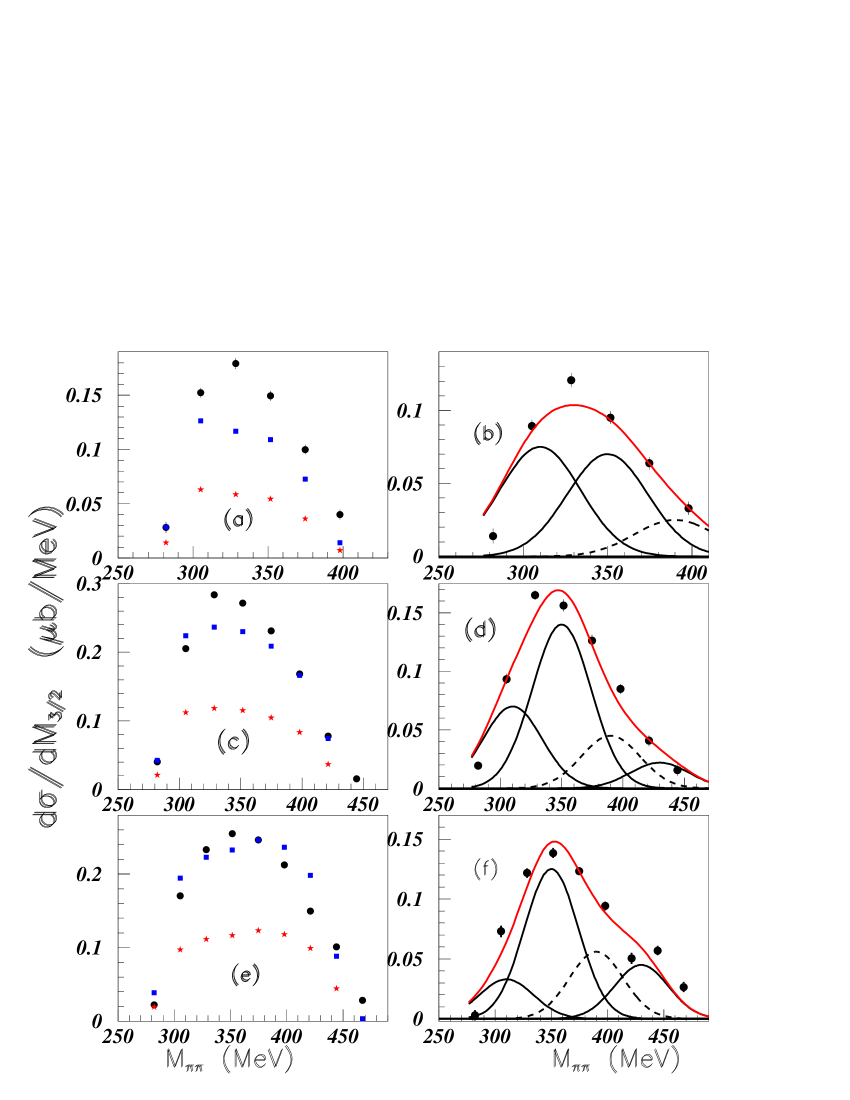
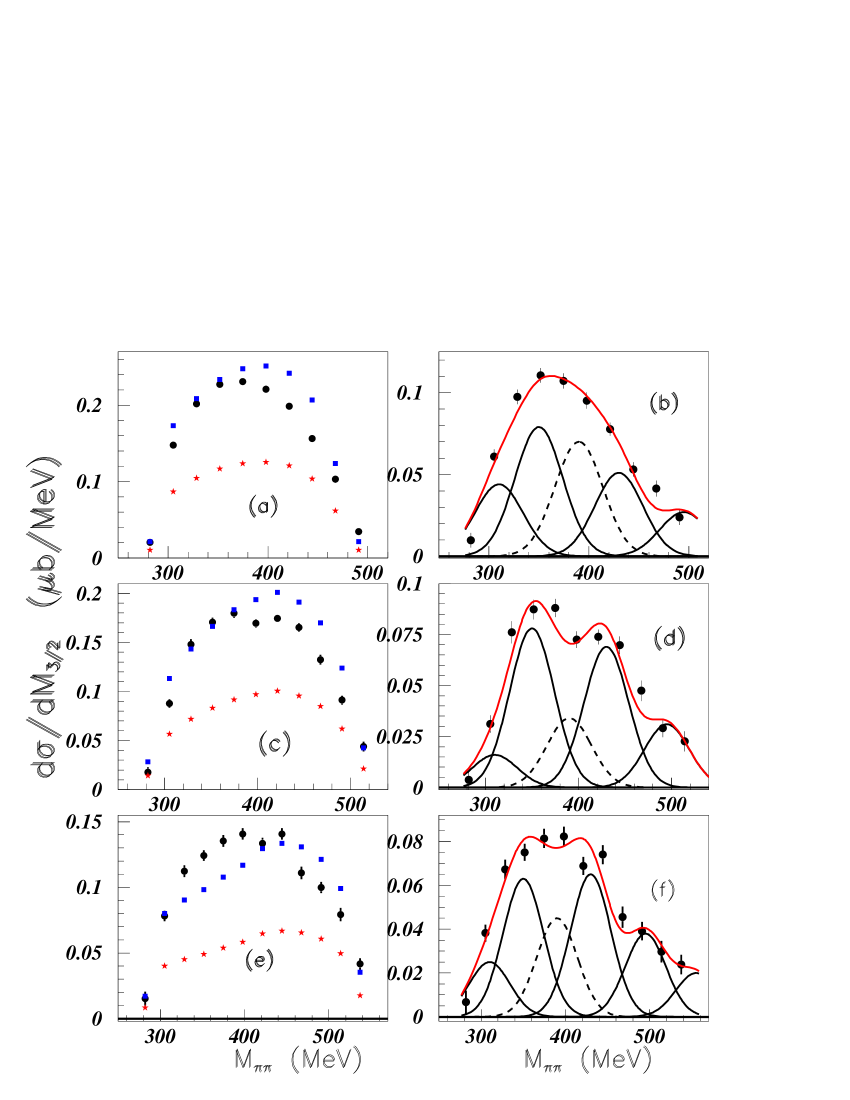
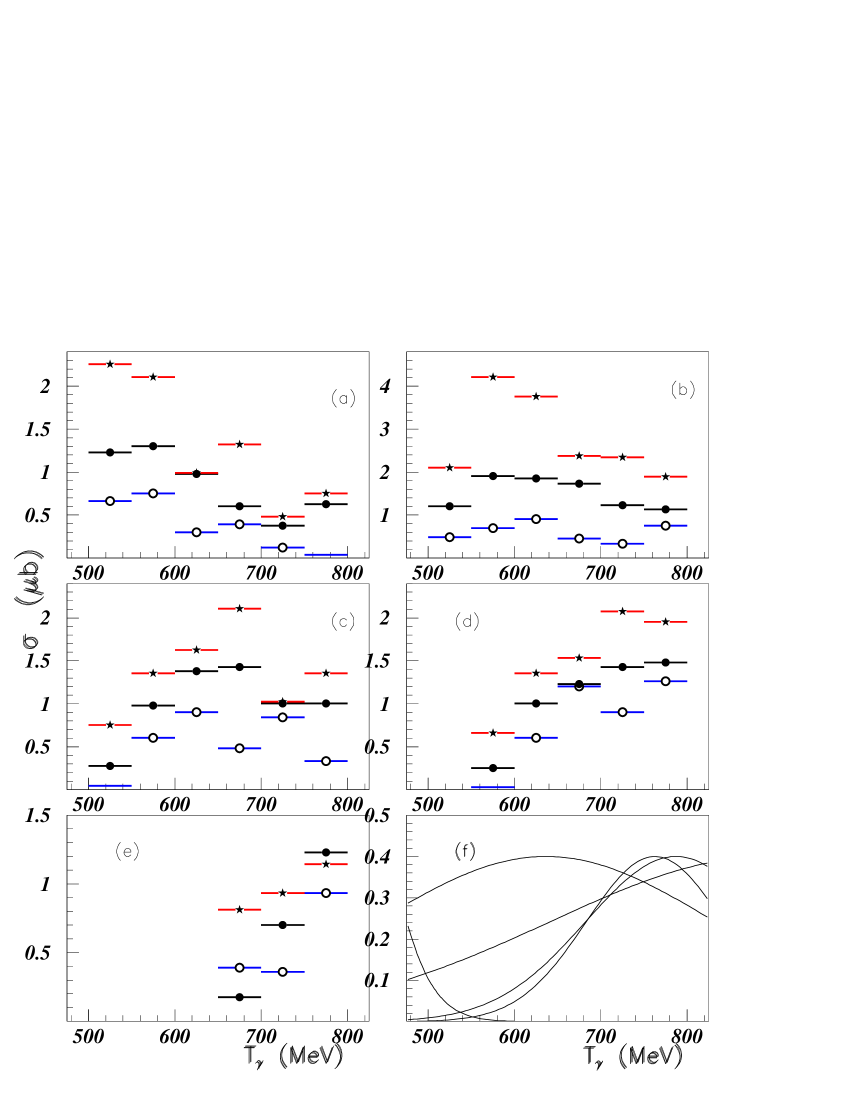
Fig. 7 shows the integral of the narrow structure cross sections. We observe that each insert, which corresponds to a specific narrow mesonic structure mass, show a regular shape, smoothly varying with the incident photon energy. We observe that the M=310 MeV structure is mainly influenced by the (1232) resonance. The last insert (f) shows, the display of the broad PDG baryonic resonances arbitrarily normalized. We observe that the shapes of all narrow mesonic increasing mass structures, are ”influenced” by increasing PDG baryonic resonance masses. However such property cannot help us to suggest a possible isospin or spin, to the narrow mesonic structures.
II.3 The old ppdX data
The ppdX reaction was studied in Birmingham hall long time ago. In order to study the phase shifts of the T=0 interaction, the authors compare the correponding cross sections with those obtained using a deuteron target. They extracted the spectrum of the T=0 d2 which was plotted versus pd, the detected deuteron momentum (their fig. 4). This spectrum was read, and reported in fig. 8(a) versus the missing mass of the reaction. We observe the two branches of the kinematics at both sides of the maximum missing mass MX=430 MeV. Indeed the incident proton energy Tp=991 MeV, and the deuteron lab. scattering angle =4.20 allow a maximum missing mass MX=430 MeV. In fig. 8(a) we reported below the data, their calculation of the enhanced phase space incorporating a value of 1.0 for the S-wave scattering length, renormalized by 0.5 in order to be lower than the data in all spectrum range.
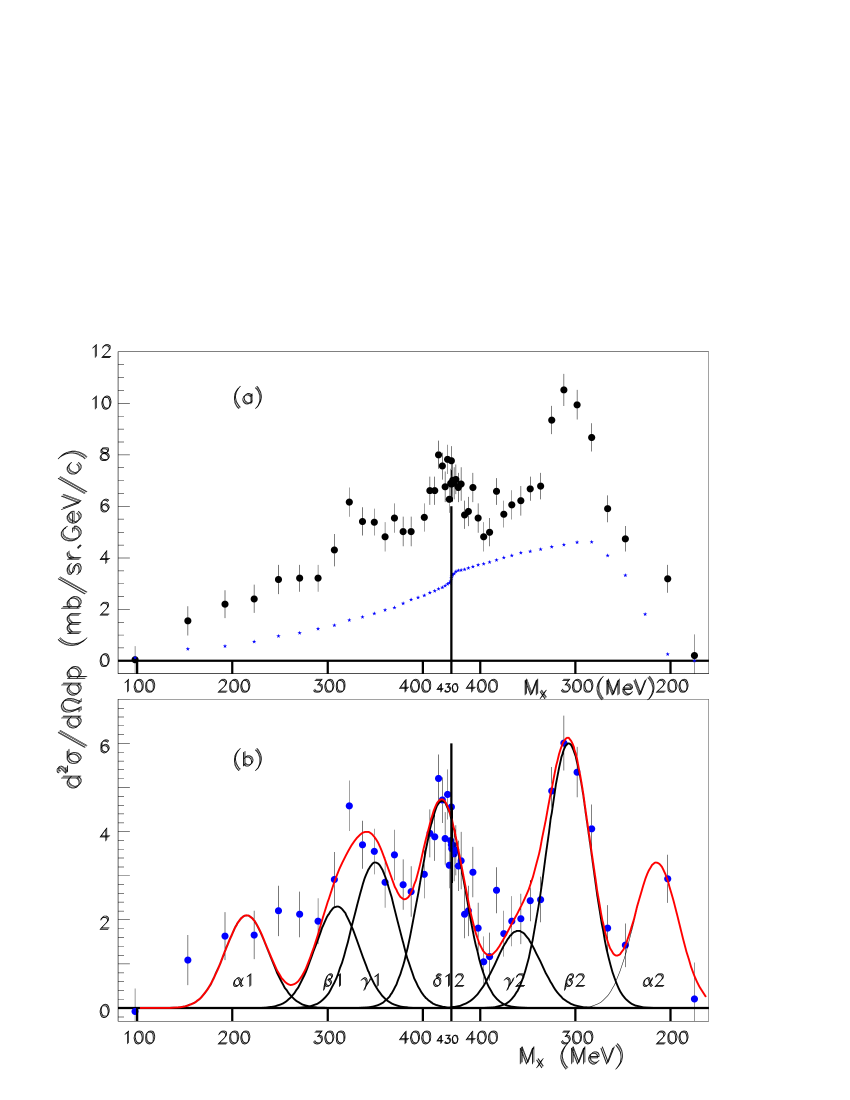
Fig. 8(b) shows the data subtracted from this phase space. Clear structures are extracted, which are already seen in insert (a). The real shape of the space space is therefore not important, provided it does not present narrow structures. Table I shows that the masses of the extracted peaks reproduced fairly well the narrow structure masses extracted previously from the SPES3 data.
| 1 | 2 | spes3 | 1 | 2 | spes3 | 1 | 2 | spes3 | 12 | spes3 |
| 215 | 215 | 215 | 310 | 307 | 310 | 350 | 360 | 350 | 420 | 430 |
All structures are extracted with gaussians with an unique width =23 MeV.
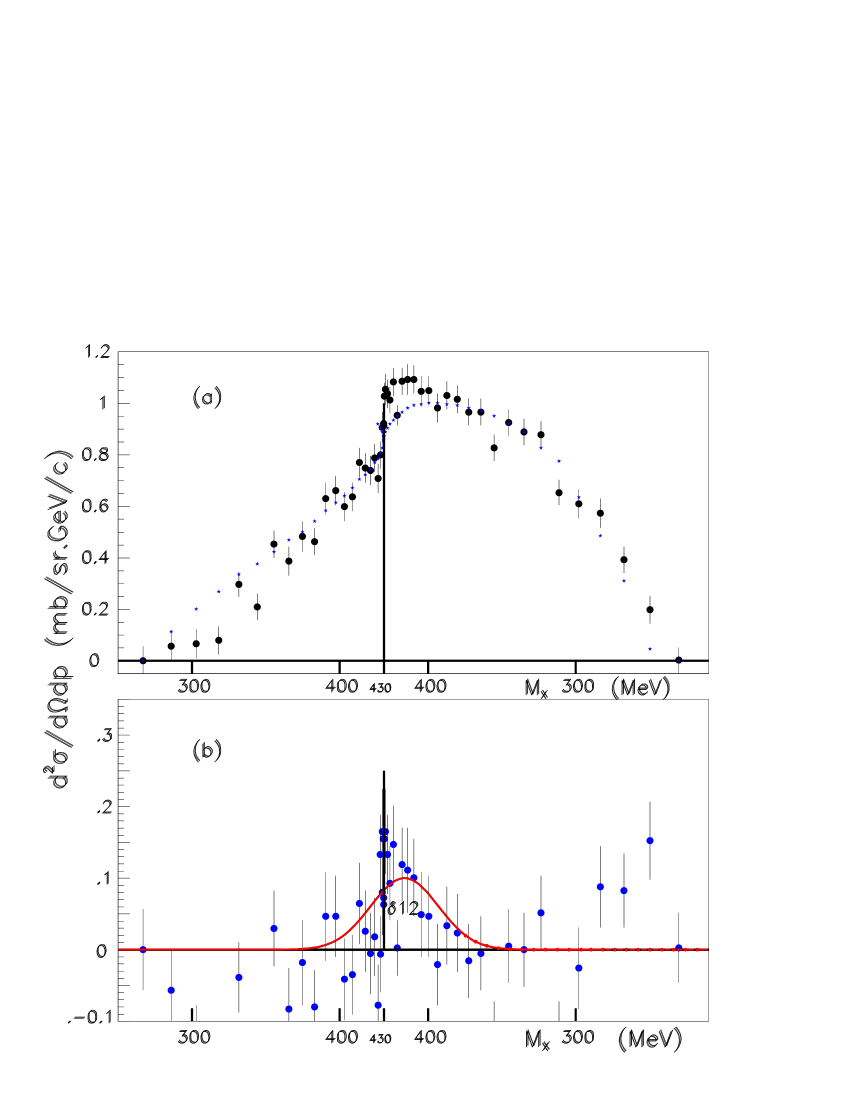
Fig. 9 shows the corresonding results for T=1 isospin state (ppdX reaction). Here, except a possible very small structure close to MX=430 MeV, no clear isevectorial structure can be extracted. This agrees with the Bose-Einstein statistics. Indeed these low mass pionic structures have l=0 orbital momenta, and the total two-pion isospin must be even. This agrees also with the spin and isospin values predicted for these states from the SPES3 data jy .
II.4 Discussion
Several other data, sometimes not very precise, exist, which exhibit the presence of structures not belonging to classical PDG mesons. For example, the missing mass of the ppppX reaction, measured at Argonne National Laboratory anderson . In their fig. 3(b) a clear peak is observed between the and the mesons. An additionnal argument in favor of these structures can be put forward, if the corresponding masses display a continuous behaviour when displayed on Regge trajectories.
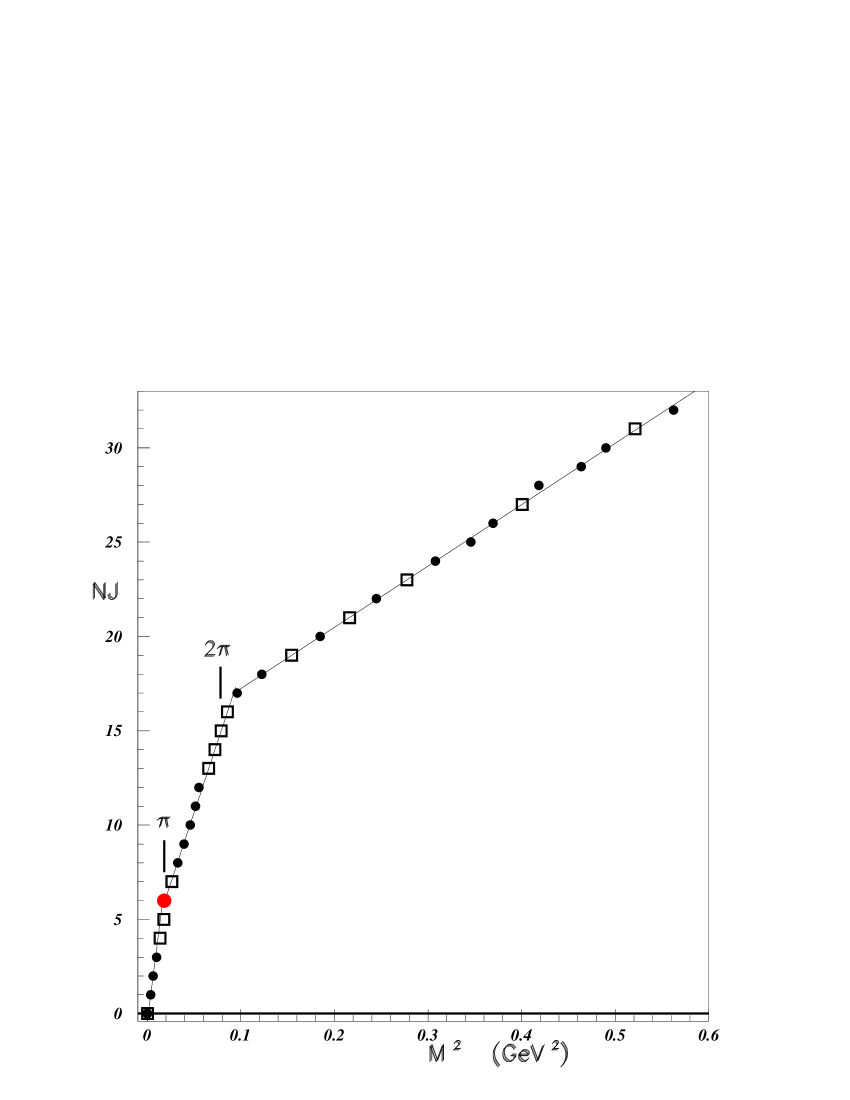
It is accepted that all hadrons are Reggeons, that is lie on Regge trajectories. This was studied in btetg where it was shown that three straight lines describe the Regge-like trajectories. Fig. 10 reproduces this result.
We name them Regge-like, since the integer values in the ordinate - NJ - represent an unknown quantum number. The first line lies below one pion mass, the second line lies between one and two pion masses, and the third line lies above two pion masses. We get very large slopes ”b” (in GeV-2) - see table II, when the corresponding value from the broad PDG mesons is close to b=0.877 afonin .
In previous works showing evidence for narrow hadronic structures, their masses were computed using a mass formula for two clusters of quarks at the ends of a stretched bag derived some years ago in terms of color magnetic interactions mul :
where and are parameters deduced in mul from mesonic and baryonic mass spectra, and , are isospin, spin of the first (second) quark cluster. Although it is not proven that these structures are a manifestation of colored quark clusters, we have considered such assumption and shown that the use of such mass formula, with the condition to be phenomenological, allows to reproduce the experimentally observed masses with only two adjustable parameters. Notice that the formula give rise to degenerascy in spin and isospin.
Now, using the Regge-like trajectory slopes, we are able to suggest the masses of both clusters. We use a simple relation, derived long time ago by Barut barut ackers , which relates (with several assumptions) the slope ”b” of the Regge-like trajectories with the masses of two interacting clusters:
where m1 and m2 are the masses of both clusters. Using the assumption that the mass of the constituent quarks mq = m is close to 310 MeV, the previous formula allows us to determine the clusters through the calculation of the corresponding quark mass. The results of such calculations for mesons are shown in table II. The clusters giving a mass close to M=310 MeV are favoured.
We observe that the ()-() clusters are the most appropriate for the present analysis. For the larger masses studied here, the clusters may also be appropriate. For mesons, we have made the assumption that the clusters are (q. The configurations are not introduced, since there is no room for such configurations in the field of narrow exotic mesonic structures. For these low mass mesonic structures, we have l=0 orbital momenta between both quark clusters, and then all levels have positive parities.
It was previously shown, in jy bt1 , that the experimentally observed narrow mesonic structure masses were satisfactory reproduced above two pion threshold mass, by calculation, using mass formula [1], with M0=310 MeV and M1=30 MeV. Table II shows that above two-pion threshold mass, where the Regge-like trajectory slope equals 32.5 GeV-2, the quark cluster configurations should be first ()-(), and for larger masses . This was indeed done in jy , where above M=470 MeV the masses were calculated using configurations, and above M=620 MeV using configurations bt1 .
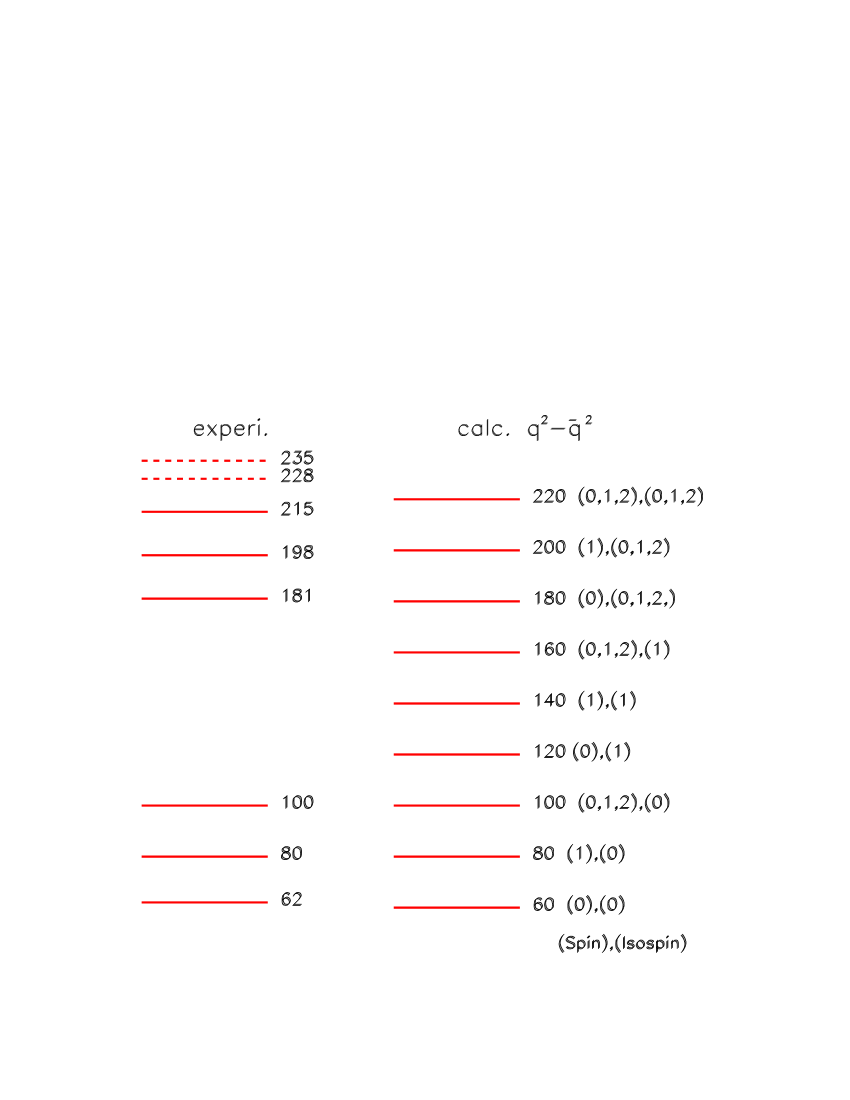
Here, below two-pion mass, because the large value of the Regge-like trajectory slope, the ()-() configurations must be used. This is done in fig. 11. There is no obligation to use the same values of both parameters, as those used in the mass range above two pion threshold. We keep however the same value of M1=30 MeV, and adjust only M0=60 MeV, in order to get the masses shown in fig. 11.
| b (GeV-2) | () | ( | Mmin | Mmax |
| 390 | 104.8 | 69.8 | 0 | 135 |
| 149.7 | 169.1 | 112.7 | 235 | 300 |
| 32.5 | 362.9 | 242 | 300 | 760 |
If we omit the three predicted structures at M=120 MeV, 140 MeV, and 160 MeV, we observe the agreement between experimental and calculated masses. The calculated mass at M=140 MeV cannot be the pion, since the spin here is J=1. More, the large pion peak excitation is clearly related to configurations, These three predicted small structures at M=120 MeV, 140 MeV, and 160 MeV, could only be looked for in dedicated experiments with very good resolution, therefore at low incident energy and forward angle missing mass experiments.
III Baryons
III.1 Previously shown narrow baryonic structures data
Narrow baryonic structures were observed, first in the mass range 1.0M1.4 GeV studied at SPES3 (Saturne) with use of the pppX reactions bo1 . This study was followed by the introduction of the data from the ppppX reaction bo2 and then confirmed by a careful scrutiny of different cross-sections obtained as well with incident hadrons as with incident leptons. The extracted data were reported in several papers, corresponding to the following ranges: 1.47M1.68 GeV bo4 , 172M1.79 GeV bo3 . The masses in the mass range 1.0M1.14 GeV are: M=1.004, 1044, 1094, 1136, 1173, 1249, 1277, 1339, and 1384 MeV. In the mass range 1.46M1.68 GeV, they are: M=1479, 1505, 1517, 1533, 1542, 1554, 1564, 1577, 1601, 1622, 1639, 1659, and 1669 MeV. In the mass range 1.72M1.79 GeV, they are: M=1747 and 1772 MeV.
III.2 New data from the missing mass of the pppX reaction studied at SPES3 (Saturne)
The low mass range MM1.0 GeV was also studied, but only preliminary results bo5 were shown up to now.
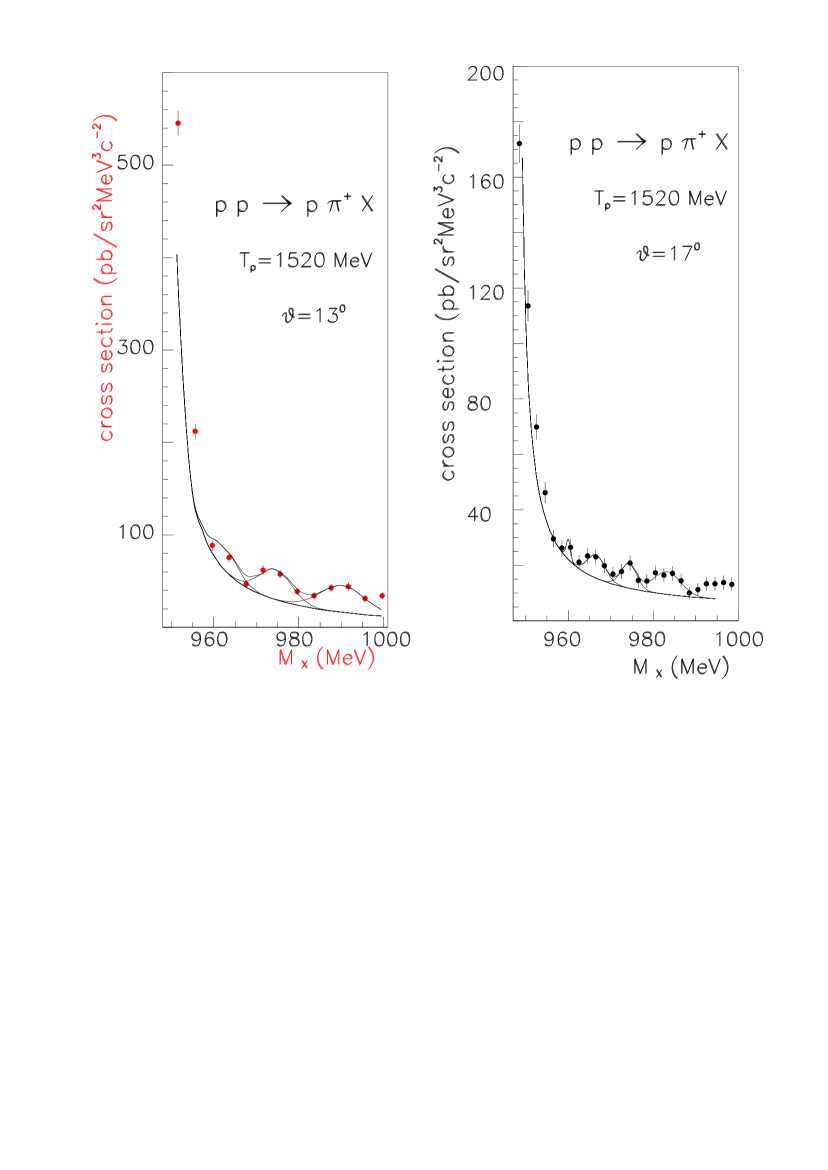


Therefore the results in this low MM1.0 GeV mass range are presented here. Figs. 12, 13, and 14 show a selection of cross-sections from pppX reactions studied at SPES3 (Saturne). Each fig. shows two spectra at the same incident energy and two different spectrometer angles. We observe ”oscillatory paterns”, allowing an attempt to define narrow structure masses. Here the background determination is clearly somewhat ambiguous. Several different choices can be used for background. The first one consists to draw an averaged background inside the data. Then all structures will be strongly reduced, if not disappear. However we consider as quit unlikely the situation where many spectra will exhibit an oscillatory pattern and where all these oscillations will be accidental. The second choice consists to consider these variations as physical, and to give them the same width as the experimental neutron missing mass widths which increased slowly with the spectrometer angle. Then the structures will be extracted with a higher number of standard deviation (S.D.). We choose the third - intermediate - choice and draw the background using the low data points as in Fig. 12 Although 54 peaks were extracted from all cross section spectra, only 18 were kept which had a valuable statistical significance, since they were extracted with S.D. 3. The corresponding masses are displayed in Fig. 15. When a mass ( 1 MeV) is obtained at least twice, it is considered as being a candidate for a new structure and an horizontal dashed range is drawn in Fig. 15. These masses are: M=950 MeV, 955.4 MeV, 961.5 MeV, 973 MeV, 988 MeV, and 994.8 MeV. The figure shows also the two narrow masses (at 966 MeV and 986 MeV), extracted by L.V. Filkov et al. from the p d p p X1 reaction fil .

III.3 Discussion
As done above for mesons, the study of Regge-like trajectories of the narrow structure baryonic masses is done and shown in fig. 16.

Here five different slopes are observed: the first two slopes: b=100.4 GeV-2 and b=62.6 GeV-2 in the region close to N, the third one: b=10.7 GeV-2 in the mass region of the first (3/2, 3/2), then the next slope b=27.3 GeV-2 in the mass region of several N∗, and finally b=15.9 GeV-2 in the next mass region where some excitations predominate. Table III shows, for baryons, the constituent quark mass, depending on the quark clusters considered. We observe the different cluster predictions for all five slopes.
For baryons, in the analysis of the narrow baryonic structures at 1.0M1.4 GeV bo1 bo2 , we have made the assumption that the clusters are with M0=838.2 MeV and M1=100.3 MeV. The first quantum numbers of the configurations are the same that those of configurations, but these last are restricted to ”classical” Particle Data Group (PDG) baryons pdg . Indeed there is no room for exotic baryons within these configurations caps . Table III shows that in the mass range MM1.0 GeV, where the slope of the Regge-like trajectory equals 10.7 GeV-2 such choice of configurations, namely is indeed predicted.
In the mass range MM1.0 GeV, following table III the masses of the narrow baryonic structures should be described with the lower mass cluster configurations. Following the previous remark, we use configurations to predict the masses.

The two parameters, M0=924 MeV, and M1=15.6 MeV are adjusted in order to describe the neutron mass and the first exotic mass at 950 MeV. The other masses, possible spins and isospins, obtained with the use of formula [2], are shown in Fig. 17. We observe the good correspondance between the experimental and the calculated masses since such correspondance is obtained without any other adjustable parameter.
IV Dibaryons
The spectrum of narrow exotic dibaryons was reported in bt , where cross-sections of experiments performed at Saturne (SPES1 and SPES3) and in different other laboratories were reanalyzed. In the mass range studied, these masses are: M=1902, 1916, 1941, 1969, 2016, 2052, 2087, 2122, 2155, 2194, 2236, and 2282 MeV. These masses were reproduced quite satisfactory, using the mass formula [3] for quark clusters. Such agreement was obtained with =1841 MeV and =52.5 MeV. Although the Barut’s formula suggests more heavy clusters, with one or two additionnal contributions, the low calculated masses with 0 or 1 spin and isospin values are obtained indifferently of these assumptions for clusters.
Notice that the same masses and quantum numbers are obtained if quark clusters will be considered. Indeed this last choice will allow additionnal masses only above M=2681 MeV, therefore larger than those discussed here.
The corresponding Regge-like trajectory is shown in fig. 18.

V General discussion
V.1 Connection between exotic meson masses and exotic baryon masses
When applying equation [2] for the calculation of exotic hadronic masses, we consider all possible spins and isospins obtained by addition of clusters to for mesons and for baryons. It is therefore natural to compare the sequences of narrow mesonic and baryonic masses. The corresponding result is shown in fig. 19.
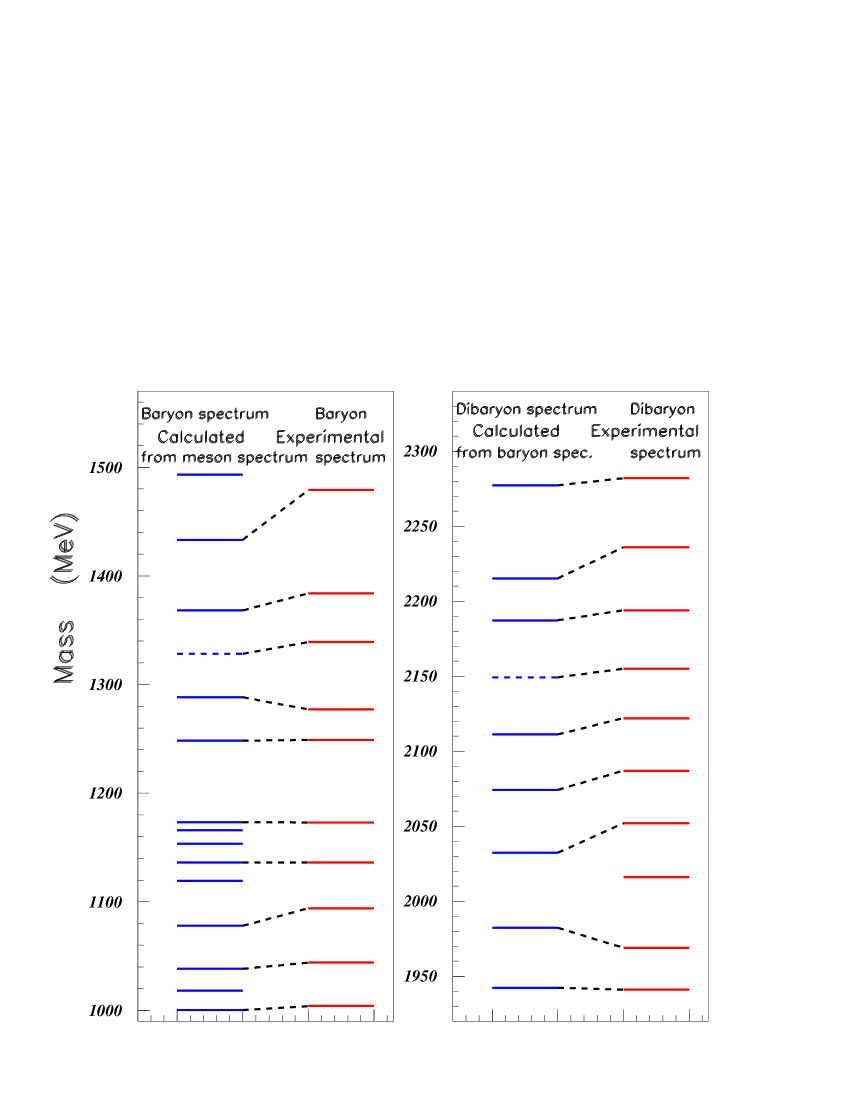
The left part of the fig. 19 shows the masses of the experimental narrow baryons above 1 GeV compared to the calculated masses obtained by addition of the nucleon mass to the masses of narrow experimental mesons. The absence of some baryonic masses may be related to their experimental non observation due to poorer resolution than the one got for low mesonic mass measurements. The overall correspondance is noteworthy. The dashed calculated mass uses the mesonic experimental value (M=390 MeV), not extracted in previous papers, but extracted in this work - see section II.B. The right part shows in the mass range 1920 M2300 Mev, the comparison between the experimental masses of narrow dibaryons and the masses obtained by addition of the nucleon mass to the narrow exotic baryonic masses. The dashed calculated mass, is obtained starting from an experimental mass M=1210 MeV, not extracted from the first analyses, but extracted pap in the reanalysis of the pn reaction studied at MAMI lang and the reanalysis of the H(e,e’)X electroproduction cross-section measured at JLAB Hall C nav .
V.2 Discussion
For all three species, the slope (in GeV-2) decreases for increasing masses. All extracted slopes are larger (in GeV-2) than the slopes for ”classical” PDG hadrons.
The importance of the concept of diquarks was often quoted in many papers. It was quantitatively discussed, on many examples of the PDG hadron spectroscopy by Sellem ans Wilczek sellem . Mass formula [1] agrees with their statement ”that the antisymmetric spin(isospin)-singlet state is more favorable energetically than the symmetric spin(isospin)-triplet state”. Indeed, the calculated masses increase with spin (isospin). For baryons, the two first (3/2, 3/2) calculated masses have M=1200 MeV and M=1275 MeV. In bo4 it was shown that ”the broad PDG baryonic resonances are in fact collective states of several weakly excited and narrow resonances.” Then the mean calculated mass value between M=1200 MeV and M=1275 MeV is at Mc=299 MeV from the nucleon mass, to compare to the experimental value: Me=290 MeV.
Following sellem good diquarks have spin 0 and isospin 0. We apply it for our diquark clusters for mesons, and observe that such condition is fullfilled for the calculated masses: M=60 MeV, and is possible for M=100 MeV, 180 MeV, and 220 MeV. All three unobserved masses at M=120 MeV, 140 MeV, and 160 MeV, correspond to bad diquark cluster configurations (triplet spin (isospin) cluster state).
VI Conclusion
In conclusion we have confirmed the existence of narrow structures in all three low mass hadronic species. The corresponding masses are reproduced with a small number of parameters, with help of a phenomenological mass relation [2]. These masses fit strait lines in Regge-like trajectories. This study stress on the importance of careful scrutiny of low mass hadronic spectroscopies.
| b (GeV-2) | Mmin | Mmax | |||
|---|---|---|---|---|---|
| 100.4 | 292.8 | 168.6 | 119.2 | 939.6 | 957 |
| 62.6 | 369.7 | 213.5 | 150.9 | 957 | 1004 |
| 10.7 | 893.7 | 516 | 364.9 | 1004 | 1480 |
| 27.3 | 559.7 | 323.2 | 228.5 | 1480 | 1575 |
| 15.9 | 733.8 | 423.7 | 299.6 | 1575 | 1780 |
We thank prof. E.A. Kuraev for valuable discussions.
References
- (1) B. Tatischeff and E. Tomasi-Gustafsson, Physics of Elementary Particles and Atomic Nuclei, to be published.
- (2) J. Yonnet et al., Phys. Rev. C63, 014001 (2000).
- (3) B. Tatischeff et al., Phys. Rev. C62, 054001 (2000).
- (4) J. Ahrens et al., Eur. Phys. J. A 34, 11 (2007).
- (5) A. Fix and H. Arenhövel, Eur. Phys. J. A. 25, 115 (2005).
- (6) J.H. Hall, T.A. Murray, and L. Riddiford, Nucl. Phys. B12, 573 (1969).
- (7) H.L. Anderson et al., Phys.Rev.Lett. 18, 89 (1967).
- (8) S.S. Afonin, Eur. Phys. J. A 29, 327 (2006).
- (9) P. J. Mulders, A. T. Aerts and J. J. de Swart Phys.Rev. D21, 2653 (1980); Phys. Rev. D19, 2635 (1979); Phys.Rev.Lett. 40, 1543 (1978).
- (10) A.O. Barut, Phys. Rev. D3, 1747 (1971).
- (11) D. Ackers, hep-ph/0309075.
- (12) B. Tatischeff et al., Phys. Rev. Lett. 79, 601 (1997).
- (13) B. Tatischeff et al., Eur. Phys. A17, 245 (2003).
- (14) B. Tatischeff et al., Phys. Rev. C72, 034004 (2005);.
- (15) B. Tatischeff et al., Surveys in High Energy Physics, 19, 55 (2004).
- (16) B. Tatischeff, Proceedings of the XVI Intrer. Baldin Sem. on High Energy Physics Problems, Editors A.N. Sissakian, V.V. Burov, and A.I. Malakhov, Dubna 2002, p153.
- (17) L.V. Fil’kov et al., Eur. Phys. J. A 12, 369 (2001).
- (18) Particle Data Group, W.-M. Yao et al., J. Phys. G33, 1 (2006).
- (19) S.Capstick and W.Roberts, Prog. Part. Nucl. Phys.45, 0S241 (2000).
- (20) B. Tatischeff et al., Phys. Rev. C59, 1878 (1999).
- (21) B. Tatischeff and E. Tomasi-Gustafsson, arXiv:nucl-ex/0702005.
- (22) W. Langgrtner et al., Phys. Rev. Lett. 87, 052001 (2001).
- (23) T. Navasardyan et al., Phys. Rev. Lett. 98, 022001 (2007).
- (24) A. Sellem and F. Wilczek, arXiv:hep-ph/0602128 v1, (2006).