Gas and Dust Emission at the Outer Edge of Protoplanetary Disks
Abstract
We investigate the apparent discrepancy between gas and dust outer radii derived from millimeter observations of protoplanetary disks. Using 230 and 345 GHz continuum and CO J=3-2 data from the Submillimeter Array for four nearby disk systems (HD 163296, TW Hydrae, GM Aurigae, and MWC 480), we examine models of circumstellar disk structure and the effects of their treatment of the outer disk edge. We show that for these disks, models described by power laws in surface density and temperature that are truncated at an outer radius are incapable of reproducing both the gas and dust emission simultaneously: the outer radius derived from the dust continuum emission is always significantly smaller than the extent of the molecular gas disk traced by CO emission. However, a simple model motivated by similarity solutions of the time evolution of accretion disks that includes a tapered exponential edge in the surface density distribution (and the same number of free parameters) does much better at reproducing both the gas and dust emission. While this analysis does not rule out the disparate radii implied by the truncated power-law models, a realistic alternative disk model, grounded in the physics of accretion, provides a consistent picture for the extent of both the gas and dust.
Subject headings:
accretion, accretion disks — circumstellar matter — planetary systems: protoplanetary disks — stars: pre-main sequence1. Introduction
Characterizing the gas and dust distribution in the disks around young stars is important for understanding the planet formation process, as these disks provide the reservoirs of raw material for nascent planetary systems. A common method of modeling circumstellar disk structure is to use models described by power laws in surface density and temperature that are truncated at a particular outer radius. This prescription has its historical roots in calculations of the minimum mass solar nebula, which indicated a surface density profile of (e.g. Weidenschilling, 1977), as well as theoretical predictions of a radial power-law dependence of temperature for accreting disks around young stars (Adams & Shu, 1986; Adams et al., 1987). Observationally, the parameterization of temperature and surface density as power-law functions of radius began with early spatially unresolved studies of continuum emission from disks (Beckwith et al., 1990; Beckwith & Sargent, 1991). These models have since been refined and applied to spatially resolved observations of many disks with success (e.g. Mundy et al., 1993; Dutrey et al., 1994; Lay et al., 1994; Dutrey et al., 1998), and they have proven useful for understanding the basic global properties of disk structure. Recently, however, with the advent of high signal-to-noise, multi-frequency observations of gas and dust in protoplanetary disks, these models have begun to encounter difficulties, particularly in the treatment of the outer disk edge.
The extent of the gas and dust distribution in circumstellar disks has implications for our understanding of the planet formation process in our own solar system. There is some evidence for a sharp decrease in the surface density of Kuiper Belt objects beyond a distance of 50 AU from the Sun (Jewitt et al., 1998; Trujillo & Brown, 2001; Petit et al., 2006). However, the origin of this edge is unclear. Adams et al. (2004) note that the observed distance is far interior to the radius at which truncation by photoevaporation would be expected to occur, while Youdin & Shu (2002) find that the presence of such an edge in planetesimal density could be explained by drift-induced enhancement. A compelling possibility is that the Sun formed in a cluster environment, and the early solar disk was truncated by a close encounter with a passing star (see Reipurth, 2005, and references therein). A more complete understanding of the outer regions of protoplanetary disks may provide insight into the processes that shape the outer solar system.
Piétu et al. (2005) present multiwavelength millimeter continuum and CO isotopologue observations of the disk around the Herbig Ae star AB Aurigae and found from fitting models of disk structure described by truncated power laws that the outer radius of the dust derived from continuum emission ( AU) was much smaller than that of the gas derived from 12CO J=2-1 emission ( AU). They suggest that a change in dust grain properties resulting in a drop in opacity could be responsible for the difference, and note the possible association with a ring feature in the disk at 200 AU. A similar result was obtained by Isella et al. (2007) from observations of the disk around the Herbig Ae star HD 163296: they found a significant discrepancy between the outer radius derived for the dust continuum emission ( AU) and that derived from CO emission ( AU). These data appeared to require a sharp drop in surface density, opacity, or dust-to-gas ratio beyond 200 AU; however, as they discuss, there is no obvious physical basis for such a discontinuity. As Isella et al. (2007) demonstrate, the discrepancy in outer radii derived from the dust and gas is not simply an issue of sensitivity; the observations were sufficiently sensitive to detect emission from the power-law dust disk if it did extend to the radius indicated by the CO emission. The underlying issue is that the truncated power law model does not simultaneously reproduce the extent of both the continuum and CO emission for these disks.
Using data from the Submillimeter Array111The Submillimeter Array is a joint project between the Smithsonian Astrophysical Observatory and the Academia Sinica Institute of Astronomy and Astrophysics and is funded by the Smithsonian Institution and the Academia Sinica. we show that the same apparent discrepancy in gas and dust outer radius applies to the circumstellar disks around several more young stars. In an attempt to understand the origin of this discrepancy, we investigate an alternative surface density profile based on work by Hartmann et al. (1998), which is similar to a power law profile in the inner disk but includes a tapered outer edge. We show that this model, which has a physical basis in similarity solutions of disk evolution with time, is capable of simultaneously reproducing both continuum and CO emission from these disks. The primary difference between this model and the truncated power-law disk is that instead of a sharp outer edge the surface density falls off gradually, with sufficient column density at large radii that CO emission extends beyond the point at which dust continuum emission becomes negligible.
2. Millimeter/Submillimeter Dust Continuum and CO J=3-2 Data
The analysis was conducted on extant SMA data of the disks around of HD 163296, TW Hydrae, GM Aurigae, and MWC 480. The dates, frequencies, antenna configurations, number of antennas, and original publications associated with the data sets are listed in Table 1. The four disk systems chosen for this analysis are all nearby, bright, isolated, and have been well studied at a wide range of wavelengths. The velocity fields of these disks all appear to be well described by Keplerian rotation (Isella et al., 2007; Qi et al., 2004; Dutrey et al., 1998; Piétu et al., 2007). The relevant properties of these systems (spectral type, distance, stellar mass, age, and disk inclination and position angle) are listed in Table 2.
| Freq./ | Array | No. of | |||
|---|---|---|---|---|---|
| Transition | Object | Dates | Config. | Antennas | Reference |
| 230 GHz | HD 163296 | 23/24 Aug 2003 | Compact N | 7 | 1 |
| TW Hydrae | 10 Apr 2005 | Extended | 8 | 2 | |
| 27 Feb 2005 | Compact | 8 | 2 | ||
| GM Aurigae | 10 Dec 2006 | Extended | 8 | 3 | |
| MWC 480 | 18/20 Nov 2003 | Compact N | 8 | 1 | |
| 345 GHz/ | HD 163296 | 23 Aug 2005 | Compact | 8 | 4 |
| CO J=3-2 | TW Hydrae | 28 Dec 2006 | Compact N | 8 | 5 |
| GM Aurigae | 26 Nov 2005 | Compact | 7 | 6 | |
| MWC 480 | 21 Oct 2005 | Compact | 8 | 1 |
3. Disk Models
Using the SMA data available for the four disk systems, we compared two classes of disk models: the first model is described by power laws in surface density and temperature and is truncated at an outer radius (details in §3.1), and the second model is described by a power law in temperature and a surface density profile similar to a power law in the inner disk but tapered with an exponential edge in the outer disk (details in §3.2). This latter model is not intended to be a definitive description of these disks, but rather illustrative of the broader category of models without a sharp outer edge. The model fitting process involved deriving a minimum solution for those parameters of each class of model that best fit the continuum emission, and then using standard assumptions to predict CO emission (described in §3.4). The CO emission was not used to determine the model fits, due to the computational intensity of solving the excitation and radiative transfer for the molecular line for a large grid of models.
3.1. Truncated Power Law
For the truncated power law models, we used the prescription of Dutrey et al. (1994). In this framework, the disk structure is described by power laws in temperature and surface density, with the scale height specified through the assumption that the disk is in hydrostatic equilibrium:
| (1) | |||
| (2) | |||
| (3) |
where the subscript ‘100’ refers to the value at 100 AU, is Boltzmann’s constant, is the gravitational constant, is the stellar mass, and is the mass per particle (we assume 2.37 times the mass of the hydrogen atom). Combining these expressions and the assumption of hydrostatic equilibrium, the volume density is given by:
| (4) |
where is the vertical height above the midplane. As noted by Dutrey et al. (2007), this definition implies a scale height of , where is the sound speed and the angular velocity, while other groups use ; this difference should be taken into account when comparing our results with other disk structure models. During the modeling process, we recast the surface density normalization in terms of the midplane density at 100 AU, so that the parameter is replaced by . This power-law model of disk structure has five free parameters: , , , , and .
3.2. Similarity Solution from Accretion Disk Evolution
While versatile and ubiquitous, the truncated power law models of disk structure have one obviously unphysical feature: a sharp outer edge. In the absence of dynamical effects (e.g. from a binary companion) or large pressure gradients to confine the material, disk structure at the outer edge is expected to taper off gradually. A description of the structure of an isolated, steadily accreting disk as it evolves with time is provided by Hartmann et al. (1998), who expand on the work of Lynden-Bell & Pringle (1974) to show that if the viscosity in a disk can be written as a time-independent power law of the form , then the similarity solution for the disk surface density is given by
| (5) |
where C is a constant, is the disk radius in units of the radial scale factor such that , and is the nondimensional time where is the viscous scaling time (eq. 20 in Hartmann et al., 1998). For simplicity, when applying these models to our data we used physical units and absorbed several of the parameters into two constants so that the surface density is of the form
| (6) |
where is the disk radius in AU and , , and are constants that we allowed to vary during the fitting process.
The temperature profile for the similarity solution disk model is identical to that of the truncated power-law disk, except that its spatial extent is infinite. We do not allow it to drop below 10 K, but this low temperature limit is not problematic for any of the disks considered here. This model therefore includes five free parameters: , , , , and . The constant describes the normalization of the surface density, similar to in the power-law model, while the constant is analogous to the outer radius, since it describes the radial scale length over which the exponential taper acts to cause the surface density to drop towards zero.
3.3. Model Comparison
The surface density description for the similarity solution is similar to the truncated power law except at the outer edge of the disk. In the inner regions of the disk for which , we may expand the exponential so that , and the surface density becomes
| (7) |
In the -viscosity context (Shakura & Syunyaev, 1973), for a vertically isothermal disk with the typical temperature index , we would expect that . This implies that for standard assumptions, the inner disk surface density will be described by a power law in with index , modified by a constant () due to the influence of the exponential. If deviates from 1, an additional shallow dependence on would be expected.
It is illuminating to consider the behavior of these models in the Fourier domain, the natural space for interferometer observations. To do so we define the coordinate , the distance from the phase center of the disk in the plane, as it would be observed if the disk were viewed directly face-on. To perform the deprojection from the inclined and rotated sky coordinates, we calculate the position of each point in the plane as a projected distance from the major and minor axes of the disk, respectively: and , where is the disk inclination, , is the polar angle from the major axis of the disk, , and is the position angle measured east of north; then (Lay et al., 1997; Hughes et al., 2007).
In the Fourier domain, the truncated disk models show “ringing” and the visibilities will drop rapidly to zero in the vicinity of . Under the simplifying assumption of , the Fourier transform of the similarity solution becomes a convolution of two functions: (1) , which is just the Fourier transform of the dependence of a power law extending from zero to infinity, and (2) , where is a scaling constant for the term that describes the exponential taper. Since these two functions both decrease monotonically and are always positive, the visibilities drop smoothly to zero without any ringing.
3.4. Model Fitting
For both disk models, we fit for the five parameters describing the disk temperature and surface density structure using the continuum data for each disk with the widest range of available baseline lengths. The position angle and inclination were fixed and adopted from previous studies (see Table 2). For opacity, we assume the standard millimeter value adopted by Beckwith & Sargent (1991) (, where cm2/gdust, =1 THz, and ), although we allow to vary in order to obtain the proper normalization when extrapolating from one frequency to another. Due to the AU spatial resolution, these data are not sensitive to the inner radius of the disk. For both sets of models, therefore, we simply fix the inner radius at a value of 4 AU for TW Hya (Calvet et al., 2002; Hughes et al., 2007), 24 AU for GM Aur (Calvet et al., 2005), and 3 AU for the other two systems, for which reliable inner radius information is not available; this is sufficiently small that changes in the inner radius do not affect the derived model parameters. To compare the models to the data, we use the Monte-Carlo radiative transfer code RATRAN (Hogerheijde & van der Tak, 2000) to calculate sky-projected images of the dust continuum and CO emission, with frequency and bandwidth appropriate for the observations, and assuming Keplerian rotation. We then use the MIRIAD task uvmodel to simulate the SMA observations, with the same antenna positions and visibility weights.
| Spectral | Dist. | Stellar | Age | Disk | Disk | |
|---|---|---|---|---|---|---|
| System | Type | (pc) | Mass (M☉) | (Myr) | PA (∘) | (∘) |
| HD 163296 | A1V | 122a | 2.3a | 5b | 145c | 46c |
| TW Hydrae | K8V | 51d,e | 0.6 | 5-20f,g | -45h | 7h |
| GM Aurigae | K5V | 140 | 0.8i | 2-10j,k | 51i | 56i |
| MWC 480 | A3 | 140m | 1.8n | 7-8n,o | 143p | 37p |
For each set of parameters, we directly compare the model visibilities to the continuum data and calculate a value, using the minimum value to determine the best-fit parameters. The resulting best-fit models are shown along with continuum data for both frequencies in the left panels of Figure 1. The abscissa gives the deprojected radial distance in the plane, and the ordinate shows the real and imaginary components of the visibility. For a disk with circular symmetry, the imaginary components should average to zero. The 230 GHz continuum data are depicted as open circles, while the 345 GHz data are filled circles. The best-fit power-law model is shown in blue and the similarity solution in orange. Dotted and dashed lines distinguish between the 230 and 345 GHz model predictions; the fit was determined at that frequency with the largest baseline coverage and extrapolated to the other frequency, by varying . The uncertainties quoted for reflect an assumed 10% calibration uncertainty. Note that varying has no effect on the modeled CO emission.
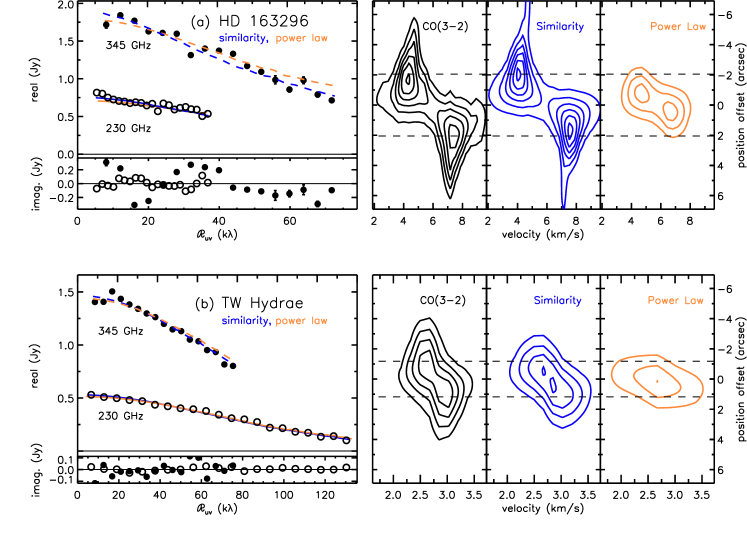
![[Uncaptioned image]](/html/0801.4763/assets/x2.png)
We measure values of that are consistent with 1, which is in agreement with the typical values measured for disks in the Taurus-Auriga association (e.g. Dutrey et al., 1996; Rodmann et al., 2006). These shallow millimeter spectral slopes indicate that some grain growth has occurred from ISM grain sizes, which typically exhibit a steeper spectral slope (). In particular, the value of measured for GM Aur matches well the value of reported by Andrews & Williams (2007), and the value of measured for TW Hydrae matches well the value of 0.7 reported by Calvet et al. (2002) and Natta et al. (2004).
After fitting the continuum, we then assumed a gas/dust mass ratio of 100 and a standard interstellar CO/H2 mass ratio of to predict the expected strength and spatial extent of CO emission from the disks, based on the best-fit continuum model. We assume throughout that the gas and dust are well-mixed, and that CO traces molecular hydrogen. We do not take into account the complexities of disk chemistry, such as the depletion of CO molecules in the cold, dense midplane (Aikawa, 2007; Semenov et al., 2006). However, deviations from these simple assumptions should have no appreciable effect on our conclusions concerning the radial extent of CO emission.
Since we neglect the vertical temperature gradient in the disk, we might expect to underpredict the strength of optically thick CO line emission, which likely originates in the upper layers of the disk that are subject to heating by stellar irradiation. The continuum emission, by contrast, is likely weighted toward the cold midplane of the disk. For this reason, after obtaining an initial fit from the continuum, we allowed the temperature scale () to vary to best reproduce the flux levels of the observed CO emission, and then iteratively fit for the other structural parameters (, , , and ).
Deriving the temperature from the CO emission in this way may underestimate the midplane density in some cases, due to the degeneracy between and : the temperature derived from CO emission is typically greater than or equal to that of the shielded midplane, depending in detail on the dust opacity and molecular dissociation due to ultraviolet radiation in the upper disk layers (for a discussion of the processes involved, see Jonkheid et al., 2007; Isella et al., 2007). For the disks considered, the temperature derived for the dust continuum emission was within % of that derived to match the CO line strength.
4. Results and Discussion
The parameters for the best-fit model solutions to the continuum data for each source and for each of the two model types are listed in Table 3. This table lists only the set of parameters with the minimum value; formal errors are not quoted as these are not intended to be definitive structural models but simply illustrative of the differences between the model classes in their treatment of the outer edge. The midplane surface density profiles for these models are plotted in Figure 2. The solid lines depict the profile for the power-law solution, while the dashed lines are for the similarity solution. The parameters of the two model solutions are very similar, particularly for HD 163296 and MWC 480. For all four disks, the two model solutions are particularly similar just within the outer edge of the disk, around the range of radii well-matched to the resolution of the data ( AU for HD 163296, AU for TW Hydrae, AU for GM Aurigae, and AU for MWC 480). The outer radius for the power-law solution typically falls at roughly twice the scale length () of the similarity solution. The analogous parameters and , which describe how quickly the midplane density drops with radius, are also very similar between the two models.
| (AU) | ||||||||
|---|---|---|---|---|---|---|---|---|
| Source | Model | (K) | a (cm-3) | (AU) | ||||
| HD 163296 | Similarity | 2.29 | 65 | 0.4 | 125 | 0.9 | ||
| Power Law | 2.26 | 60 | 0.5 | 250 | 1.0 | |||
| TW Hydrae | Similarity | 2.42 | 40 | 0.2 | 30 | 0.7 | ||
| Power Law | 2.41 | 30 | 0.5 | 60 | 1.0 | |||
| GM Aurigae | Similarity | 2.19 | 50 | 0.5 | 140 | 0.9 | ||
| Power Law | 2.17 | 40 | 0.4 | 275 | 1.3 | |||
| MWC 480 | Similarity | 1.86 | 50 | 0.8 | 200 | 1.1 | ||
| Power Law | 1.86 | 45 | 0.7 | 275 | 1.3 |

CO J=3-2 emission predicted from these best-fit models is shown in the right panel of Figure 1. The similarity solution is shown in the blue-contoured central plot, and the power-law model in the orange-contoured plot on the right. Recessional velocity is plotted on the abscissa while the position offset along a slice through the disk major axis is plotted on the ordinate. The horizontal dashed line in each figure represents the extent of the outer radius () derived for that source in the context of the truncated power-law model. For all four sources, the extent of molecular gas emission from the similarity solution is much more closely matched to the data than that of the power-law model, even though both reproduce the continuum dust emission equally well.
From Figure 1, it is clear by eye that for all four sources, the extent of the CO emission is severely underpredicted by the power law model but matches well the predicted emission from the similarity solution model. A calculation of the value comparing the predicted CO emission for the two models to the observed emission shows that the similarity solution matches the data better than the truncated power-law model for all of the disks in our study. The difference is at the level for MWC 480, for which there is only short-baseline data with relatively low signal-to-noise, and at the level for GM Aur; for TW Hydrae and HD 163296, the analysis shows that, formally, the similarity solution provides a better fit to the CO emission than the power-law model at the level.
The tapered edge of the similarity solution density distribution evidently permits a large enough column density to produce detectable CO 3-2 line emission, even though it has dropped off enough that the continuum emission is negligible. The power-law model, by contrast, is strictly limited in the extent of its CO emission by the sharp outer radius. In particular, for the case of HD 163296, the CO emission predicted by the power law model (orange contours in the right panel of Figure 1a) falls to 4.4 Jy/beam at a distance of 1.8 arcsec (220 AU) from the source center, while the similarity solution (blue contours) maintains this brightness out to a distance of 4.7 arcsec (570 AU). This latter size is well matched to the data (black contours) which extends at this brightness to a distance of 5.0 arcsec (600 AU). These distances likely overestimate the true physical extent of the disk due to convolution with the arcsec beam, though they are very comparable to the values observed by Isella et al. (2007). While the similarity solution does not provide a perfect fit to the data, nor do we intend it to do so, it illustrates that the outer radius discrepancy is peculiar to the truncated power-law model; other disk structure models with a tapered outer edge may be able to reproduce the gas and dust emission as well as, or better than, the similarity solution adopted here.
Analysis of the CO excitation in the similarity solution model shows that the extent of the CO J=3-2 emission in these disks coincides roughly with the radius at which the line excitation becomes subthermal, determined primarily by where the mid-plane density drops below the critical density ( cm-3 at 20 K, though effectively lowered when photon trapping plays a role). In the similarity solution model, the surface density distribution steepens dramatically at large radii, but without the sharp truncation of the power-law model. This suggests that caution should be exercised not only when comparing outer radius measurements based on dust continuum and molecular gas emission, but also when comparing measurements based on emission from different transitions of CO or from isotopologues of the CO molecule that have differing abundances and optical depths. Piétu et al. (2007) fit truncated power law models to the disks around DM Tau, LkCa 15, and MWC 480 in several different isotopologues and rotational transitions of CO. For the two cases in which multiple transitions of the 13CO molecule were observed, the derived outer radius is marginally smaller for the J=2-1 transition than the J=1-0 transition. This result is consistent with the expected trend that lower-J transitions will exhibit larger outer radii due to their lower critical density: a lower critical density will be reached at a greater distance as the surface density tapers off near the outer edge of the disk. In all cases the Piétu et al. (2007) analysis also yielded a smaller outer radius in 13CO than in 12CO, as well as a flatter surface density power law index for 13CO than for 12CO. These differences may be related to selective photodissociation, or other chemical processes. However, the trends of smaller outer radius and shallower surface density index in 13CO are also consistent with surface density falling off rapidly at large radii, as expected for a disk with a tapered outer edge. In the similarity solution model, the less abundant 13CO isotopologue will become undetectable at smaller radii than 12CO, which is more sensitive to the exponential drop in surface density in the outer disk.
It is noteworthy that studies of six largest “proplyds” with the most distinct silhouettes in the Orion Nebula Cluster reveal radial profiles in extinction that are well-described by an exponential taper at the outer edge (McCaughrean & O’Dell, 1996). These isolated disks may be analogous to the systems considered here with a tapered outer edge.
Models with tapered outer edges also aid in addressing discrepancies between the size of the dust disk observed in the millimeter and the extent of scattered light observed in the optical and near-infrared. For example, coronographic observations of TW Hydrae detect scattered light to a distance of AU from the star (Krist et al., 2000; Trilling et al., 2001; Weinberger et al., 2002), while the truncated power-law model places the outer edge of the dust disk closer to 60 AU. Similarly, observations of HD 163296 by Grady et al. (2000) detect scattered light out to AU from the star, much larger than the 250 AU radius of the dust disk implied by the truncated power-law model. While the exponential taper causes the density of the similarity solution to drop rapidly with radius, these models retain a substantial vertical column density for several exponential scale lengths. It is therefore plausible that scattered light can remain visible at this distance, in contrast to the case of the smaller truncated power-law disk.
Although we intend for the similarity solution applied here to be an illustrative rather than definitive description of the disk structure, it is important to note that the particular form applied here has potential implications for the study of the evolutionary status of these disks. The form of the similarity solution developed by Lynden-Bell & Pringle (1974) and Hartmann et al. (1998) relates the observed structure to the disk age, viscosity, and initial radius. Although all three of these variables are poorly constrained by current observations, a large and homogeneous sample of objects studied in this way might reveal evolutionary trends in the disk structure.
5. Summary and Conclusions
With the advent of high signal-to-noise interferometer observations that resolve the outer regions of nearby protoplanetary disks, an apparent discrepancy has emerged between the extent of the dust continuum and molecular gas emission (Piétu et al., 2005; Isella et al., 2007). Using multi-frequency interferometric data from the Submillimeter Array, we have investigated this disparity for four disk systems (HD 163296, TW Hydrae, GM Aurigae, and MWC 480) in the context of two distinct classes of disk structure models: (1) a truncated power law, and (2) a similarity solution for the time evolution of an accretion disk. The primary difference between these models is in their treatment of the disk outer edge: the abruptly truncated outer edge of the power-law disk causes the visibilities to drop rapidly to zero, leading to an inferred outer radius that is small in comparison with the observed molecular gas emission. The similarity solution, by contrast, tapers off smoothly, creating a broader visibility function and allowing molecular gas emission to persist at radii well beyond the region in the disk where continuum falls below the detection threshold. The outer radius discrepancy appears to exist only in the context of the power-law models.
In light of this result, it appears that an abrupt change in dust properties for these disks is unlikely, as there is no physical mechanism to explain such a discontinuity. This may imply that a sharp change in dust properties in the early solar nebula is similarly an unlikely explanation for the Kuiper belt edge observed by Jewitt et al. (1998), and that a dynamical mechanism such as truncation by a close encounter with a cluster member (Reipurth, 2005, and references therein) may provide a more plausible origin. In this case, we would expect to observe disks with sharp outer edges only in clustered environments, and a model with a tapered edge would be a more realistic prescription for investigating the structure of a typical isolated disk. The tapered disk models provide a natural explanation for the disparate outer radii observed using different probes of the disk extent, including comparison of continuum and molecular gas observations (Piétu et al., 2005; Isella et al., 2007), and also comparison of different isotopologues and rotational transitions of a particular molecule (Piétu et al., 2007). When predicting CO emission, this simple model does neglect potential variance in the CO abundance due to depletion in the midplane and photodissociation at the disk surface; however, the results presented are intended simply to illustrate the global differences between gas and dust emission from the two model classes, independent of detailed CO chemistry.
While we cannot rule out disparate gas and dust radii in these disks, we show that an alternative disk structure model, grounded in the physics of accretion, resolves the apparent size discrepancy without the need to invoke dramatic changes in dust opacity, dust density, or dust-to-gas ratio in the outer disk.
References
- Adams et al. (2004) Adams, F. C., Hollenbach, D., Laughlin, G., & Gorti, U. 2004, ApJ, 611, 360
- Adams et al. (1987) Adams, F. C., Lada, C. J., & Shu, F. H. 1987, ApJ, 312, 788
- Adams & Shu (1986) Adams, F. C. & Shu, F. H. 1986, ApJ, 308, 836
- Aikawa (2007) Aikawa, Y. 2007, ApJ, 656, L93
- Andrews & Williams (2007) Andrews, S. M. & Williams, J. P. 2007, ApJ, 659, 705
- Beckwith & Sargent (1991) Beckwith, S. V. W. & Sargent, A. I. 1991, ApJ, 381, 250
- Beckwith et al. (1990) Beckwith, S. V. W., Sargent, A. I., Chini, R. S., & Guesten, R. 1990, AJ, 99, 924
- Calvet et al. (2002) Calvet, N., D’Alessio, P., Hartmann, L., Wilner, D., Walsh, A., & Sitko, M. 2002, ApJ, 568, 1008
- Calvet et al. (2005) Calvet, N., et al. 2005, ApJ, 630, L185
- Dutrey et al. (1996) Dutrey, A., Guilloteau, S., Duvert, G., Prato, L., Simon, M., Schuster, K., & Menard, F. 1996, A&A, 309, 493
- Dutrey et al. (2007) Dutrey, A., Guilloteau, S., & Ho, P. 2007, in Protostars and Planets V, ed. B. Reipurth, D. Jewitt, & K. Keil, 495–506
- Dutrey et al. (1998) Dutrey, A., Guilloteau, S., Prato, L., Simon, M., Duvert, G., Schuster, K., & Menard, F. 1998, A&A, 338, L63
- Dutrey et al. (1994) Dutrey, A., Guilloteau, S., & Simon, M. 1994, A&A, 286, 149
- Grady et al. (2000) Grady, C. A., et al. 2000, ApJ, 544, 895
- Hamidouche et al. (2006) Hamidouche, M., Looney, L. W., & Mundy, L. G. 2006, ApJ, 651, 321
- Hartmann et al. (1998) Hartmann, L., Calvet, N., Gullbring, E., & D’Alessio, P. 1998, ApJ, 495, 385
- Hoff et al. (1998) Hoff, W., Henning, T., & Pfau, W. 1998, A&A, 336, 242
- Hogerheijde & van der Tak (2000) Hogerheijde, M. R. & van der Tak, F. F. S. 2000, A&A, 362, 697
- Hughes et al. (2007) Hughes, A. M., Wilner, D. J., Calvet, N., D’Alessio, P., Claussen, M. J., & Hogerheijde, M. R. 2007, ApJ, 664, 536
- Isella et al. (2007) Isella, A., Testi, L., Natta, A., Neri, R., Wilner, D., & Qi, C. 2007, A&A, 469, 213
- Jewitt et al. (1998) Jewitt, D., Luu, J., & Trujillo, C. 1998, AJ, 115, 2125
- Jonkheid et al. (2007) Jonkheid, B., Dullemond, C. P., Hogerheijde, M. R., & van Dishoeck, E. F. 2007, A&A, 463, 203
- Kastner et al. (1997) Kastner, J. H., Zuckerman, B., Weintraub, D. A., & Forveille, T. 1997, Science, 277, 67
- Krist et al. (2000) Krist, J. E., Stapelfeldt, K. R., Ménard, F., Padgett, D. L., & Burrows, C. J. 2000, ApJ, 538, 793
- Lay et al. (1997) Lay, O. P., Carlstrom, J. E., & Hills, R. E. 1997, ApJ, 489, 917
- Lay et al. (1994) Lay, O. P., Carlstrom, J. E., Hills, R. E., & Phillips, T. G. 1994, ApJ, 434, L75
- Lynden-Bell & Pringle (1974) Lynden-Bell, D. & Pringle, J. E. 1974, MNRAS, 168, 603
- Mamajek (2005) Mamajek, E. E. 2005, ApJ, 634, 1385
- McCaughrean & O’Dell (1996) McCaughrean, M. J. & O’Dell, C. R. 1996, AJ, 111, 1977
- Mundy et al. (1993) Mundy, L. G., McMullin, J. P., Grossman, A. W., & Sandell, G. 1993, Icarus, 106, 11
- Natta et al. (2004) Natta, A., Testi, L., Neri, R., Shepherd, D. S., & Wilner, D. J. 2004, A&A, 416, 179
- Petit et al. (2006) Petit, J.-M., Holman, M. J., Gladman, B. J., Kavelaars, J. J., Scholl, H., & Loredo, T. J. 2006, MNRAS, 365, 429
- Piétu et al. (2007) Piétu, V., Dutrey, A., & Guilloteau, S. 2007, A&A, 467, 163
- Piétu et al. (2005) Piétu, V., Guilloteau, S., & Dutrey, A. 2005, A&A, 443, 945
- Qi et al. (2004) Qi, C., et al. 2004, ApJ, 616, L11
- Qi et al. (2006) Qi, C., Wilner, D. J., Calvet, N., Bourke, T. L., Blake, G. A., Hogerheijde, M. R., Ho, P. T. P., & Bergin, E. 2006, ApJ, 636, L157
- Reipurth (2005) Reipurth, B. 2005, in Astronomical Society of the Pacific Conference Series, Vol. 341, Chondrites and the Protoplanetary Disk, ed. A. N. Krot, E. R. D. Scott, & B. Reipurth, 54–+
- Rodmann et al. (2006) Rodmann, J., Henning, T., Chandler, C. J., Mundy, L. G., & Wilner, D. J. 2006, A&A, 446, 211
- Semenov et al. (2006) Semenov, D., Wiebe, D., & Henning, T. 2006, ApJ, 647, L57
- Shakura & Syunyaev (1973) Shakura, N. I. & Syunyaev, R. A. 1973, A&A, 24, 337
- Simon et al. (2000) Simon, M., Dutrey, A., & Guilloteau, S. 2000, ApJ, 545, 1034
- Simon & Prato (1995) Simon, M. & Prato, L. 1995, ApJ, 450, 824
- The et al. (1994) The, P. S., de Winter, D., & Perez, M. R. 1994, A&AS, 104, 315
- Trilling et al. (2001) Trilling, D. E., Koerner, D. W., Barnes, J. W., Ftaclas, C., & Brown, R. H. 2001, ApJ, 552, L151
- Trujillo & Brown (2001) Trujillo, C. A. & Brown, M. E. 2001, ApJ, 554, L95
- van den Ancker et al. (1998) van den Ancker, M. E., de Winter, D., & Tjin A Djie, H. R. E. 1998, A&A, 330, 145
- Webb et al. (1999) Webb, R. A., Zuckerman, B., Platais, I., Patience, J., White, R. J., Schwartz, M. J., & McCarthy, C. 1999, ApJ, 512, L63
- Weidenschilling (1977) Weidenschilling, S. J. 1977, Ap&SS, 51, 153
- Weinberger et al. (2002) Weinberger, A. J., et al. 2002, ApJ, 566, 409
- Youdin & Shu (2002) Youdin, A. N. & Shu, F. H. 2002, ApJ, 580, 494