THE PERSISTENCE OF MEMORY, OR HOW THE X-RAY SPECTRUM OF SNR 050967.5 REVEALS THE BRIGHTNESS OF ITS PARENT TYPE Ia SUPERNOVA
Abstract
We examine the dynamics and X-ray spectrum of the young Type Ia supernova remnant 050967.5 in the context of the recent results obtained from the optical spectroscopy of its light echo. Our goal is to estimate the kinetic energy of the supernova explosion using Chandra and XMM-Newton observations of the supernova remnant, thus placing the birth event of 050967.5 in the sequence of dim to bright Type Ia supernovae. We base our analysis on a standard grid of one-dimensional delayed detonation explosion models, together with hydrodynamic and X-ray spectral calculations of the supernova remnant evolution. From the remnant dynamics and the properties of the O, Si, S, and Fe emission in its X-ray spectrum we conclude that 050967.5 was originated years ago by a bright, highly energetic Type Ia explosion similar to SN 1991T. Our best model has a kinetic energy of erg and synthesizes of 56Ni. These results are in excellent agreement with the age estimate and spectroscopy from the light echo. We have thus established the first connection between a Type Ia supernova and its supernova remnant based on a detailed quantitative analysis of both objects.
Subject headings:
ISM: individual (SNR 050967.5) — nuclear reactions, nucleosynthesis, abundances — supernovae: general — hydrodynamics — supernova remnants — X-rays:ISM1. INTRODUCTION
Astronomical observations can probe the material ejected by supernova (SN) explosions during two transient phases with very different time scales. The initial optical transient (the SN itself) lasts for several months, and the ejecta structure can be studied through the emission and absorption lines produced as the photosphere recedes into the exploded star. After the SN fades away, the ejected material starts to interact with its surroundings, and the supernova remnant (SNR) phase begins. In this phase, the ejecta structure is revealed by the X-ray emission of the material heated by the reverse shock on timescales of hundreds or thousands of years. Both approaches are valid in principle, but up to now the disparity of the timescales involved has made it impossible to verify their mutual consistency by applying them to the same object.
The serendipitous discovery of light echoes associated with the young SNRs 050967.5, 051969.0, and N103B in the Large Magellanic Cloud (LMC) by Rest et al. (2005) (henceforth R05) has opened new possibilities for establishing connections between SNRs and their parent SNe. In particular, spectroscopy of the light echoes has the potential to confirm the type of the SN explosion in a straightforward way, avoiding the difficulties inherent to typing SNRs from their X-ray spectra (for an in-depth discussion of these difficulties, see Rakowski et al. 2006). In a recent paper, Rest et al. (2007) (henceforth R07) examined the light echo associated with SNR 050967.5, and established that this object originated in a Type Ia explosion, in agreement with the longstanding claims based on X-ray observations (Hughes et al. 1995; Warren & Hughes 2004, henceforth WH04). Furthermore, the quality of the light echo was such that it allowed for a meaningful comparison with the spectra of a variety of Type Ia SNe. Based on these comparisons, R07 concluded that the parent event of SNR 050967.5 belonged to the group of overluminous, highly energetic Type Ia SNe whose prototype is SN 1991T (Benetti et al. 2005).
These results offer an excellent opportunity to revisit the X-ray spectrum of SNR 050967.5. Recent developments in modeling the thermal emission in young Type Ia SNRs using hydrodynamic calculations and nonequilibrium ionization simulations (HD+NEI models, Badenes et al. 2003, 2005a) have led to a better understanding of the relationship between the structure of SN ejecta and the X-ray spectra of SNRs. By applying HD+NEI models to the Tycho SNR, Badenes et al. (2006) were able to estimate the kinetic energy and nucleosynthetic yields of the explosion. We can now do the same for 050967.5, comparing the results of the HD+NEI models with the light echo spectroscopy. In particular, we want to examine to what extent is it possible to determine the brightness of a Type Ia SN by studying the X-ray emission from its SNR hundreds of years after the explosion.
This paper is organized as follows. In § 2, we begin with a brief overview of delayed detonation models. In § 3, we use these explosion models, together with the forward shock radius and velocity to constrain the dynamics of SNR 050967.5. In § 4, we review the Chandra and XMM-Newton observations of 050967.5, and we calculate the values for the most relevant line centroids and line flux ratios. In § 5 we describe the HD+NEI models, and we evaluate them against both the dynamic and spectral constraints posed by the observations of 050967.5. Finally, we discuss our results and present our conclusions in § 6.
2. OVERVIEW OF DELAYED DETONATION MODELS
Since they were first introduced by Khokhlov (1991), delayed detonations (DDTs) have become the most successful models for Type Ia SNe. In this kind of explosion, the burning front starts propagating as a subsonic flame (deflagration) in the central regions of a C+O white dwarf (WD) close to the Chandrasekhar mass, and then a transition to a supersonic regime (detonation) is artificially induced, usually at a prescribed density . The resulting ejecta structure is characterized by an approximately exponential density profile, with a composition dominated by Fe-peak nuclei in the center, surrounded by a shell rich in intermediate mass elements (IMEs: Si, S, Ar, Ca, etc.), and a thinner outer region dominated by O. Minor traces of C might remain at large radii, but most of the WD is burnt in the explosion. Spherically symmetric DDT models are able to explain the fundamental properties of Type Ia SNe, including light curve shapes (Höflich & Khokhlov 1996), optical and IR spectral evolution (Wheeler et al. 1998; Baron et al. 2006; Marion et al. 2006; Gerardy et al. 2007), and spectropolarimetric observations (Wang et al. 2007).

The deflagration-to-detonation transition density is the most important parameter in DDT explosions. Models with higher values of are more energetic, and synthesize more Fe-peak elements, less IMEs, and less O than models with low values of . Since Type Ia light curves are powered by the radioactive decay of 56Ni, more energetic models lead to more luminous SNe (Stritzinger et al. 2006). The luminosity of Type Ia SNe is also tightly correlated to the light curve width (Phillips 1993), although the physical processes connecting this parameter and the mass of 56Ni synthesized in the explosion are not as simple as was initially thought (see Kasen & Woosley 2007; Woosley et al. 2007). In any case, the relationship between Type Ia SN luminosity (or light curve width) and the chemical structure of SN ejecta has now been firmly established by Mazzali et al. (2007), and is consistent with the predictions of one-dimensional DDT models.
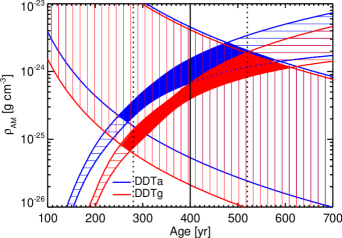
The fundamental properties of the grid of DDT models that we will use in the present work are plotted in Figure 1, which can be compared to the ‘Zorro’ diagram in Mazzali et al. (2007). Models DDTa, DDTc, and DDTe are taken from Badenes et al. (2003, 2005a); model DDTg has been calculated with the same code (see Bravo et al. 1996; Badenes et al. 2003), and extends the grid to lower values of . The total masses of 56Ni synthesized in the models are (DDTa), (DDTc), (DDTe), (DDTg). To put these values in context, the estimated 56Ni masses in the 20 objects considered ‘normal’ by Mazzali et al. (2007) range between (for SN 1991T) and (for SN 1991M). A theoretical upper limit to the mass of radioactive Ni that can be obtained from the thermonuclear burning of a Chandrasekhar C+O WD is set by the prompt detonation model DET in Badenes et al. (2003), which yields of 56Ni with erg.
3. SNR DYNAMICS
The dynamics of 050967.5 are constrained by two pieces of observational evidence. The first is the angular radius measured by Chandra (, see Table 3 in Badenes et al. 2007), which translates into a linear radius of cm ( pc) at the known distance to the LMC (50 kpc, Alves 2004). This measurement can be considered very accurate, because the errors on both angular radius and distance are extremely small (at the few percent level). The second observable is the forward shock (FS) velocity inferred by modeling the broad component of the Ly emission line, (Ghavamian et al. 2007). Being a less direct measurement, the FS velocity is more subject to uncertainty than the FS radius, so this value should be considered with some measure of caution (see discussion in § 5.1 of Badenes et al. 2007). To reproduce the dynamics of 050967.5, we have used a one-dimensional hydrodynamic code to simulate the interaction between the ejecta density profiles from the DDT explosion models in our grid and a uniform ambient medium (AM; for more details on the models and a justification of the uniform AM hypothesis, see Badenes et al. 2007). A successful SNR model must be able to match both FS radius and velocity for a reasonable combination of age and AM density .
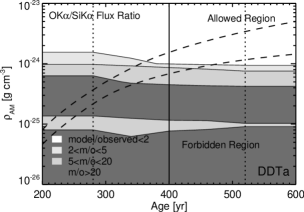
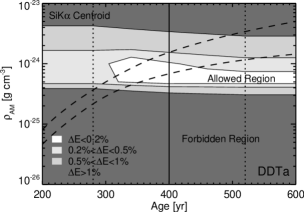
The comparison between hydrodynamic models and observations, however, is not completely straightforward, because our simulations do not include the effect of cosmic ray (CR) acceleration. This physical process can strongly modify the dynamics of the SNR, slowing down the FS and reducing the gap between FS and contact discontinuity (CD) by an amount that depends on the acceleration efficiency (Ellison et al. 2004). Indeed, WH04 found evidence for a significant nonthermal component in the X-ray spectrum of 050967.5 and argued that CR acceleration was taking place at the FS. Although the presence of nonthermal emission does not necessarily imply that the dynamics are CR-modified, we consider this to be a likely possibility. It is important to note that CR acceleration at the FS does not have an impact on the dynamics of the shocked ejecta, and in particular, it does not affect the position of the CD (at least to first order, see Fig. 2 in Ellison et al. 2007). This means that the CR-modified SNR radius must lie between the FS radius and the CD radius in hydrodynamic models without CR acceleration. For one-dimensional models, it is necessary to allow for the fact that Rayleigh-Taylor instabilities at the CD increase the projected radius by (Wang & Chevalier 2001). Likewise, the CR-modified FS velocity must lie between the FS velocity and the CD velocity . We have summarized these constraints in Figure 2 for the most and least energetic models in our DDT grid, DDTa and DDTg. The DDT models require that the SNR age be between 250 and 610 yr to reproduce the FS dynamics, in very good agreement with the completely independent yr estimate from the light echoes (R05). The allowed values of lie between and , with more energetic models demanding higher AM densities. The FS radius provides the strongest dynamical constraints, imposing a tight correlation between and age that we shall revisit in § 5.3.
4. X-RAY OBSERVATIONS
4.1. Chandra and XMM-Newton Data Sets
SNR 050967.5 has been observed by the CCD cameras on both Chandra and XMM-Newton. The most detailed study of its X-ray emission to date was presented by WH04, who analyzed a Chandra ACIS-S data set taken on 2000 May 12-13 (ObsID 776, PI J.Hughes). The net exposure time was 47.9 ks, and the image was taken on the back-illuminated S3 chip. The authors found that the X-ray spectrum is dominated by line emission from the SN ejecta, with a small continuum contribution, probably nonthermal emission from the FS. The centroid of the Si K line blend indicates an unusually low (below He-like) ionization state for the plasma. The abundances obtained from plane-parallel shock fits favor a Type Ia origin, in agreement with the previous qualitative analysis of Hughes et al. (1995). These abundances were compared to the yields of two type Ia SN explosion models from Iwamoto et al. (1999), a ‘fast deflagration’ and a DDT, with the fitted values showing some preference for the DDT model, albeit with gross discrepancies in the Fe abundance that were noted by the authors. This might be due to the simplicity of the plane shock models used by WH04, but the poor statistics of the Fe K blend in the Chandra ACIS-S data set also make it difficult to constrain the properties of shocked Fe in 050967.5.
For the present work, we have recalibrated the Chandra ACIS-S data using the latest versions of CIAO (3.4) and CALDB (3.4.0), which yielded 48.5 ks of useful exposure. To complement the Chandra data set, we have also reduced and analyzed the XMM-Newton observation taken on 2000 July 4 (ObsID 0111130201, PI M.Watson). The instrument modes in this observation were small window for EPIC-MOS1 (frame time: 300 ms), large window for EPIC-MOS2 (900 ms) and EPIC-pn (48 ms). The medium filter was used. We reduced the data using the latest SAS version (7.1.0) and calibration files. We applied the flare rejection procedure described in Cassam-Chenaï et al. (2004), which left a total exposure of 32.6 ks for all cameras. To create spectra, we selected single and double events (pattern ) for the EPIC-pn camera, which greatly improved the statistics in the Fe K line. The spectra were then rebinned to achieve a signal-to-noise ratio .
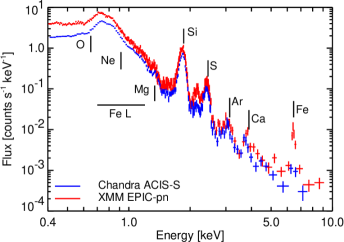
A preliminary inspection of the calibrated and reduced spectra reveals that the centroids of the brightest lines in the EPIC-MOS cameras appear shifted towards high energies compared to both EPIC-pn and Chandra ACIS-S. The Si K centroid values obtained with the different CCD instruments, with standard confidence intervals, are keV (EPIC-MOS1), keV (EPIC-MOS2), keV (EPIC-pn), and keV (ACIS-S). The overlap between the ACIS-S and EPIC-pn values is important, because the energy scale of the Chandra ACIS-S data set was verified using on-board calibration sources (see § 2 in WH04). Furthermore, EPIC-pn has a substantially larger effective area at the Fe K line than EPIC-MOS. In view of this, we have chosen to maximize the consistency of our data sets by not including the EPIC-MOS spectra in our analysis. The spatially integrated Chandra ACIS-S and XMM-Newton EPIC-pn spectra are plotted in Fig. 3.
4.2. Spectral Fits to the Line Emission
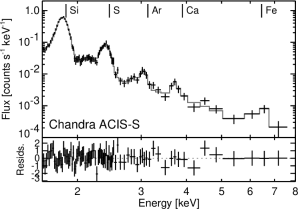
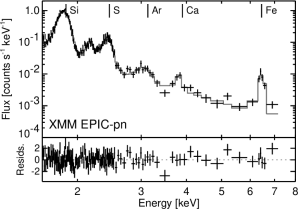
We have fitted the Chandra ACIS-S and XMM-Newton EPIC-pn data between 1.6 and 8.0 keV with a spectral model consisting of a power law continuum and 16 Gaussian lines, including K-shell transitions from principal quantum level (K blends) for Si, S, Ar, Ca, and Fe; K-shell transitions from (K, K, and K) for Si, S, and Ar, and the Ly lines for the H-like ions of Si and S. Only the centroids and fluxes of the K blends and the Si K line have been fitted. The centroids of the other K lines and all the K, K, and Ly lines have been kept fixed at the nominal energies for He-like ions. The fluxes of the K and K lines have been tied to the respective K lines taking the ratios at K from the ATOMDB data base (Smith et al. 2001). The resulting fits are shown on Figure 4 and the fitted parameters are listed in Table 1.
Outside the energy range of the fits, we have calculated a conservative upper limit to the O K flux by assuming that all the photons between 0.55 and 0.58 keV come from this blend, with interstellar absorption set at the maximum value found by WH04, . We note that the presence of O was necessary in the plane shock fits performed by WH04, and that O lines are clearly seen in the grating observations (Hughes et al. in preparation), but for this element it is especially hard to disentangle the ejecta contribution from the shocked AM contribution (if any). Thus, we settle for the conservative upper limits listed in Table 1 to constrain our ejecta models. We have also calculated the flux in the broad band from 0.8 keV to 1.2 keV, which is dominated by L-shell lines from Fe, with some contribution from K-shell Ne lines, assuming a nominal value of . The principal line flux ratios normalized with respect to Si K are listed in Table 2.


| Chandra | XMM-Newton | |
|---|---|---|
| Parameter | ACIS-S | EPIC-pn |
| Power Law Continuum | ||
| Norm. | ||
| Line Fluxes | ||
| O K aaUpper limit to the flux in the O K blend (0.55-0.58 keV) assuming | ||
| Fe L bbFlux in the 0.8-1.2 keV band assuming , including unresolved contributions from Ne K and other lines. | ||
| Si K | ||
| Si K | ||
| S K | ||
| Ar K | ||
| Ca K | ||
| Fe K | ||
| Line Centroids (keV) | ||
| Si K | ||
| Si K | ||
| S K | ||
| Ar K | ||
| Ca K | ||
| Fe K | ||
| Goodness-of-Fit | ||
| /dof | ||
Note. — The limits given are the formal confidence ranges .
| Chandra | XMM-Newton | |
|---|---|---|
| Line Ratio | ACIS-S | EPIC-pn |
| O K/Si K | ||
| Fe L/Si K | ||
| Si K/Si K | ||
| S K/Si K | ||
| Ar K/Si K | ||
| Ca K/Si K | ||
| Fe K/Si K |
Note. — For simplicity, symmetric confidence ranges have been calculated taking the largest deviations from the fitted values in each case.
The values listed in Tables 1 and 2 merit a few comments. All the line centroids and line flux ratios, as well as the power law indices and normalizations, are consistent in both data sets within the statistical uncertainties. However, some puzzling differences between the Chandra ACIS-S and the XMM-Newton EPIC-pn spectra can be appreciated both in the Tables and in Figures 3 and 4. The fluxes of the three brightest lines are statistically inconsistent, with deviations of for Si K, for S K, and a very significant for Si K. The upper limits for the O K emission and the fluxes in the broad Fe L band also show disagreements of and . Some of these differences are larger than the cross-calibration uncertainty between Chandra and XMM-Newton, which is in normalisation between 0.8 and 2 keV (M.Stuhlinger et al., document XMM-SOC-CAL-TN-0052, Issue 3.0, January 2006). The discrepancies certainly deserve some further investigation, but they are of no consequence for the scientific objectives of this paper, for two reasons that will become clear along § 5. First, we only model parameters that are consistent in both data sets. And second, the tolerance ranges that we use to compare models and data are much larger than the differences between ACIS-S and EPIC-pn that we have discussed here, and could easily accomodate the EPIC-MOS data sets as well.
5. SPECTRAL MODELING
5.1. Method, Parameters, and Strategy
To compare our grid of DDT models to the observations of SNR 050967.5, we have generated synthetic X-ray spectra for the shocked ejecta emission in our hydrodynamic simulations following the methods presented in Badenes et al. (2003, 2005a), with updated atomic data (Badenes et al. 2006), and including radiative and ionization losses with an isobaric approximation as described in Badenes et al. (2007). For a given Type Ia SN explosion model, the synthetic spectra are controlled by three variables only: AM density , SNR age , and . The parameter represents the amount of collisionless electron heating at the reverse shock, and is defined as the ratio of specific internal energies in electrons and ions at the shock transition. It can take values between , which represents mass proportional heating, and 1, which represents full equilibration (for more details, see § 2.2 in Badenes et al. 2005a). We have performed simulations in a grid of seven values (, , , , , , and ) and three values (, 0.01, and 0.1). A similar, less extended grid of synthetic X-ray spectra based on DDT models was presented and discussed in Badenes et al. (2005b).
The ability of our synthetic spectra to reproduce SNR observations is limited by the quality of the atomic data in the spectral code. In the particular case of 050967.5, several important issues arise due to the low ionization state of the plasma. At ionization states below He-like, the atomic data for the K blends of the major elements are reasonably complete, but deficiencies in K-shell transitions from higher levels should be expected in all elements. Atomic data in the Fe L complex are notably deficient, and altogether absent for ionization stages below Fe+16 (Ne-like Fe). The strongest Fe L line in the Chandra HETG spectrum (at keV) can be associated with Ne-like Fe, and there are no signs of a significant contribution from lower ionization stages (Hughes et al., in preparation). Nevertheless, Fe L emission in the synthetic spectra should always be considered with caution as a matter of principle.
Given the limitations of the synthetic spectra listed above and the issues with the X-ray data described in § 4.2, we have chosen to focus our efforts on modeling only fundamental quantities for which we can trust both models and observations. These include the centroids of the three brightest line blends (Si K, S K, and Fe K), and the O K/Si K, Fe L/Si K and Fe K/Si K line flux ratios, noting again that special care must be taken in the case of the Fe L/Si K ratio. As we shall see, the combination of these parameters can constrain the kinetic energy of the SN explosion in the framework of the DDT models quite well. We will begin by using the DDT models at the nominal age of 400 yr in § 5.2, and then discuss variations of age in § 5.3 and alternative models in § 5.4. In § 5.5 we will go beyond our selection of diagnostic parameters to evaluate the performance of the models across the entire spectral range of XMM-Newton.
5.2. DDT Models at Nominal Age (t=400 yr)
A comparison between the observed line flux ratios and centroids and the predictions of the synthetic spectra generated by the DDT models in our grid at yr is presented in Figure 5. In these plots, the observed values (vertical solid lines) are the averages of the Chandra ACIS-S and XMM-Newton EPIC-pn values, except in the case of the Fe K line, where only the XMM-Newton EPIC-pn data are taken into account. We note that the largest difference between ACIS-S and EPIC-pn in the relevant parameters corresponds to the the Fe L/Si K ratio, and is only . Tolerance ranges around the observed values are highlighted with striped regions: a factor 2 above and below for line flux ratios (except for the O K/Si K ratio, where only the upper limit is constrained), for the Si K and S K centroids, and for the Fe K centroid. These tolerance ranges are rather large, mostly because of systematic uncertainties that are very hard to quantify (see § 5.2 in Badenes et al. 2006, for a discussion), and will only be used to provide some guidance in the comparisons between models and data. For each DDT model, the values of that satisfy the dynamical constraints from § 3 at yr are indicated by horizontal dotted lines.
The combination of the O K/Si K and Fe K/Si K flux ratios clearly favors models with low O and high Fe emission. Only the DDT models with higher kinetic energies (and hence high Fe and low O yields), DDTa and DDTc, can reproduce both observables at the same time. When the dynamical constraints are brought into play, model DDTa (for and between 0.01 and 0.1) performs better than model DDTc, because of its lower O K flux. The Fe L/Si K ratio also favors model DDTa over DDTc, although we stress that comparisons based on this parameter must be of a qualitative sort. The high Fe L/Si K values found at low in models DDTc, DDTe and DDTg, for instance, are due mostly to Ne K emission, not to L-shell lines from shocked Fe. The line centroids plotted in the right hand panels of Figure 5 support the choice of model DDTa, but we note that the Fe K centroid is slightly underpredicted at the imposed by the dynamical constraints.
The interplay between the constraints from the different line flux ratios with varying can be seen more clearly in Figure 6, where the sequence of DDT models has been mapped onto an axis. The O K/Si K ratio can be reproduced by any model, provided that is high enough to ionize most O beyond the He-like stage at yr. On the other hand, the Fe K/Si K ratio can only be reproduced by models with high , where enough Fe has been shocked at yr. These two flux ratios, together with the dynamical constraints clearly single out model DDTa with . The Fe L/Si K ratio confirms the choice, but we note again that the allowed region at low for this parameter is spurious. This plot highlights the remarkable agreement between the dynamical and X-ray spectral constraints on for the energetic DDT models, specially considering the large dynamic range of the diagnostic quantities shown in Figure 5. This is not a trivial coincidence, and it is not observed in other explosion models, as we shall see in 5.4. It indicates that the fundamental properties of the DDT models (exponential density profile, stratified ejecta) are well suited for SNR 050967.5.

5.3. DDT Models at Different Ages
The uncertainties in the age estimate from R05 ( yr around the nominal age of 400 yr) stem from the unknown three-dimensional structure of the dust that is reflecting the light echo. The SNR dynamics are consistent with this range, but they impose a tight correlation between and , as shown in § 3. Now we shall see that the properties of the X-ray emission from 050967.5 can substantially narrow down the age estimate, making large deviations from yr seem unlikely. Higher ages require higher values of in order to reproduce the FS radius, and vice versa (see Figure 2). These changes in lead to major differences in the ionization timescale of the shocked ejecta, which rapidly drive several spectral parameters out of agreement with the observations. Two examples are presented in Figure 7, where the O K/Si K flux ratio and the centroid of the Si K blend are compared with the observed values across the (, ) parameter space for model DDTa. At ages below 400 yr, most of the O is in the He-like ionization stage for the values imposed by the FS radius. This makes the O K emission too strong, with O K/Si K ratios in excess of 5 times the observed value. Above 400 yr, the O K/Si K ratio is in the allowed region, but then the He-like ion of Si becomes dominant in the plasma, pushing the centroid toward higher energies that are incompatible with the value measured by Chandra and XMM-Newton. These comparisons are less favorable for the other DDT models, because their higher O content and lower tend to increase the disagreement between the dynamical and spectral constraints.
One last constraint on the age of 050967.5 comes from the lack of recorded historical evidence for a recent SN in the LMC. A normal to bright Type Ia SN at a distance of 50 kpc would remain visible for several months, with an apparent visual magnitude around 1.0 at maximum light (the average extinction towards the LMC is 0.3 mag, Imara & Blitz 2007). Such an event would be hard to miss by even the most inattentive observers. European exploration of the southern hemisphere was well under way 400 years ago, led by skilled navigators who relied heavily on astronomy and monitored the night sky whenever possible. Pieter Dirkszoon Keyser and Frederik de Houtman mapped the southern sky (including Mensa and Doradus, which encompass the LMC) from Java between 1595 and 1597, noting the positions of all the stars brighter than 5th magnitude. In this island, the Dutch colony of Batavia (present day Jakarta, at S latitude) and the English colony of Bantam became permanent around 1600. In South America, several Spanish settlements were thriving decades before that, including Lima (founded 1535, S) and Buenos Aires (permanent since 1580, S), from which the LMC is circumpolar. Even allowing for some incompleteness in the historical records, a spectacular astronomical event like a bright LMC supernova should have left some kind of trace if it happened at any time later than the beginning of the 17th century.
Taken together, the light echoes from the SN, the dynamic and spectral properties of the SNR, and the historical considerations, suggest an age very close to yr for the birth event of 050967.5. The uncertainty around this value is hard to quantify, but deviations larger than a few decades seem unlikely, specially towards younger ages.
5.4. Other Models
We have seen that one-dimensional DDT models can reproduce the fundamental properties of the ejecta emission in 050967.5 with remarkable accuracy. It is outside the scope of this paper to perform an exhaustive exploration of other Type Ia explosion paradigms like Badenes et al. (2006) did for the Tycho SNR, but for the sake of completeness we discuss here some results obtained using other models. In Figure 8 we present the line flux ratios at yr predicted by a sub-Chandrasekhar explosion (model SCH from Badenes et al. 2003) and a well-mixed 3D deflagration (model b30_3d_768 from Travaglio et al. 2004). In each case, we have overlaid the dynamical constraints on obtained with the procedure explained in § 3. The sub-Chandrasekhar model clearly shows that the overlap between spectral and dynamical constraints found in the energetic DDT models is not trivial, and indeed does not happen for the ejecta structure of this edge-lit WD detonation. The well-mixed 3D deflagration model has more severe problems: the presence of Fe and O everywhere in the ejecta leads to a systematic overprediction of the O K/Si K and Fe L/Si K flux ratios at all values of .

5.5. Spatially Integrated Spectra
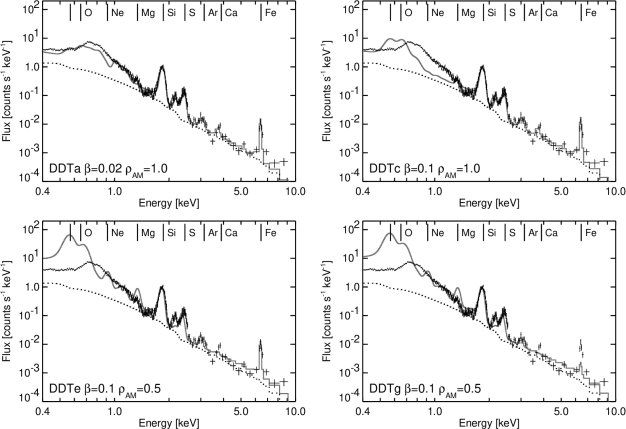
In the previous Sections we have taken the approach of focusing on a few parameters that can be both reliably extracted from the observations and confidently modeled with the existing spectral codes. This is a more meaningful and robust way of comparing synthetic spectra generated with HD+NEI models to data than the conventional method of fitting across the entire X-ray band (for discussions, see Badenes et al. 2005a, 2006). Nevertheless, it is always instructive to study the performance of the spectral models from a more global point of view. In Figure 9, we plot the synthetic spectra of the DDT models at yr for the best value of within the dynamical constraints, together with the XMM-Newton EPIC-pn data set. In each model, the value of has been chosen to give the best approximation to the Fe K/Si K flux ratio: for model DDTa and for models DDTc, DDTe, and DDTg. No spectral fitting of any kind has been done. Instead, the ejecta models have been normalized to match the Si K line and then a power law with the parameters determined in § 4.2 (, ) has been added for the continuum. Absorption has been set to the fiducial in all cases. By foregoing any spectral fitting, we can more easily compare the properties of the ejecta models to the data and to each other.
The performance of our model of choice, DDTa (, ) is very good at all energies, albeit with some problems in localized areas. The flux in the Fe L complex is somewhat low, and the shape shows deviations from the observed spectrum. These discrepancies might be due mostly to the limitations in the atomic data discussed in § 5.1. Other problems are probably related to the explosion model, such as the deficit in the Mg K flux and the low centroid of the Ca K blend111The same two issues were noted by Badenes et al. (2006) in comparisons between the synthetic spectrum from model DDTc ( yr, , ) and the X-ray emission from the Tycho SNR. This suggests that the Mg content in our DDT models might be underestimated, and the distribution of Ca in the ejecta might be biased towards low densities.. The degradation of the synthetic spectra along the sequence of DDT models with decreasing (or ) is plain to see in Figure 9, specially in the behavior of the Fe and O emission. Normalization distances can be calculated for each model, yielding 36 kpc (DDTa), 51 kpc (DDTc), 23 kpc (DDTe), and 29 kpc (DDTg). Given the coarseness of our grid, values within of the distance to the LMC can be considered satisfactory. A more accurate study of the normalization distances cannot be justified without the inclusion of multidimensional effects in the HD+NEI simulations (see § 8.1 in Badenes et al. 2006).
We conclude this Section with a brief mention of the continuum emission. Detailed modeling of this component of the X-ray spectrum is outside the scope of the present work, but our HD+NEI calculations can help clarify the issue of its origin raised by WH04. At high energies ( keV), the flux of the thermal AM emission in our HD+NEI models (for and yr at a distance of 50 kpc) is a factor 6 below the power law models listed in Table 1. This is a strong indication that the origin of the continuum emission in 050967.5 is indeed nonthermal.
6. DISCUSSION AND CONCLUSIONS
The light echo observations of R05 and R07 have turned 050967.5 into a unique object: the only X-ray bright SNR whose Type Ia origin is confirmed and whose explosion energy can be estimated based on spectroscopic information from its parent supernova. Motivated by these groundbreaking observations, we have re-examined the dynamics and X-ray spectrum of 050967.5, applying the HD+NEI modeling techniques introduced in Badenes et al. (2003) and Badenes et al. (2005a) to Chandra and XMM-Newton observations. We have based our analysis on a grid of one-dimensional DDT explosions, taking advantage of the relationship between ejecta structure and in these models to place the birth event of 050967.5 in the sequence of dim to bright Type Ia SNe. Our conclusions are in excellent agreement with the light echo results of R07: SNR 050967.5 was originated by a bright, highly energetic Type Ia event of the subtype often referred to as SN 1991T-like. We thus present, for the first time, a scenario where the dynamics and X-ray spectrum of a Type Ia SNR form a consistent picture with the spectroscopy of its parent supernova.
Our preferred Type Ia explosion model, DDTa, has a kinetic energy of erg, and synthesizes of Fe, of Si, of S, of O, and of other elements (mostly Ar and Ca). The peak bolometric luminosity of this model is , and the amount of 56Ni in the ejecta before nuclear decays is . These values compare very well with the estimates for SN 1991T: (Contardo et al. 2000); (Stritzinger et al. 2006, UVOIR method), (Stritzinger et al. 2006; Mazzali et al. 2007, B-band lightcurve method). The ejecta density and chemical composition profiles in model DDTa (, ) can reproduce very well both the dynamics (FS radius and velocity) and the fundamental properties of the X-ray spectrum (O, Si, S, and Fe emission) of 050967.5 at an age of 400 yr. Several dynamical, spectral, and historical arguments indicate that the SNR age cannot be very different from this value, which also coincides with the completely independent estimate derived by R05 from the geometry of the light echo.
These results, together with our previous work on the Tycho SNR (Badenes et al. 2006), constitute firm evidence that the phenomenological one-dimensional DDT models, which have proved so successful in explaining the light curves and spectra of Type Ia SNe, are equally capable of reproducing the fundamental properties of the X-ray emission from young Type Ia SNRs. In particular, it is possible to use HD+NEI simulations based on these DDT models to estimate the kinetic energy (and ultimately the brightness) of a Type Ia SN explosion from the X-ray spectrum of its SNR. Hundreds of years after the SN explosion, the memory of the cataclysmic event persists in the X-rays from its SNR, opening a window onto ages past. This enables us to explore the relationship between individual dim/bright Type Ia SNe and their immediate surroundings (presence or absence of stellar formation, local metallicities, etc.) with much greater detail than is available to extragalactic studies (see Prieto et al. 2007). In the context of SNR research, having a good estimate for can help to build better models for the impact of CR acceleration on the SNR dynamics. HD+NEI simulations have clearly become a powerful and flexible tool to study the relationship between SNRs and their parent SNe. For interested readers, the synthetic X-ray spectra from our models are available from the authors upon request.
We conclude with a reminder that much is left to do in the study of Type Ia SNe and their SNRs in general, and of 050967.5 in particular. Ongoing direct measurements of the ejecta and FS expansion using grating observations and proper motion studies should improve our knowledge of the dynamics of this SNR in the near future. Further work on the X-ray emission should take the asymmetries of the object into account, in particular the enhanced Fe knots found by WH04. The one-dimensional models presented here can only sample the average or bulk properties of the shocked ejecta. Observational evidence for moderate asymmetries (Fesen et al. 2007; Gerardy et al. 2007) and clumping (Leonard et al. 2005; Wang et al. 2007) in the ejecta of Type Ia SNe is widespread, and SNR studies offer a unique opportunity to study these effects. This might provide crucial constraints for the multi-dimensional simulations of physically-motivated DDT explosions currently under way (Bravo & García-Senz 2006; Plewa 2007; Jordan et al. 2007)
References
- Alves (2004) Alves, D. R. 2004, New Astronomy Review, 48, 659
- Badenes et al. (2005a) Badenes, C., Borkowski, K. J., & Bravo, E. 2005a, ApJ, 624, 198
- Badenes et al. (2006) Badenes, C., Borkowski, K. J., Hughes, J. P., Hwang, U., & Bravo, E. 2006, ApJ, 645, 1373
- Badenes et al. (2005b) Badenes, C., Bravo, E., & Borkowski, K. J. 2005b, Adv. Space Res., 35, 987
- Badenes et al. (2003) Badenes, C., Bravo, E., Borkowski, K. J., & Domínguez, I. 2003, ApJ, 593, 358
- Badenes et al. (2007) Badenes, C., Hughes, J. P., Bravo, E., & Langer, N. 2007, ApJ, 662, 472
- Baron et al. (2006) Baron, E., Bongard, S., Branch, D., & Hauschildt, P. H. 2006, ApJ, 645, 480
- Benetti et al. (2005) Benetti, S., Cappellaro, E., Mazzali, P. A., Turatto, M., Altavilla, G., Bufano, F., Elias-Rosa, N., Kotak, R., Pignata, G., Salvo, M., & Stanishev, V. 2005, ApJ, 623, 1011
- Bravo & García-Senz (2006) Bravo, E. & García-Senz, D. 2006, ApJ, 642, L157
- Bravo et al. (1996) Bravo, E., Tornambé, A., Domínguez, I., & Isern, J. 1996, A&A, 306, 811
- Cassam-Chenaï et al. (2004) Cassam-Chenaï, G., Decourchelle, A., Ballet, J., Sauvageot, J.-L., Dubner, G., & Giacani, E. 2004, A&A, 427, 199
- Contardo et al. (2000) Contardo, G., Leibundgut, B., & Vacca, W. D. 2000, A&A, 359, 876
- Ellison et al. (2004) Ellison, D., Decourchelle, A., & Ballet, J. 2004, A&A, 413, 189
- Ellison et al. (2007) Ellison, D. C., Patnaude, D. J., Slane, P., Blasi, P., & Gabici, S. 2007, ApJ, 661, 879
- Fesen et al. (2007) Fesen, R. A., Höflich, P. A., Hamilton, A. J. S., Hammell, M. C., Gerardy, C. L., Khokhlov, A. M., & Wheeler, J. C. 2007, ApJ, 658, 396
- Gerardy et al. (2007) Gerardy, C. L., Meikle, W. P. S., Kotak, R., Hoeflich, P., Farrah, D., Filippenko, A. V., Foley, R. J., Lundqvist, P., Mattila, S., Pozzo, M., Sollerman, J., Van Dyk, S. D., & Wheeler, J. C. 2007, ArXiv Astrophysics e-prints
- Ghavamian et al. (2007) Ghavamian, P., Blair, W. P., Sankrit, R., Hughes, J. P., & Raymond, J. C. 2007, ArXiv Astrophysics e-prints
- Höflich & Khokhlov (1996) Höflich, P. & Khokhlov, A. 1996, ApJ, 457, 500
- Hughes et al. (1995) Hughes, J. P., Hayashi, I., Helfand, D. J., Hwang, U., Itoh, M., Kirshner, R. P., Koyama, K., Markert, T., Tsunemi, H., & Woo, J. 1995, ApJ, 444, L81
- Imara & Blitz (2007) Imara, N. & Blitz, L. 2007, ApJ, 662, 969
- Iwamoto et al. (1999) Iwamoto, K., Brachwitz, F., Nomoto, K., Kishimoto, N., Umeda, H., Hix, W., & Thielemann, F.-K. 1999, ApJS, 125, 439
- Jordan et al. (2007) Jordan, G. I., Fisher, R., Townsley, D., Calder, A., Graziani, C., Asida, S., Lamb, D., & Truran, J. 2007, ArXiv Astrophysics e-prints
- Kasen & Woosley (2007) Kasen, D. & Woosley, S. E. 2007, ApJ, 656, 661
- Khokhlov (1991) Khokhlov, A. M. 1991, A&A, 245, 114
- Leonard et al. (2005) Leonard, D. C., Li, W., Filippenko, A. V., Foley, R. J., & Chornock, R. 2005, ApJ, 632, 450
- Marion et al. (2006) Marion, G. H., Höflich, P., Wheeler, J. C., Robinson, E. L., Gerardy, C. L., & Vacca, W. D. 2006, ApJ, 645, 1392
- Mazzali et al. (2007) Mazzali, P. A., Röpke, F. K., Benetti, S., & Hillebrandt, W. 2007, Science, 315, 825
- Phillips (1993) Phillips, M. 1993, ApJ, 413, L105
- Plewa (2007) Plewa, T. 2007, ApJ, 657, 942
- Prieto et al. (2007) Prieto, J. L., Stanek, K. Z., & Beacom, J. F. 2007, ArXiv e-prints, 707
- Rakowski et al. (2006) Rakowski, C. E., Badenes, C., Gaensler, B. M., Gelfand, J. D., Hughes, J. P., & Slane, P. O. 2006, ApJ, 646, 982
- Rest et al. (2007) Rest, A., Matheson, T., Blondin, S., Bergmann, M., Welch, D. L., Suntzeff, N. B., Smith, R. C., Olsen, K., Prieto, J. L., Garg, A., Challis, P., Stubbs, C., Zenteno, A., Damke, G., Newman, A., Huber, M., Cook, K. H., Nikolaev, S., Becker, A. C., Miceli, A., Covarrubias, R., Morelli, L., Clocchiatti, A., & Minniti, D. 2007, ApJ, submitted [R07]
- Rest et al. (2005) Rest, A., Suntzeff, N. B., Olsen, K., Prieto, J. L., Smith, R. C., Welch, D. L., Becker, A., Bergmann, M., Clocchiatti, A., Cook, K., Garg, A., Huber, M., Miknaitis, G., Minniti, D., Nikolaev, S., & Stubbs, C. 2005, Nature, 438, 1132 [R05]
- Smith et al. (2001) Smith, R. K., Brickhouse, N. S., Liedahl, D. A., & Raymond, J. C. 2001, ApJ, 556, L91
- Stritzinger et al. (2006) Stritzinger, M., Mazzali, P. A., Sollerman, J., & Benetti, S. 2006, A&A, 460, 793
- Travaglio et al. (2004) Travaglio, C., Hillebrandt, W., Reinecke, M., & Thielemann, F.-K. 2004, A&A, 425, 1029
- Wang & Chevalier (2001) Wang, C.-Y. & Chevalier, R. 2001, ApJ, 549, 1119
- Wang et al. (2007) Wang, L., Baade, D., & Patat, F. 2007, Science, 315, 212
- Warren & Hughes (2004) Warren, J. & Hughes, J. 2004, ApJ, 608, 261 [WH04]
- Wheeler et al. (1998) Wheeler, J. C., Höflich, P., Harkness, R. P., & Spyromilio, J. 1998, ApJ, 496, 908
- Woosley et al. (2007) Woosley, S. E., Kasen, D., Blinnikov, S., & Sorokina, E. 2007, ApJ, 662, 487
Appendix A SOME REFLECTIONS ON THE RELEVANCE OF SURREALISM TO ASTROPHYSICS
The meaning of Salvador Dalí’s painting The Persistence of Memory (Figure 10) has been discussed at length elsewhere (see f.i. MoMA Highlights, New York: The Museum of Modern Art). The most common interpretation is that the famous ‘soft clocks’ are a metaphor for the passage of time, and the ants represent the inevitable consequence thereof: corruption of the flesh. Other interpretations are definitely possible, and equally valid - this being, after all, surrealism. Dalí once commented that the idea of the soft clocks came to him from the observation of a piece of Camembert cheese melting in the summer heat. Be that as it may, if the soft clocks do represent the passage of time, it is easy to draw an analogy between The Persistence of Memory and young SNRs like 050967.5. The X-ray observations of these objects open a window onto ages past, telling us what processes went on during the supernova explosions that originated them, and further back in time, how the supernova progenitor modified its surroundings. Just like a piece of melting Camembert cheese.