The Ring Imaging Cherenkov detector of the AMS experiment: test beam results with a prototype
Abstract
The Alpha Magnetic Spectrometer (AMS) to be installed on the International Space Station (ISS) will be equipped with a proximity Ring Imaging Cherenkov (RICH) detector for measuring the velocity and electric charge of the charged cosmic particles. This detector will contribute to the high level of redundancy required for AMS as well as to the rejection of albedo particles. Charge separation up to iron and a velocity resolution of the order of 0.1% for singly charged particles are expected. A RICH protoptype consisting of a detection matrix with 96 photomultiplier units, a segment of a conical mirror and samples of the radiator materials was built and its performance was evaluated. Results from the last test beam performed with ion fragments resulting from the collision of a 158 GeV/c/nucleon primary beam of indium ions (CERN SPS) on a lead target are reported. The large amount of collected data allowed to test and characterize different aerogel samples and the sodium fluoride radiator. In addition, the reflectivity of the mirror was evaluated. The data analysis confirms the design goals.
1 The AMS02 detector
AMS [1] (Alpha Magnetic Spectrometer) is a precision spectrometer designed to search for cosmic antimatter, dark matter and to study the relative abundance of elements and isotopic composition of the primary cosmic rays. It will be installed in the International Space Station (ISS), where it will operate at least for three years.
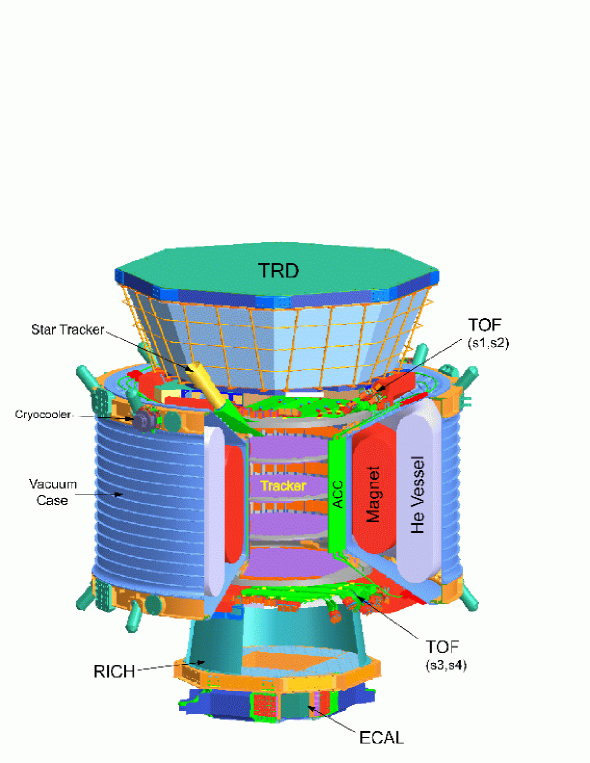
The spectrometer will be capable of measuring the rigidity (), the charge (), the velocity () and the energy () of cosmic rays within a geometrical acceptance of 0.5 m2sr. Fig. 1 shows a schematic view of the AMS spectrometer. The system is composed of several subdectors: Transition Radiation Detector (TRD), Time-of-Flight (TOF), Silicon Tracker (STD), Anticoincidence Counters (ACC), superconducting magnet, Ring Imaging Čerenkov detector and electromagnetic calorimeter (ECAL).
2 The AMS RICH detector
The RICH is a proximity focusing device with a dual radiator configuration on the top made of 92 aerogel 25 mm thick tiles with a refractive index 1.050 and sodium fluoride (NaF) tiles with a thickness of 5 mm in the center covering an area of 3434 cm2. The NaF placement prevents the loss of photons in the hole existing in the center of the readout plane ( cm2), in front of the ECAL calorimeter located below.
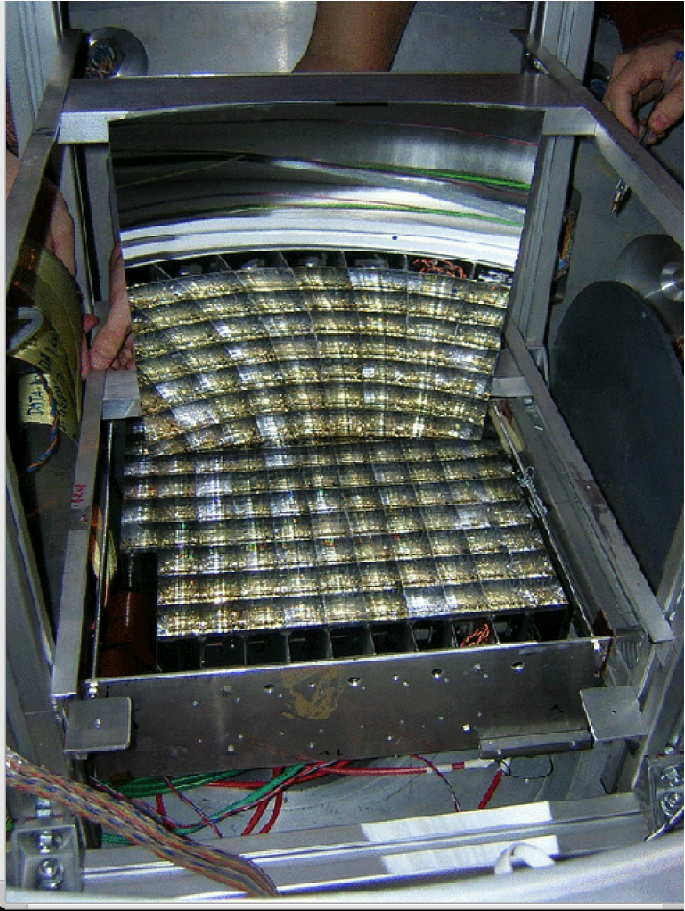
The detection matrix is composed of 680 multipixelized photon readout cells each consisting of a photomultiplier coupled to a light guide, HV divider plus front-end (FE) electronics, all housed and potted in a plastic shell and then enclosed in a magnetic shielding. The photon detection is made with an array of multianode Hamamatsu tubes (R7600-00-M16) coupled to a light guide. The effective pixel size is 8.5 mm.
A high reflectivity conical mirror surrounds the whole set. It consists of a carbon fiber reinforced composite substrate with a multilayer coating made of aluminium and SiO2 deposited on the inner surface. This ensures a reflectivity higher than 85% for 420 nm wavelength photons. Figure 2 (left) shows a schematic view of the RICH detector.
RICH was designed to measure the velocity () of singly charged particles with a resolution of 0.1, to extend the charge separation (Z) up to iron (Z=26), to contribute to separation and to albedo rejection.
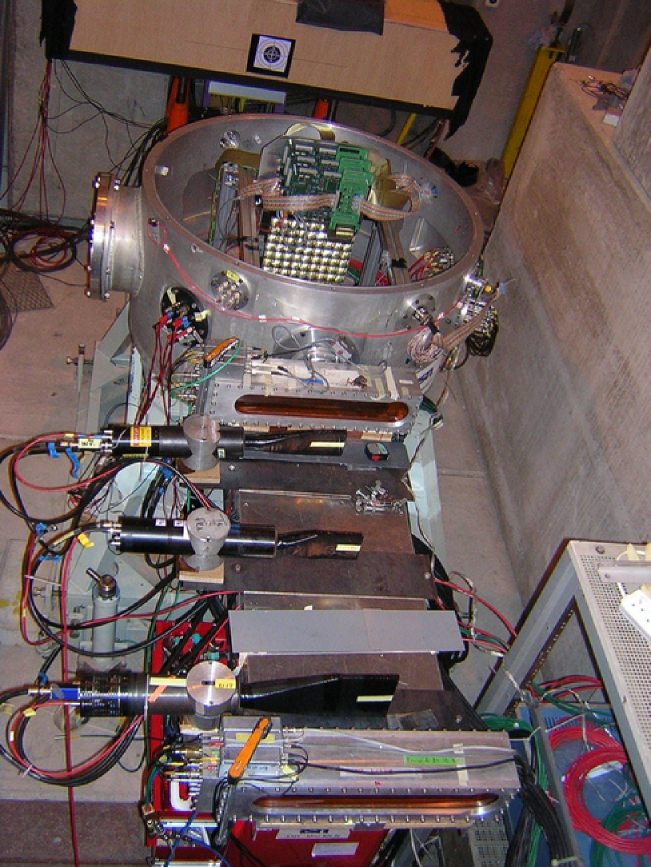
In order to validate the RICH design, a prototype with an array of 911 cells filled with 96 photomultiplier readout units similar to part of the matrix of the final model was constructed. The performance of this prototype has been tested with cosmic muons and with a beam of secondary ions at the CERN SPS produced by fragmentation of a primary beam in 2002 and 2003. The light guides used were prototypes with a slightly smaller collecting area (3131 mm2). Different samples of the radiator materials were tested and placed at an adjustable supporting structure. Different expansion heights were set in order to have fully contained photon rings on the detection matrix like in the flight design. A segment of a conical mirror with 1/12 of the final azimuthal coverage, which is shown in left picture of Figure 3, was also tested.
The RICH assembly has already started at CIEMAT in Spain and is foreseen to be finished in July 2007. A rectangular grid has already been assembled and has been subject to a mechanical fit test, functional tests, vibration tests and vacuum tests. The other grids will follow. The refractive index of the aerogel tiles is being measured and the radiator container was subjected to a mechanical test. The final integration of RICH in AMS will take place at CERN in 2008.

|

|
|
|
3 Velocity () and charge () reconstruction
A charged particle crossing a dielectric material of refractive index , with a velocity , greater than the speed of light in that medium emits photons. The aperture angle of the emitted photons with respect to the radiating particle track is known as the Čerenkov angle, , and it is given by (see [2]).
It follows that the velocity of the particle, , is straightforward derived from the Čerenkov angle reconstruction, which is based on a fit to the pattern of the detected photons. Complex photon patterns can occur at the detector plane due to mirror reflected photons, as can be seen on right display of Figure 2. The event displayed is generated by a simulated beryllium nuclei in a NaF radiator.
The Čerenkov angle reconstruction procedure relies on the information of the particle direction provided by the tracker. The best value of will result from the maximization of a likelihood function, built as the product of the probabilities, , that the detected hits belong to a given (hypothesis) Čerenkov photon pattern ring,
| (1) |
Here is the closest distance of the hit to the Čerenkov pattern and is the hit signal. For a more complete description of the method see [3].
The Čerenkov photons produced in the radiator are uniformly emitted along the particle path inside the dielectric medium, , and their number per unit of energy () depends on the particle’s charge, , and velocity, , and on the refractive index, . Therefore electric charge () is determined from the signal evaluation and taking into account the different detection efficiencies.
| (2) |
3.1 Results with the RICH prototype
The large amount of collected data in the last test beam at CERN, in October 2003, performed with ion fragments resulting from the collision of a 158 GeV/c/nucleon primary beam of indium ions (CERN SPS) on a lead target, allowed to test the beta and charge reconstruction algorithms, as well as to characterize the used radiators [4]. Figure 3 (right) shows a general view of the 2003 test beam setup in the experimental area H8-SPS at CERN.
The resolution of the measurement, obtained as explained in Section 3, was estimated using a Gaussian fit to the reconstructed spectrum, shown in left plot of Figure 4 for helium nuclei. Data were collected with the aerogel radiator n=1.05, 2.5 cm thick together with an expansion height of 35.31 cm. The events shown correspond to particles impinging vertically and generating fully contained rings. The beta reconstructed from simulated helium data is also shown superimposed with a good agreement between data and Monte Carlo (MC).
| \begin{overpic}[bb=0 0 482 482]{r538.beta.sim.data.eps} \put(67.0,75.0){\huge{$\bullet$}} \put(72.0,75.0){\huge{DATA}} \put(65.0,70.0){{\psset{fillstyle=solid,fillcolor=cyan}\psframebox{\parbox{13.00806pt}{\color[rgb]{0,0,0}\begin{flushleft}{~{}}\end{flushleft} }}}} \put(72.0,70.0){\huge{MC}} \end{overpic} |
|
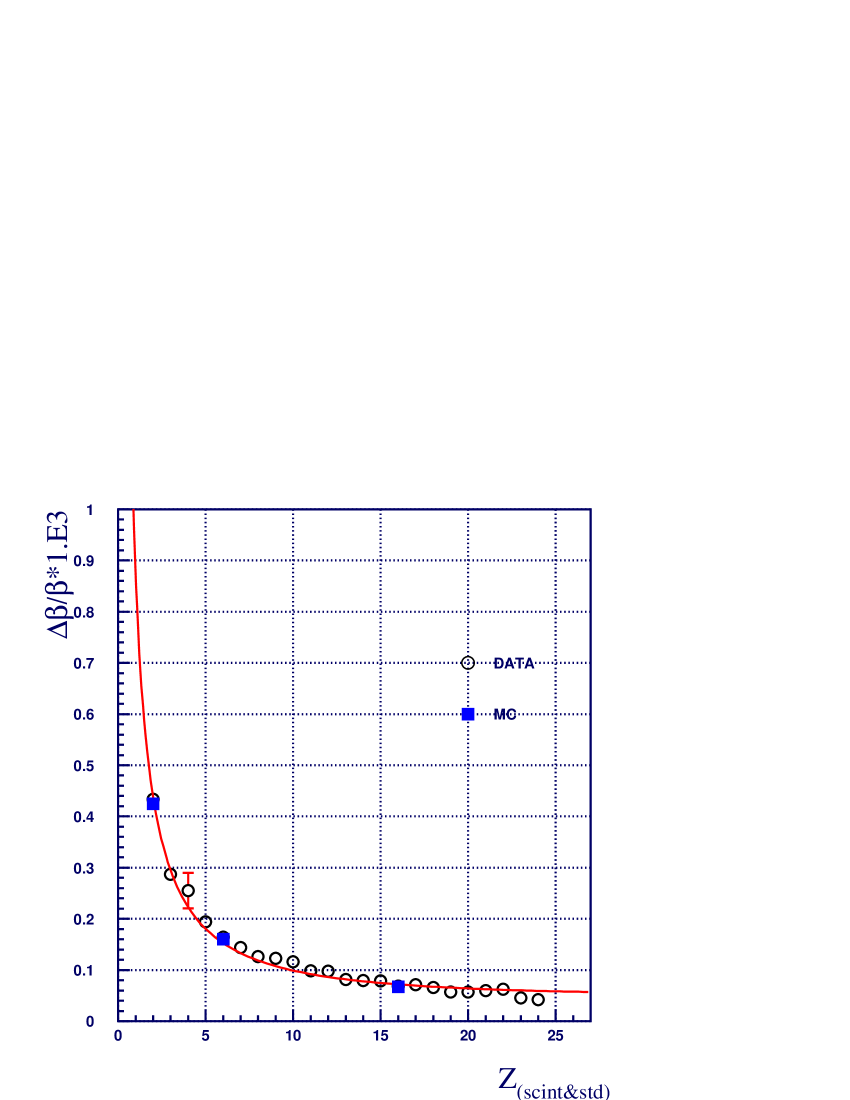
The charge dependence of the velocity relative resolution for the same radiator is shown in the right plot of Figure 4. The observed resolution varies according to a law 1/Z, as it is expected from the charge dependence of the photon yield in the Čerenkov emission, up to a saturation limit set by the pixel size of the detection unit cell. The function used to perform the fit is the following:
| (3) |
where, means the resolution for a singly charged particle while means the resolution for a very high charge generating a large number of hits. The fitted values are and for the run conditions stated above. Simulated data points for Z=2, 6, 16 are marked upon the same plot with full squares. Once more the agreement between data and MC measurements for charges different of Z=2 is good.
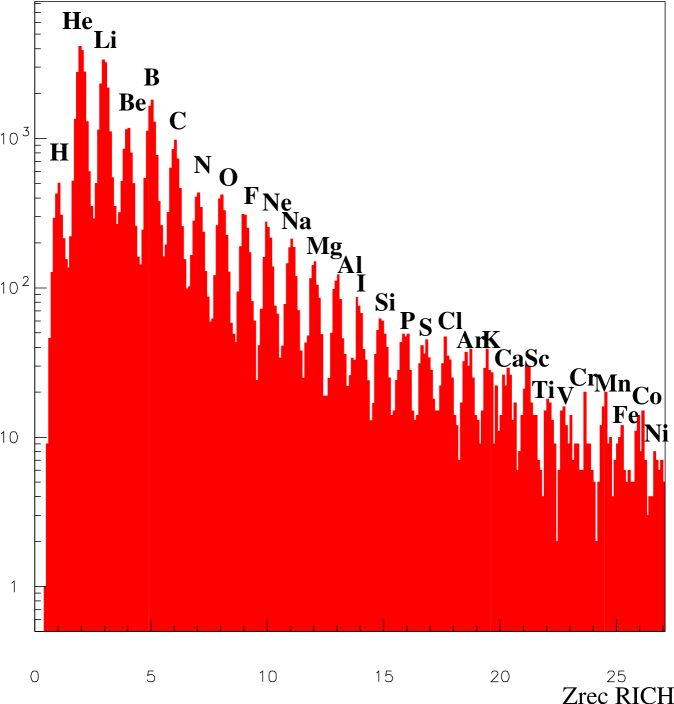
The distribution of the reconstructed charges in an aerogel radiator of n=1.05, 2.5 cm thick is shown in left plot of Figure 5. The spectrum enhances a structure of well separated individual charge peaks over the whole range up to Z=28.
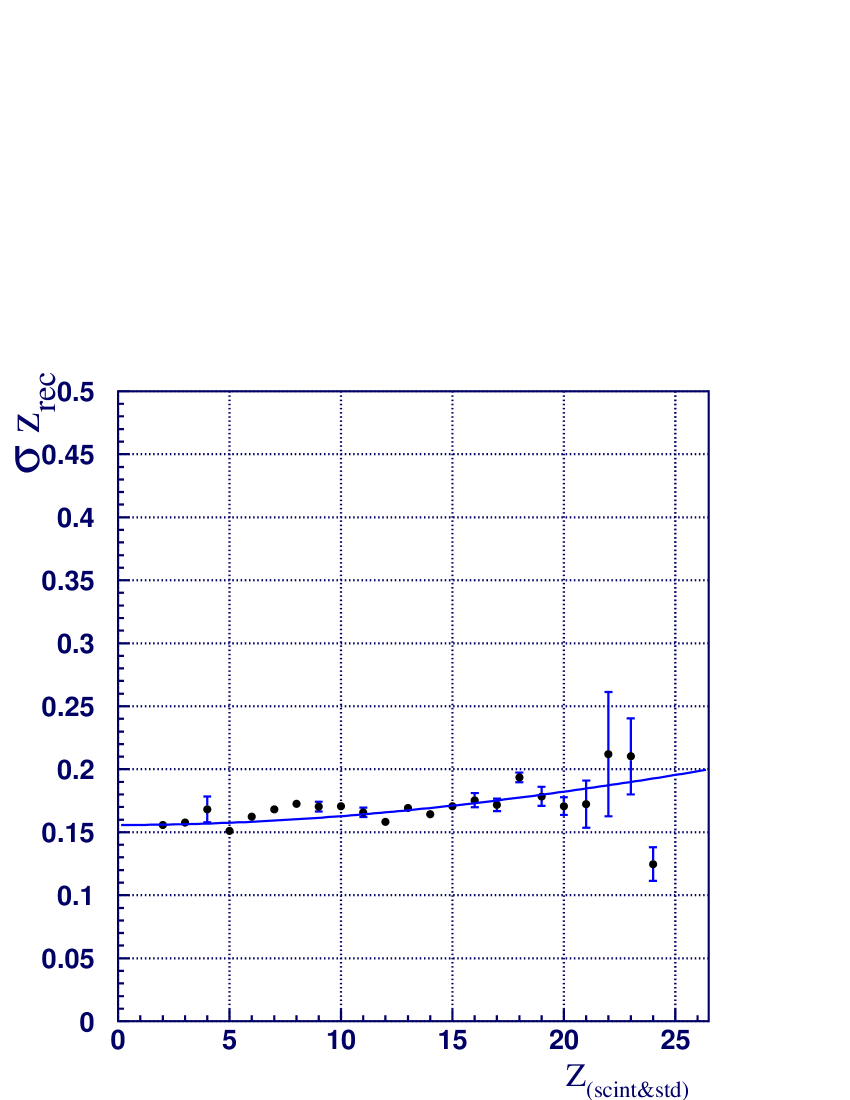
The charge resolution for each nuclei, shown in right panel of Figure 5, was evaluated through individual Gaussian fits to the reconstructed charge peaks selected by the independent measurements performed by two scintillators and silicon tracker detectors. A charge resolution for proton events slightly better than charge units is achieved.
The charge resolution as function of the charge Z of the particle follows a curve that corresponds to the error propagation on Z which can be expressed as:
| (4) |
This expression describes the two distinct types of uncertainties that affect Z measurement: the statistical and the systematic. The statistical term is independent of the nuclei charge and depends essentially on the amount of Čerenkov signal detected for singly charged particles () and on the resolution of the single photoelectron peak (). The systematic uncertainty scales with Z, dominates for higher charges and is around 1%. It appears due to non-uniformities at the radiator level or at the photon detection. In order to keep the systematic uncertainties below 1%, the aerogel tile thickness, the refractive index and the clarity should not have a spread greater than 0.25 mm, and , respectively; at the detection level a precise knowledge ( level) of the single unit cell photo-detection efficiency and gains is required.
|
|
Runs with a mirror prototype were also performed and its reflectivity was derived from data analysis. The obtained value is in good agreement with the manufacturer value.
4 Conclusions
AMS-02 will be equipped with a proximity focusing RICH enabling velocity measurements with a resolution of about 0.1% and extending the charge measurements up to the iron element. Velocity reconstruction is made with a likelihood method. Charge reconstruction is made in an event-by-event basis. Evaluation of both algorithms on real data taken with in-beam tests at CERN, in October 2003 was done. The detector design was validated and a refractive index 1.05 aerogel was chosen for the radiator, fulfilling both the demand for a large light yield and a good velocity resolution. The RICH detetector is being constructed and its assembling to the AMS complete setup is foreseen for 2008.
References
- [1] S. P. Ahlen et al., Nucl. Instrum. Methods A 350, 34 (1994).
- [2] T.Ypsilantis and J.Seguinot, Nucl. Instrum. Methods A 343, 30 (1994).
- [3] F.Barão, Nucl. Instrum. Methods A 502, 510 (2003).
- [4] P. Aguayo, L.Arruda et al., NIM A560, 291 (2006).