Timing and spectral properties of the accreting millisecond pulsar SWIFT J1756.9–2508
Abstract
SWIFT J1756.9-2508 is one of the few accreting millisecond pulsars (AMPs) discovered to date. We report here the results of our analysis of its aperiodic X-ray variability, as measured with the Rossi X-ray Timing Explorer during the 2007 outburst of the source. We detect strong (35%) flat-topped broadband noise throughout the outburst with low characteristic frequencies (0.1 Hz). This makes SWIFT J1756.9-2508 similar to the rest of AMPs and to other low luminosity accreting neutron stars when they are in their hard states, and enables us to classify this AMP as an atoll source in the extreme island state. We also find a hard tail in its energy spectrum extending up to 100 keV, fully consistent with such source and state classification.
Subject headings:
binaries: close — pulsars: individual (SWIFT J1756.9-2508) — stars: neutron — X-rays: binaries1. Introduction
Nine years after the discovery of the first accreting millisecond pulsar (AMP), the number and variety of this type of neutron star low-mass X-ray binary (NS-LMXB) continues to grow. The idea that a neutron star could be spun up by accretion torques in the bosom of a LMXB (Alpar et al. 1982; Bhattacharya & van den Heuvel 1991) was confirmed in 1998, when the first millisecond pulses were seen from a LMXB (Wijnands & van der Klis 1998). Besides coherent pulsations, two types of quasi-periodic millisecond X-ray variability have been seen in AMPs: twin kilohertz quasi-periodic oscillations (kHz QPOs) in SAX J1808.4–3658 and XTE J1807–294 (Wijnands et al. 2003; Linares et al. 2005) and burst oscillations also in SAX J1808.4–3658 and in XTE J1814–338 (Chakrabarty et al. 2003; Strohmayer et al. 2003). Together, these phenomena place important constraints on kHz QPO and type I X-ray burst models, offering a new insight onto accretion physics (van der Klis 2006, for a recent review). As far as low frequency variability is concerned, the fastest spinning AMP, IGR J00291+5934, showed the strongest broadband noise with the lowest characteristic frequencies observed to date in a NS-LMXB (Linares et al. 2007).
Even though AMPs have provided new input to better understand accretion onto low magnetic field NSs, important questions about their physics remain open. For instance, if the magnetic field of the neutron star in AMPs disrupts and channels the accretion flow, thereby producing the observed pulsations, it is not clear yet why the strength or configuration of such magnetic field should differ drastically from that of non-pulsating NS-LMXBs (see Cumming et al. 2001, for a possible explanation). In this context it is interesting to note that in three systems millisecond X-ray pulsations have been seen to appear in and disappear from the persistent emission, producing predominant (HETE J1900.1-2455; Galloway et al. 2007) intermittent (SAX J1748.9-2021; Altamirano et al. 2008) or very rare (Aql X-1; Casella et al. 2008) episodes of pulsations. This implies that the AMP within them is only active or visible during a relatively small fraction of the time, which may provide a link with non-pulsating NS-LMXBs.
On June , 2007, a new X-ray transient was discovered (Krimm et al. 2007a) with the burst alert telescope (BAT) onboard Swift. Subsequent RXTE observations revealed that this was the eighth discovered AMP, with a pulse frequency of 182 Hz and an orbital period of 54 minutes (Markwardt et al. 2007; Markwardt & Krimm 2007; Krimm et al. 2007b). The outburst lasted about two weeks and a possible infrared counterpart was identified (Burderi et al. 2007). No radio pulsations were found in quiescence at 8.7 and 1.4 GHz (Possenti et al. 2007; Hessels & Stappers 2007).
In the present work we analyze the aperiodic variability of the source and compare it with other AMPs and with atoll sources (a low-luminosity class of NS-LMXB, see Hasinger & van der Klis 1989). Using both PCA and HEXTE data we also measure its 2-200 keV energy spectrum. We are thereby able to classify SWIFT J1756.9-2508 as an atoll source and to characterize its accretion state.
| Set | ObsID | Date111Observation start date in MJD | Detectors222Average number of active detectors | Count Rate 333Average and standard deviation of the 2-35 keV PCA count rate, including all active detectors and not corrected for background (which we estimate from set E to be 22.3 c/s/PCU; see Section 2) | 512-s PDS444Number of power density spectra extracted from the observation, each of them 512 s long |
| (c/s) | |||||
| A | 93065-01-01-02 | 54265.2 | 2.0 | 111.01.4 | 6 |
| 93065-01-02-00 | 54266.0 | 2.0 | 102.33.8 | 16 | |
| B | 93065-01-02-01 | 54267.0 | 2.0 | 95.30.9 | 4 |
| 92050-01-01-01 | 54267.1 | 3.0 | 136.71.0 | 6 | |
| 92050-01-01-00 | 54267.4 | 1.7 | 75.321.1 | 24 | |
| 92050-01-01-02 | 54268.1 | 2.5 | 109.320.9 | 12 | |
| C | 92050-01-01-03 | 54269.0 | 2.0 | 71.31.3 | 6 |
| 92050-01-01-04 | 54269.2 | 2.0 | 68.84.2 | 5 | |
| D | 92050-01-01-06 | 54270.2 | 2.0 | 46.02.2 | 10 |
| 92050-01-01-07 | 54270.6 | 2.4 | 62.412.6 | 20 | |
| E | 92050-01-01-10 | 54271.6 | 2.0 | 49.40.9 | 3 |
| 92050-01-01-11 | 54271.8 | 2.0 | 50.02.2 | 4 | |
| 92050-01-01-12 | 54271.9 | 3.0 | 67.01.6 | 5 | |
| 92050-01-01-09 | 54271.9 | 1.0 | 20.90.3 | 5 | |
| 92050-01-01-08 | 54272.4 | 1.3 | 28.611.1 | 19 | |
| 92050-01-01-13 | 54273.0 | 2.0 | 47.41.2 | 5 | |
| 92050-01-02-00 | 54273.5 | 1.0 | 21.80.6 | 11 |
2. Observations and Data Analysis
We used all pointed RXTE observations of SWIFT J1756.9-2508 (Table 1). The observations started on June , 2007, and were all performed with an 0.3∘ pointing offset in order to avoid contamination from the nearby (0.9∘ away) bright source GX 5-1. After applying standard screening criteria555See http://heasarc.nasa.gov/docs/xte/abc/screening.html. A conservative filter on the time after SAA passage (15 min) and the ELECTRON2 rate (0.1 c/s) was applied before extracting the energy spectra. we extracted energy spectra from PCA (using only PCU2) and HEXTE (using cluster B) data and power spectra from PCA data, using all active PCUs.
After checking that no strong source falls within the field of view of HEXTE-cluster B666According to HEXTErock:http://heasarc.gsfc.nasa.gov/cgi-bin/Tools/HEXTErock/HEXTErock.pl, we extracted source and background spectra from standard mode data. The background spectrum was obtained by averaging both rocking positions. We applied dead-time correction and created response matrices taking into account the above mentioned pointing offset.
A first estimate of the PCU2 background was given by the PCA background model for faint sources. Given that the source lies in the direction of the Galactic bulge and from the observed flux in the last part of the outburst (or “tail”, set E, see below) it is clear that there is additional (non-instrumental) background flux, most likely originating in the Galactic ridge (note that the source was not detected by Campana et al. 2007, with the Swift-XRT on June , within set E). The presence of an iron line at 6.5 keV whose energy, width and flux remained constant as the overall flux decreased also suggests that the Galactic ridge is the main source of contaminating flux. In order to take this into account and under the assumption that both instrumental and astronomical backgrounds remain constant during the observations, we obtained the average spectrum of the tail of the outburst and subtracted it from every PCU2 spectrum. This final empirical background estimation is independent of PCA background modelling. The iron line was not present in the resulting spectra. We created response matrices for the 0.3∘ off-axis pointing.
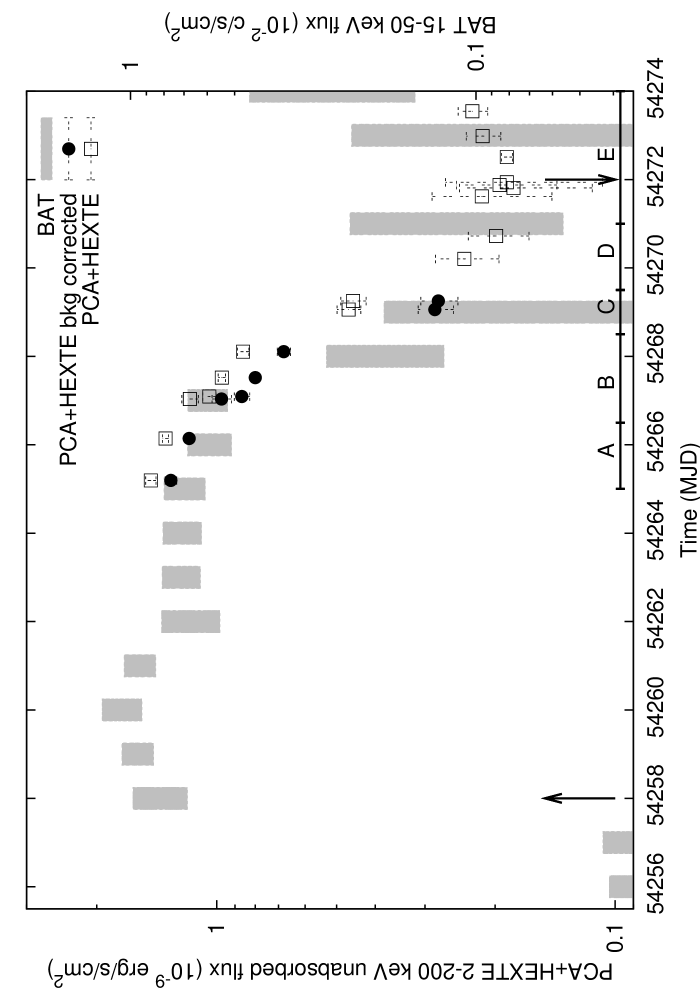
A detailed modelling of the energy spectra is beyond the scope of this paper, and probably difficult due to the faintness of the source, so we opted for the following phenomenological approach. We fitted the joint PCA+HEXTE spectra with an absorbed blackbody plus power law model using XSPEC v.11 (Arnaud 1996), allowing for a constant factor (weighted mean 0.680.03) to account for the difference in effective areas between PCA and HEXTE. The equivalent hydrogen column density was fixed to 5.4 , the value measured by Krimm et al. (2007b) from the Swift X-ray telescope (XRT) spectrum. Figure 1 displays the evolution of the 2-200 keV unabsorbed flux and the BAT 15-50 keV lightcurve, showing the rise, decay, duration and peak flux of the outburst as well as the data sets used in the timing analysis (see below).
In order to study the low-frequency variability, we performed fast Fourier transforms (FFTs) on 512 s event mode data segments keeping the original 125 s time resolution. The power spectra thereby cover the 0.02-4000 Hz frequency range. We used PCA channels 0 to 79 (2.0-35.0 keV) excluding the highest (background-dominated) channels to increase the signal-to-noise ratio, and averaged all power spectra within each observation. No dead time nor background correction was made before the FFTs and the Poisson noise level was subtracted according to Klein-Wolt (2004) (using the Zhang et al. 1995, formula and shifting the resulting level to match the 2000–4000 Hz range, where no intrinsic power is expected). When looking for changes in frequency and power of the broadband noise (see Sec.3) we averaged observations successive in time and with power spectra consistent within errors in order to improve the statistics. The outburst was divided into five contiguous data sets (labeled A-E; see Table 1 and Figure 1). In set C low statistics only allows us to constrain the break frequency and the flat-top power level. In data set D the source was too faint to measure accurately its energy or power spectrum (about 2.5 c/s/PCU), and as discussed above data set E is background dominated. Power spectra were “rms-normalized” (van der Klis 1995) using the count rate observed in set E as background count rate.
We fitted the broadband power spectra with a sum of four Lorentzians in representation (Belloni et al. 2002)777 gives the characteristic frequency of the variability feature, where is the Lorentzian’s centroid frequency and its HWHM. The quality factor is a measure of the coherence of the feature. Its strength is given by the integral power (0–) whose square root, in the normalization we use, is the fractional rms amplitude of the variability., three of which were zero-centered. Following previous notation (Belloni et al. 2002; van Straaten et al. 2003; Linares et al. 2007), we call the different Lorentzians and refer to their characteristic frequencies as , where the label “i” identifies the variability feature (see Section 3).
3. Results and Discussion
Figure 2 shows the broadband power spectrum of SWIFT J1756.9-2508. Its overall shape is typical of island and extreme island states (IS/EIS) of atoll sources (see e.g. Barret et al. 2000; Belloni et al. 2002), as well as similar to low (luminosity) and hard (spectrum) states of black hole X-ray binaries (e.g. XTE J1118+480; Revnivtsev et al. 2000, XTE J1550–564; Cui et al. 1999). Furthermore, the integrated (0.01-100 Hz) fractional rms variability was very high (35%), also characteristic of such low-hard (Comptonized) states. This allows us to classify this AMP as an atoll source, something common to all the other AMPs known to date (Wijnands 2005). The low characteristic frequencies of the variability (see below) indicate that SWIFT J1756.9-2508 was in the EIS during its 2007 outburst (see van der Klis 2006, for an overview of states).
| Parameter | /d.o.f. | ||||
| Set A | |||||
| (Hz) | 0.120.01 | 0.450.03 | 3.10.9 | 5330 | 167/150 |
| rms (%) | 17.70.8 | 13.11.6 | 17.91.3 | 213 | |
| Q | 0 (fixed) | 0.90.3 | 0 (fixed) | 0 (fixed) | |
| Set B | |||||
| (Hz) | 0.090.01 | 0.390.02 | 3.10.6 | 14141 | 142/150 |
| rms (%) | 18.30.8 | 15.11.5 | 21.00.9 | 343 | |
| Q | 0 (fixed) | 0.70.2 | 0 (fixed) | 0 (fixed) | |
| 77footnotetext: See Section 2 for details of the fit function and notation. All errors are 1. |
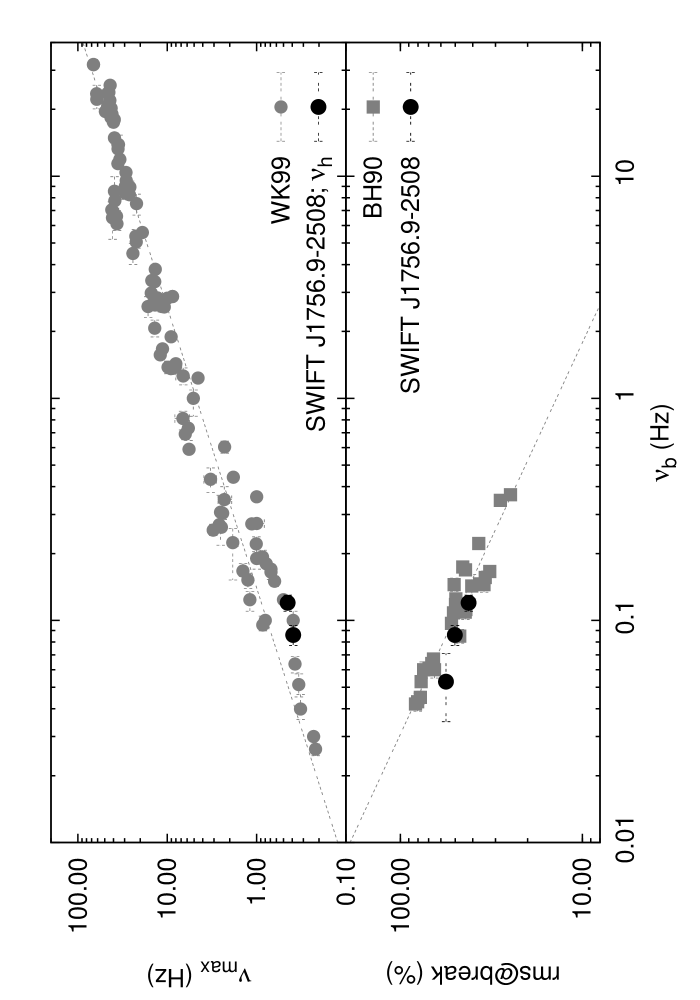
The most prominent variability feature is a strong, band-limited and flat-topped noise component (, for “break”), with a break or cutoff at a frequency 0.1 Hz. This break frequency lies in the low frequency end of the range usually observed in NS-LMXBs. We also detect a narrower (Q0.8) component at higher frequencies (0.4 Hz). The correlations between characteristic frequencies of power spectral features are a useful tool to identify such features (Wijnands & van der Klis 1999; Psaltis et al. 1999; van Straaten et al. 2005). The narrow component at 0.4 Hz follows the correlation found by Wijnands & van der Klis (1999) between and the frequency of the “hump” () present above in both black hole and neutron star systems (see Figure 3), and we therefore identify it as . The next component in order of increasing frequency has a characteristic frequency of 3.1 Hz, close to (but a bit lower than) what we would expect from extrapolating the relation between and found in atoll sources (van Straaten et al. 2002, 2003). This leads us to tentatively identify it as . The highest frequency component that we find in the power spectrum of SWIFT J1756.9-2508 is most likely , also present also present in the same frequency range in IS/EIS of atoll sources. A less likely candidate is the so-called “hecto-Hertz” Lorentzian, as that component seems to be present only when the variability is at higher frequencies, with more than one order of magnitude higher (van Straaten et al. 2002). All parameters from the fits to sets A and B are shown in Table 2.
In disk accreting X-ray binaries as the flat-topped noise shifts down in frequency its flat top becomes higher. In other words, the rms level at the break of the power spectrum is anticorrelated with the frequency of that break. This was found by Belloni & Hasinger (1990) in Cyg X-1 and extended to other BH and NS systems by Belloni et al. (2002). SWIFT J1756.9-2508 also follows this anticorrelation, as can be clearly seen from Figure 3.
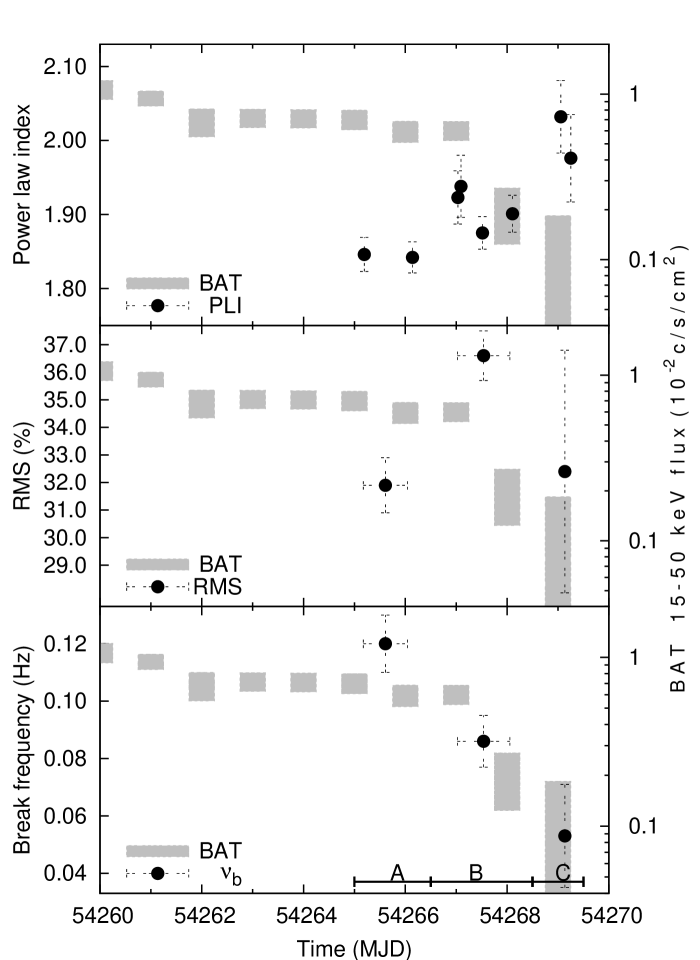
The broadband 2-200 keV spectra from all observations within sets A, B and C were reasonably well fitted (reduced 1.5 for 61 degrees of freedom) with the adopted (Sec. 2) model (see Figure 4). The resulting parameters are shown in Table 3. A hard tail extending up to 100 keV was present in the energy spectra during most of the outburst, similar to island states of other atoll sources (di Salvo et al. 2004). As can be seen from Figure 5, the resulting power law index increases when the outburst decays. Several models have been proposed for the emission process at work in the transition from outburst to quiescence, including pulsar shock emission and thermal emission from the neutron star (Campana et al. 1998, for a review). Our data are not sensitive enough to yield precise tests of such models, and in general sensitivity limits and time constrains make this task a difficult one.
| ObsID | Ph.I. | P.L. | kT | /d.o.f. | 2-200 keV unabs. |
| norm | (keV) | Flux () | |||
| Set A | |||||
| 93065-01-01-02 | 1.850.02 | (13.00.6) | 0.50.2 | 43/61 | (13.00.4) |
| 93065-01-02-00 | 1.840.02 | (11.00.6) | 0.70.1 | 53/61 | (11.70.2) |
| Set B | |||||
| 93065-01-02-01 | 1.920.04 | (11.00.9) | 0.50.1 | 59/61 | (9.70.5) |
| 92050-01-01-01 | 1.940.04 | (11.01.1) | 0.60.4 | 61/61 | (8.70.4) |
| 92050-01-01-00 | 1.880.02 | (9.60.5) | 0.60.1 | 70/61 | (8.00.2) |
| 92050-01-01-02 | 1.900.03 | (9.10.6) | 0.70.1 | 83/61 | (6.80.3) |
| Set C | |||||
| 92050-01-01-03 | 2.030.05 | (6.40.6) | 0.50.1 | 73/61 | (2.80.3) |
| 92050-01-01-04 | 1.980.06 | (4.70.7) | 0.40.2 | 41/61 | (2.80.3) |
| 77footnotetext: NOTE.– In all fits the column density was fixed to 5.4 (Krimm et al. 2007b). The power law (P.L.) is characterized by the photon index (Ph.I.) and the normalization, which corresponds to the photon flux density at 1 keV. In five cases the B.B. normalization was not significant but in all 8 observations it gave a improvement in the fit, according to the f-test for additional terms. All errors are 1. |
We do not detect a significant change in the fractional rms of with energy in the studied energy range, suggesting that the spectrum of this component is flat. Previous work has shown that in LMXBs the X-ray luminosity does not uniquely determine the characteristic frequencies of the variability (Ford et al. 2000; van Straaten et al. 2005; van der Klis 2006) so that another parameter must act to decouple luminosity and variability frequencies. Figure 5 shows that as the outburst decays and the inferred mass accretion rate drops the fractional rms variability seems to increase, whereas the frequency of the break decreases. The same behavior has been observed e.g. in IGR J00291+5934 (Linares et al. 2007). A successful model for broadband noise in LMXBs should explain both this short-term correlation between luminosity and break (or “cutoff”) frequency and the long-term luminosity-frequency decoupling discussed above.
Acknowledgments:
Swift-BAT transient monitor results provided by the Swift-BAT team
(http://swift.gsfc.nasa.gov/docs/swift/results/transients/).
References
- Alpar et al. (1982) Alpar M.A., Cheng A.F., Ruderman M.A., Shaham J., 1982, Nature, 300, 728
- Altamirano et al. (2008) Altamirano D., Casella P., Patruno A., Wijnands R., van der Klis M., 2008, ApJL, accepted
- Arnaud (1996) Arnaud K.A., 1996, In: Jacoby G.H., Barnes J. (eds.) Astronomical Data Analysis Software and Systems V, vol. 101 of Astronomical Society of the Pacific Conference Series, 17–+
- Barret et al. (2000) Barret D., Olive J.F., Boirin L., et al., 2000, ApJ, 533, 329
- Belloni & Hasinger (1990) Belloni T., Hasinger G., 1990, A&A, 227, L33
- Belloni et al. (2002) Belloni T., Psaltis D., van der Klis M., 2002, ApJ, 572, 392
- Bhattacharya & van den Heuvel (1991) Bhattacharya D., van den Heuvel E.P.J., 1991, Phys. Rep., 203, 1
- Burderi et al. (2007) Burderi L., Testa V., Menna M.T., et al., 2007, The Astronomer’s Telegram, 1132, 1
- Campana et al. (1998) Campana S., Colpi M., Mereghetti S., Stella L., Tavani M., 1998, A&A Rev., 8, 279
- Campana et al. (2007) Campana S., Romano P., Kennea J., et al., 2007, The Astronomer’s Telegram, 1117, 1
- Casella et al. (2008) Casella P., Altamirano D., Wijnands R., van der Klis M., 2008, ApJL, accepted
- Chakrabarty et al. (2003) Chakrabarty D., Morgan E.H., Muno M.P., et al., 2003, Nature, 424, 42
- Cui et al. (1999) Cui W., Zhang S.N., Chen W., Morgan E.H., 1999, ApJ, 512, L43
- Cumming et al. (2001) Cumming A., Zweibel E., Bildsten L., 2001, ApJ, 557, 958
- di Salvo et al. (2004) di Salvo T., Santangelo A., Segreto A., 2004, Nuclear Physics B Proceedings Supplements, 132, 446
- Ford et al. (2000) Ford E.C., van der Klis M., Méndez M., et al., 2000, ApJ, 537, 368
- Galloway et al. (2007) Galloway D.K., Morgan E.H., Krauss M.I., Kaaret P., Chakrabarty D., 2007, ApJ, 654, L73
- Hasinger & van der Klis (1989) Hasinger G., van der Klis M., 1989, A&A, 225, 79
- Hessels & Stappers (2007) Hessels J.W.T., Stappers B.W., 2007, The Astronomer’s Telegram, 1129, 0
- Klein-Wolt (2004) Klein-Wolt M., 2004, Thesis, Universiteit van Amsterdam
- Krimm et al. (2007a) Krimm H.A., Barthelmy S.D., Barbier L., et al., 2007a, The Astronomer’s Telegram, 1105, 1
- Krimm et al. (2007b) Krimm H.A., Markwardt C.B., Deloye C.J., et al., 2007b, ApJ, 668, L147
- Linares et al. (2005) Linares M., van der Klis M., Altamirano D., Markwardt C.B., 2005, ApJ, 634, 1250
- Linares et al. (2007) Linares M., van der Klis M., Wijnands R., 2007, ApJ, 660, 595
- Markwardt & Krimm (2007) Markwardt C.B., Krimm H.A., 2007, The Astronomer’s Telegram, 1114, 1
- Markwardt et al. (2007) Markwardt C.B., Krimm H.A., Swank J.H., 2007, The Astronomer’s Telegram, 1108, 1
- Possenti et al. (2007) Possenti A., Murgia M., Reynolds J., et al., 2007, The Astronomer’s Telegram, 1128, 1
- Psaltis et al. (1999) Psaltis D., Belloni T., van der Klis M., 1999, ApJ, 520, 262
- Revnivtsev et al. (2000) Revnivtsev M., Sunyaev R., Borozdin K., 2000, A&A, 361, L37
- Strohmayer et al. (2003) Strohmayer T.E., Markwardt C.B., Swank J.H., in’t Zand J., 2003, ApJ, 596, L67
- van der Klis (1995) van der Klis M., 1995, Proceedings of the NATO Advanced Study Institute on the Lives of the Neutron Stars, held in Kemer, Turkey, August 19-September 12, 1993. Editor(s), M. A. Alpar, U. Kiziloglu, J. van Paradijs; Publisher, Kluwer Academic, Dordrecht, The Netherlands, Boston, Massachusetts, 301
- van der Klis (2006) van der Klis M., 2006, in ”Compact Stellar X-ray Sources”, ed. W. H. G. Lewin & M. van der Klis (Cambridge Univ. Press) (astro-ph/0410551), 39–112
- van Straaten et al. (2002) van Straaten S., van der Klis M., di Salvo T., Belloni T., 2002, ApJ, 568, 912
- van Straaten et al. (2003) van Straaten S., van der Klis M., Méndez M., 2003, ApJ, 596, 1155
- van Straaten et al. (2005) van Straaten S., van der Klis M., Wijnands R., 2005, ApJ, 619, 455
- Wijnands (2005) Wijnands R., 2005, astro-ph/0501264
- Wijnands & van der Klis (1998) Wijnands R., van der Klis M., 1998, Nature, 394, 344
- Wijnands & van der Klis (1999) Wijnands R., van der Klis M., 1999, ApJ, 514, 939
- Wijnands et al. (2003) Wijnands R., van der Klis M., Homan J., et al., 2003, Nature, 424, 44
- Zhang et al. (1995) Zhang W., Jahoda K., Swank J.H., Morgan E.H., Giles A.B., 1995, ApJ, 449, 930