Early-Type Disk Galaxies: Structure and Kinematics
Abstract
Spectroscopic observations of three lenticular (S0) galaxies (NGC 1167, NGC 4150, and NGC 6340) and one SBa galaxy (NGC 2273) have been taken with the 6-m telescope of the Special Astrophysical Observatory of the Russian Academy of Sciences aimed to study the structure and kinematic properties of early-type disk galaxies. The radial profiles of the stellar radial velocities and the velocity dispersion are measured. -body simulations are used to construct dynamical models of galaxies containing a stellar disk, bulge, and halo. The masses of individual components are estimated for maximum-mass disk models. A comparison of models with estimated rotational velocities and the stellar velocity dispersion suggests that the stellar disks in lenticular galaxies are “overheated”; i.e., there is a significant excess velocity dispersion over the minimum level required to maintain the stability of the disk. This supports the hypothesis that the stellar disks of S0 galaxies were subject to strong gravitational perturbations. The relative thickness of the stellar disks in the S0 galaxies we consider substantially exceed the typical disk thickness of spiral galaxies.
1 INTRODUCTION
Early-type disk galaxies are galaxies of morphological types S0–S0/a (lenticular galaxies) and Sa with properties similar to those of lenticular galaxies. The structure of early-type disk galaxies is similar to that of later-type spirals: they have a massive stellar disk and, in many cases, also a dynamically decoupled stellar circumnuclear disk, a developed bulge, and a dark halo that determines the rotational velocity of their outer regions. They differ from most later-type spirals in their higher (on average) bulge luminosities, the low contrast or even total lack of their spiral arms, the very low surface density of gas (HI), and, consequently, their extremely weak star formation.
Explaining the observed features of early-type disk galaxies poses a number of problems. First and foremost, it is unclear whether lenticular galaxies represent a logical extension of the Sd–Sa morphological sequence of galaxies, which reflects the conditions for their formation and the nature of their ensuing “quiescent” evolution, or whether their peculiarities are caused by their interaction with the environment (mergers, accretion of small satellites, loss of gas due to the pressure of the external medium).
Indeed, lenticular galaxies include many objects whose structure suggests an appreciable external influence (e.g., dynamically and chemically decoupled circumnuclear disks, peculiarities of the radial brightness profile, or peculiar structural features, such as polar rings). S0 galaxies in rich clusters appear to form as a result of the direct effect of the intergalactic gas on the interstellar medium, directly or indirectly leading to a reduction in the amount of gas and a “halt” of active star formation. Environmental effects evidently play a key role in this case, as is demonstrated by the lower percentage of early galaxies in distant clusters (the Butcher–Oemler effect [1, 2]), and the lower contemporary rates of the current star formation in galaxies located in denser environments [6]. However, early-type galaxies also include quite a few field galaxies, which may have different histories.
The problem of the gas content in lenticular galaxies is equally interesting. Even when HI is present in detectable amounts, its total mass is at least an order of magnitude lower than would be expected to result from a simple return to the interstellar medium of gas ejected by evolved disk stars [4]. The scarcity of data on the thickness of the stellar disks in lenticular galaxies makes it difficult to compare them with other galaxies in terms of the volume gas density or the gas pressure in the disk plane.
The relative mass fraction of the dark halos in early disk galaxies also remains an open question. This is due, first and foremost, to difficulties in estimating rotation curves at large galactocentric distances based on stellar absorption lines. Fairly extended HI rotation curves have been obtained for a small number of lenticular galaxies. According to Noordermeer [5] and Noordermeer et al. [6], the rotational velocities in these galaxies often decrease toward the periphery, but they still imply the presence of fairly massive dark halos.
The large scatter of data in the Tully–Fisher relation (luminosity–rotation velocity diagram) for lenticular galaxies suggests substantial inhomogeneity of their properties (see, e.g., [7] and references therein). It also follows from the analysis of the velocity dispersions of old stars in the galaxy disks, which shows that in some early-type disk galaxies, the stellar velocity dispersion substantially exceeds the minimum level required for the gravitational stability of the disk, whereas, in later-type spiral galaxies, the velocity dispersion of the disk stars usually appears to be close to its threshold value [8]. However, the relatively low accuracy of the estimated velocity dispersions for disk stars beyond the bright bulges and problems with decomposing the velocity dispersion into , and components lead us to treat this conclusion as being tentative.
A comparison of the observational data with dynamical models in which the velocity dispersion of the disk stars—both in the plane of the disk and perpendicular to this plane—is close to the critical values for the dynamical stability of the disk provides insight into its dynamical evolution. A comparison of model () and observed () line-of-sight velocity dispersions for old disk stars can reveal one of three possible situations.
(1) . If interpreted in terms of disk stability, it would imply that the mass of the disk adopted in the model is overestimated, and that the disk must be “less massive” in order to satisfy the conditions of dynamical stability against perturbations in the plane of the disk and against bending perturbations.
(2) within the measurement errors. In this case, it appears that dynamical instabilities during the formation of the bulk of the disk mass have brought the stellar disk to a marginally stable state, where the stellar velocity dispersion is determined by the surface density of the disk, its rotational velocity as a function of galactocentric distance , and its internal structure. This appears to be the most common case among noninteracting spiral galaxies.
(3) ; i.e., the observed stellar velocity dispersion exceeds the model values corresponding to marginal disk stability. In this case, there is reason to believe that disk stars have acquired an excess (i.e., above the level required for stability of the disk) energy of random motions during their evolution, so that the disk has become overheated. This can be viewed as evidence that the stellar population of the disk subsystem of the galaxy has been subject to strong gravitational perturbations, for example, as a result of mergers of massive stellar or gaseous satellites, or of close interactions with nearby neighbors. In principle, the dynamical heating in the inner part of the galaxy can also be related to the disruption of a high-contrast stellar bar.
Constructing dynamical galaxy models that can yield estimates of the disk-to-halo mass ratio or disk thickness requires estimates of the rotation velocity and stellar velocity dispersion at the largest possible galactocentric distances, preferably along the main axes of the galaxy, to make it possible to determine the velocity dispersion along both the radial and vertical directions.
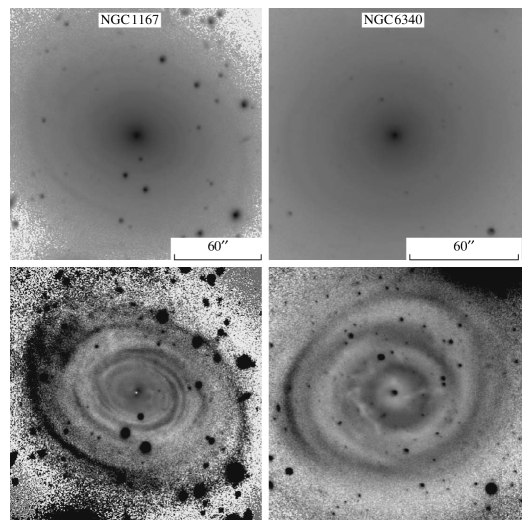
In this paper, we describe spectroscopic observations and the results of our construction of dynamical models for four early-type disk galaxies. Table 1 lists the basic parameters of these galaxies we have adopted. Figure 1 shows images of two of the galaxies with low-contrast structure taken with the 6-m telescope of the Special Astrophysical Observatory of the Russian Academy of Sciences. Table 2 gives a log of the observations.
The galaxy luminosities in Table 1 correspond to the total magnitudes from the HYPERLEDA database [11]. The last column gives the radius of the exponential stellar disk which was adopted in galaxy models. This radius corresponds to the isophotal radius , or the radius beyond which the photometric profile steepens.
2 DESCRIPTION OF INDIVIDUAL GALAXIES
NGC 1167. This galaxy contains a substantial amount of HI. According to the observations of Noordermeer et al. [14], the total HI mass is , but the gas is distributed over a very large area, so that the average surface density within the optical radius is less than pc2. The gas density remains below the critical value required for gravitational instability of the gaseous layer at all galactocentric distances , explaining the lack of observed star-forming regions in the galaxy. HI observations show an extended rotation curve, which slowly decreases after reaching its maximum and extends over 10 radial disk scales [5, 6]. The maximum rotational velocity of the disk is almost 400 km/s, making this one of the most rapidly rotating and massive disk galaxies known.
The total bulge luminosity of this galaxy is about one-third of the disk luminosity [15]. The bulge has a steep photometric profile (our -band measurements yield a Sersic parameter of ) so that its brightness dominates the central region, which has a size of several kpc. Starting from ( kpc), the photometric profile becomes exponential, and hence the bulge’s contribution to the observed brightness becomes small.
| Galaxy | Type | Tilt | Distance, | Luminosity, | Radial scale | , |
|---|---|---|---|---|---|---|
| angle | Mpc | of the disk , kpc | kpc | |||
| NGC 1167 | S0 | 36∘ [6] | 67 | 10 | 8.0 [6] | 31.9 |
| NGC 2273 | SBa | 50∘ [9] | 25.7 | 1.48 | 3.7 [10] | 15 |
| NGC 4150 | S0 | 56∘ [11] | 14 | 0.33 | 0.84 [12] | 3.34 |
| NGC 6340 | S0/a | 26∘ | 19.8 | 1.21 | 2.4 [13] | 9.6 |
| Galaxy | Slit | Date | , s | Seeing | PA |
|---|---|---|---|---|---|
| direction | |||||
| NGC 1167 | Major axis | 25/26.10.2005 | 8400 | 3′′ | 70∘ |
| Minor axis | 24/25.11.2005 | 9600 | 2.2 | 160 | |
| NGC 2273 | Major axis | 26/27.11.2005 | 8400 | 2.5 | 58 |
| Minor axis | 25/26.12.2005 | 4800 | 2.6 | 148 | |
| NGC 4150 | Major axis | 02/03.02.2005 | 9600 | 2.8 | 146 |
| Minor axis | 03/04.02.2005 | 7200 | 1.4 | 57 | |
| NGC 6340 | Major axis | 06/07.05.2005 | 7200 | 3 | 120 |
| Minor axis | 02/03.06.2006 | 9000 | 2.1 | 30 |
The images taken with the 6-m telescope of the Special Astrophysical Observatory reveal a system of ring-like arcs or spirals, which were also noted by Noordermeer [5]. The spirals are remarkably thin and smooth, without characteristic irregularities and bright knots (usually due to local star-forming regions in the galaxy’s spiral arms), suggesting a lack of O stars in these structures. The nature of the thin, smooth arms remains unclear. According to preliminary estimates we obtained by analyzing images of the galaxy, the color index is slightly () bluer in the spirals than in the surrounding disk, suggesting ongoing or recent star formation. If the initial stellar mass function in these spirals is anomalously steep slope, this could explain the lack of massive stars capable of producing extended, bright HII regions.
There are no other galaxies of comparable luminosity in the neighborhood of NGC 1167.
NGC 2273. This is a relatively isolated galaxy of moderate luminosity with a Seyfert nucleus and an unusually clear and symmetric structure in the central region, with a radius of (a bright bar and a pseudo-ring) and faint fuzzy spirals beyond it. The photometric profile of the galaxy cannot be described by a simple exponential law: it steepens at [10, 15]. Like NGC 1167, NGC 2273 contains a fairly large amount of gas [6, 16]. At , the brightness profile is dominated by the bulge. The total hydrogen mass is , but the average gas surface density is roughly as low as it is in NGC 1167 ( pc2) [6]. Moiseev et al. [9] and the SAURON team [17] analyzed the optical spectra of the galaxy in order to study the two-dimensional velocity distribution of gas and stars. In the bar region (), gas (but not the stars!) exhibits appreciable circular motions [9]. The rotation curve of the galaxy appears to have a local maximum near the center (), but Noordermeer et al. [6] believe that this may be due to noncircular gas motions. A small circumnuclear disk coincident with the molecular-gas disk [9] can be seen at the center of the galaxy, visible in emission lines.
NGC 4150. This is a low-luminosity S0 galaxy with a smooth photometric profile, which is fit well by an exponential law from the very center out to at least [12]. The central region shows traces of dust observed against the bright stellar background. UV observations reveal a bright nucleus, indicative of the presence of young stars [18]. The inner part of the galaxy exhibits small amounts of molecular and atomic gas [4]. Distance estimates for this galaxy are uncertain. Karachentsev et al. [19] suggested that NGC 4150 is located at the periphery of the Virgo cluster at a distance of about 20 Mpc. Sage and Welch [4] adopted a distance of 9.7 Mpc. We adopt here a distance of 14 Mpc. The kinematics of the inner region of the galaxy was studied earlier as part of the SAURON project [20]. The circumnuclear region () appears to host a counter-rotating disk.
NGC 6340. It is an S0/a galaxy, a member of a group, although there are no other galaxies of comparable luminosity in its immediate vicinity. The image of the galaxy features a bright inner disk—lens—and low-contrast, outer spiral arms. Long, conspicuous dust lanes of unusual shape can be seen in the central part of the disk, which are most likely located outside the plane of the disk. However, the most striking features are thin fragments of rings or spiral structures similar to those observed in NGC 1167, but somewhat more fuzzy and confined by a narrower zone of the disk. The galaxy has a bright bulge with a luminosity almost half the disk luminosity. However, the bulge is fairly strongly concentrated: its effective radii in the and bands are [13] and [21]. The kinematics of the stellar population in the inner region of the galaxy were analyzed by Bottema [22] and Corsini et al. [23]. Two-dimensional spectroscopy of the circumnuclear region of the galaxy revealed a chemically decoupled nucleus consisting of old stars with a relatively high abundance of heavy elements, and probably a circumnuclear polar ring located within pc [24, 25]. Following Sil’chenko [24], we adopt for this galaxy a distance of 19.8 Mpc.
3 OBSERVATIONS
We observed the galaxies with the SCORPIO multimode instrument [26] mounted at the primary focus of the 6-m telescope of the Special Astrophysical Observatory. We studied stellar kinematics using the slit spectrograph mode with a slit and a pixel EEV 42–40 CCD as the detector. The scale along the slit was /pixel. Observations were made in the wavelength range Å, which contains numerous absorption lines of the old stellar populations in the galaxies. The spectral resolution was 2.2 Å, which corresponds to an instrumental profile with km/s in terms of the velocity dispersion. The log of observations in Table 2 gives the dates of the observations, the exposures (), the average seeing, and the positional angle PA of the slit. We used an IDL-based software package to reduce the data. See [26] for a brief description of the algorithms employed.
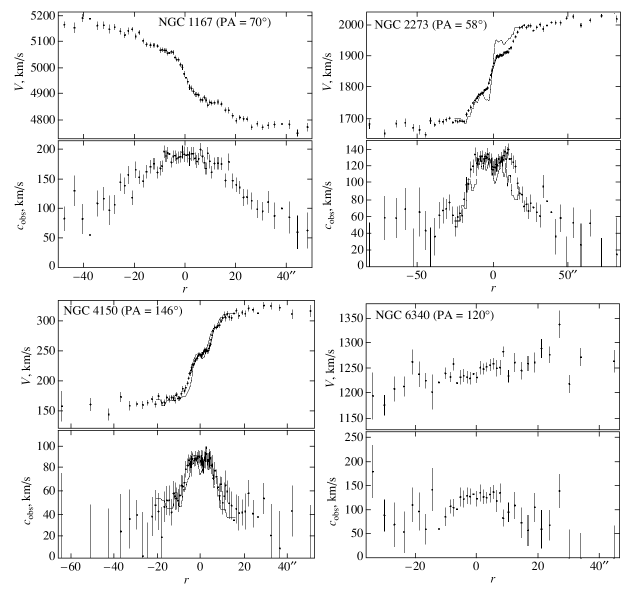
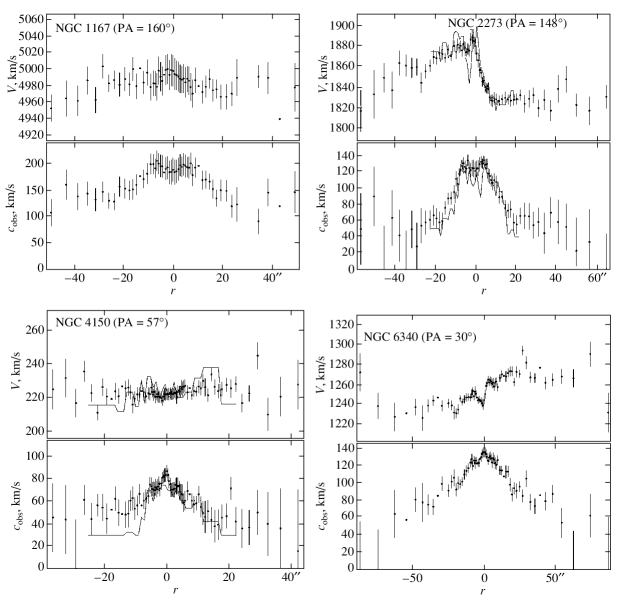
We used the classical cross-correlation technique to calculate the radial velocities and velocity dispersion of the stellar component; the algorithms and software employed are similar to those described by Moiseev [27]. As templates for the cross correlation, we used spectra of G8–K4 giants observed on the same nights as the galaxies. To increase the signal-to-noise ratio, we used adaptive binning (co-adding) of the spectra along the slit, with the integration window exponentially increasing with galactocentric distance. This technique makes it possible to compensate for the radial exponential decrease in the surface brightness in the galaxy disks. Figures 2 and 3 show the results of our measurements of the variations of the radial velocities and the velocity dispersions along the major and minor axes of the galaxies. For comparison, these figures also show the distributions of these parameters for NGC 2273 and NGC 4150 obtained by taking appropriate sections across the two-dimensional SAURON velocity and velocity-dispersion maps [17, 20]. It is obvious from this comparison that any systematic bias of our velocity-dispersion estimates does not exceed the measurement errors. The difference between the radial-velocity curves along the major axis of NGC 2273 is apparently due to the better spatial resolution of the SAURON data.
Note that some of our observations were made under unfavorable photometric conditions (some cloudiness), which prevented us from taking spectra of the outer regions of NGC 6340 along the major axis. However, the high accuracy of the measurements along the minor axis enabled us to obtain a detailed radial-velocity profile for the stellar population. The non-monotonic behavior of the velocity within of the center is immediately obvious, and is apparently due to the presence of a circumnuclear polar ring. The radial-velocity gradient is not zero at large galactocentric distances along the minor axis, and varies by about 40 km/s along the disk radius within (which is equivalent to about 6 kpc along the major axis). This behavior points toward a noticeable misalignment of the kinematic and photometric axes of the galaxy. According to preliminary estimates based on two spectral sections, the PA of the kinematic minor axis of the galaxy should be close to . However, the low accuracy of the measured velocity gradients along the spectrograph slit prevented reconstruction of the detailed shape of the rotation curve for this galaxy.
SCORPIO can be used to obtain not only spectra, but also direct images of objects in the field of view. Short-exposure ( s) images were used to aim the spectrograph slit at the galactic nucleus to within . We also took deeper images shown in Fig. 1 for the two galaxies NGC 1167 and NGC 6340, which exhibited unusual spiral structure on short exposures. The images were obtained by subtracting from the observed surface brightness the surface brightness in an axisymmetric model with a smooth brightness distribution consisting of a disk and bulge with elliptical isophotes.
4 GENERAL PRINCIPLES OF MODELING
We constructed dynamical models of the galaxies having the maximum possible disk masses and model rotation curves consistent with the observed rotation curves (maximum-disk models). We compared the observations to both the rotation curve calculated for this model and the minimum velocity dispersions for a collisionless disk that would be sufficient to maintain its stability against radial and bending perturbations. An analysis of the dynamical evolution of the disks which follow from numerical simulations can be used to obtain stable models without resort to approximate and insufficiently trustworthy local analytical criteria. We used a three-component model (disk, halo, and bulge) whose component parameters yielded a circular velocity of
| (1) |
where , , and are the corresponding contributions of individual components to the circular velocity.
The dynamical models of collisionless (stellar) disks are based on numerical integration of the equations of motion of gravitationally interacting particles using the TREEcode program, taking into account the external field of the “hard” bulge and halo. This means that the parameters of the spheroidal subsystems are considered to be stationary, and are described by free parameters of the model. For NGC 4150, we also considered a model with a “live” bulge, which enabled us to take into account the bulge contribution not only to the gravitational potential, but also to the stellar velocity dispersion. However, we found no fundamental differences: the velocity dispersion remained virtually unchanged beyond the effective bulge radius.
We specified the disk surface density in the form
| (2) |
at galactocentric distances (Table 1). Here, is the radial disk scale estimated from the brightness distribution of the galaxy.
To reduce ambiguity in choosing a model that was consistent with the observed rotation curve, we further assumed that the radial scale for the disk surface-density variations in the region covered by measurements is close to the radial scale of the disk brightness known from optical photometry (Table 1).
We started the modeling with the initial disk in an unstable (subcritical) state with a Schwartzschild (ellipsoidal) velocity distribution, such that the resulting collisionless disk was close to the stability threshold. Hence, the resulting models represent models of the maximum, marginally stable disks. The real disks may have smaller masses than those obtained in our models without violating the stability condition. Estimations of the masses of stellar disks based on the condition that they be gravitationally stable [22, 28, 29] show that the maximum-disk model constructed without allowance for the velocity dispersion may overestimate the circular disk velocities by 20–30. Note, that the estimates of the disk masses obtained using another method, namely hydrodynamical modeling of the gas motions in the region of spiral arms, suggest that only the inferred disk mases of slowly rotating galaxies ( km/s) will be substantially lower than their “maximum” masses [30].
We constructed an equilibrium dynamical model to calculate radial profiles of the circular rotational velocities , the rotational velocities of the stars (particles in the model), and the velocity dispersions , , and , which ensure the marginal stability of the disk. To compare our models with the observational data, we calculated the model line-of-sight velocity dispersions:
| (3) |
where is the inclination of the disk to the plane of the sky and is the angle between the slit direction and the major axis projected onto the plane of the galaxy.
The technique of constructing a galaxy model whose disk is at the limit of stability against both gravitational perturbations in the plane of the disk and bending perturbations is described by Khoperskov et al. [28, 31] and Tyurina et al. [32]. The corresponding computations covered five to ten orbital-rotation periods at the outer disk rim, ensuring the establishment of a stationary state in which the velocity dispersion has virtually stopped changing and has maintained its average value over several rotational periods. We used an iterative algorithm with the initial velocity dispersion successively approximating the stability limit, as developed by Khoperskov et al. [28]. The iterative approach is based on a series of successive computations involving particles, each starting with an initial velocity dispersion that is somewhat closer to the critical value than in the previous case. To this end, we chose the initial distribution of the velocity dispersions and to be between the initial and final values obtained in the previous simulation.
We also performed control computations with particles to monitor computational effects in the inferred radial distributions of the disk parameters at the stability limit. The results corroborated our earlier conclusion [28] that models with are adequate to determine the stability limit.
In general, we subdivided the construction of the model stable equilibrium disks into the following stages.
(1) Estimating the components of the velocity dispersion along three axes [see (3)] by analyzing the observed velocity dispersions along the major and minor axes of the galaxy. As the additional condition required for this task, we adopted the Lindblad relation between the radial and azimuthal components of the velocity dispersion, which was tested in numerous numerical simulations: , where is the epicyclic frequency.
(2) Determining the circular-velocity curve from the observed rotational velocities of the stars, , and the velocity dispersion . However, when available, we adopted the gas rotation curve as the initial circular-velocity curve.
(3) Decomposing the rotation curve into components representing the bulge, disk of finite thickness and halo (the maximum-disk model).
(4) Choosing the initial conditions for the description of the disk in the subcritical state, with the derived component parameters used as a first approximation.
(5) Numerically computing the dynamical evolution of the disk to obtain a model for the marginally stable disk whose circular-velocity curve agrees with the curve obtained from the observations.
(6) Computing the radial dependence of the line-of-sight velocity dispersion for the resulting model with allowance for the inclination of the disk.
(7) Comparing the model and observed line-of-sight velocity dispersions.
(8) Computing the disk parameters: its mass, average thickness (for the observed velocity dispersion), and mass-to-luminosity ratio. Estimating the fractional mass of the dark halo.
We did not compare the model velocity dispersions for disk stars with the corresponding observed dispersions for central regions of the galaxy, since both the form of the rotation curve and the velocity dispersion of the disk stars are determined very uncertainly in the bulge region.
5 MODELS OF THE GALAXIES
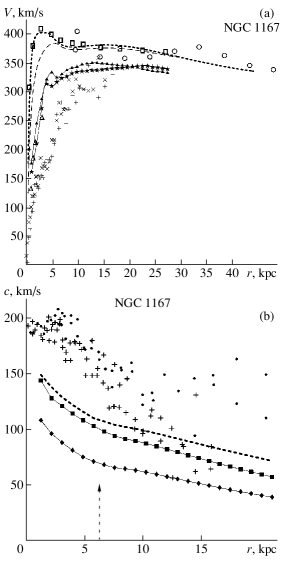
NGC 1167. We constructed three models for this galaxy (a, b, c) to see the effect of the choice of parameters on the final result. Here, n1167-a is the maximum-disk model; n1167-c can be thought of as the minimum-disk model, which corresponds to an mass-to-luminosity ratio of , which is certainly lower than the mass-to-luminosity ratios of stellar systems without active star formation and with normal stellar population; and n1167-b has an intermediate disk mass. All three models reproduce the rotation curve of the galaxy fairly well.
Figure 4a compares the observed rotational velocities with the rotational velocities for the models. The n1167-a and n1167-b models differ appreciably only in the central region, due to their different bulge concentrations. The central disk surface densities are almost the same in these two models: and /pc2. The halo mass is somewhat higher in the second model: the halo-to-disk mass ratios within are equal to and . In the n1167-c model, the mass of the halo exceeds that of the disk.
Figure 4b shows the distributions of the observed and model estimates of the line-of-sight velocity dispersion for the marginal-disk model n1167-a. It is obvious that the velocity dispersion in this model is substantially lower than the corresponding observed values. The velocity dispersion becomes even lower if we decrease the disk mass (curve shown by diamonds in Fig. 4b). In the n1167-c model, the observed disk is overheated in terms of the velocity dispersion by a factor of almost three compared to the marginally stable state. A comparison of our maximum-disk model with the observed distribution of the velocity dispersion along the minor axis confirms that the disk is significantly overheated.

Below we analyze only the galaxy models with the maximum disk mass.
We determined the disk half-thickness from the dynamical model, with the stellar density distribution in the direction approximated by the law , which is valid for a self-gravitating isothermal disk. The average disk half-thickness of this galaxy is kpc if calculated for the maximum-disk model. Thus, the disk is fairly thick, both in absolute terms and compared to its radial scale: . For comparison, the half-density half-thickness of the stellar disk in the solar neighborhood is about 350 pc [33], which corresponds to pc.
NGC 2273. As in the previous case, an HI rotation curve is available for NGC 2273 [5, 16]. We used velocity-field measurements kindly provided by E. Noordermeer to construct the rotation curve outside the galaxy bulge with the fixed disk inclinations adopted in this paper (Table 1). Figure 5 shows the rotation curves and velocity-dispersion distributions based on the observational data. The HI rotation curve exhibits a local maximum at a galactocentric distance of several kpc, but the model curve reproduces it poorly. The stellar-velocity field in the very central part of the galaxy also suggests the possible presence of a local maximum, but much closer to the center—at a galactocentric distance of pc [34], which corresponds to the circumnuclear disk.
A remarkable dynamical feature of this galaxy is that the observed gas velocity (small circles in Fig. 5a) at kpc differs only slightly from the rotational velocity of the stars (straight and slanted crosses in Fig. 5a). In the case of an axisymmetric, stationary disk, no model with a dynamically cool gaseous disk can reproduce this behavior: for the usually adopted gas velocity dispersion of 10 km/s, the stellar rotation curve should be lower than the gas rotation curve by 20–30 km/s. The SAURON-VII data [17] also confirm the high rotational velocity of the stellar component (the diamond and triangle corresponding to the SAURON archive data in Fig. 5a).
The observed similarity of the rotational velocities of the old stars and gas can, in principle, be explained if the turbulent velocity of the gaseous medium is close to the stellar velocity dispersion (30–70 km/s). In this case, the HI forms a thick disk that is roughly the same as the disk of old stars. However, the origin of such a dynamical peculiarity of the atomic-gas layer is by no means evident. The galaxy lacks a sufficient number of young stars to impart the required energy to the gas. The similarity in the old-star and gas rotational velocities is more likely due to the complex internal structure observed in the central part of the galaxy (a high-contrast bar and short spiral arms), which may be responsible for non-circular gas motions. In this case, the rotational velocity of the stellar disk should be preferred over that of the gaseous disk when constructing a model for the galaxy.
Figure 5b compares the observed line-of-sight stellar velocity dispersions and the velocity dispersions obtained for the marginally stable disk model. In this model, the component masses within kpc are , , and . The estimated velocity dispersion corresponding to the stability limit decreases with decreasing disk mass fraction of the model. The significant difference between and in the central region of the galaxy (up to 40 km/s) appears to be due to stars of the dynamically “hotter” bulge; i.e., it does not refer to the disk. At galactocentric distances kpc, the observed velocity dispersion is close to the expected velocity dispersion for this model. The disk component may be slightly “overheated” at the periphery of the stellar system ( kpc), but we must bear in mind the large scatter of the estimated velocity dispersions. We can thus conclude that a model with a marginally stable disk having a close-to-maximum mass is consistent with the observational data for this galaxy.
Note that the adopted parameters for the model with a marginally stable disk can reproduce both the rotation curve and the formation of a bar in the galaxy. In numerical simulations, a bar forms in the inner part of the disk during one to two rotational periods as the disk approaches the quasi-stationary state, as a result of the disk’s instability against the bar-forming mode. However, the observed spiral structure (fragments of thin rings) cannot be reproduced in collisionless models; a cool component (gas) is evidently required for such structure to form.
The average vertical disk scale height in NGC 2273 calculated in the maximum-disk model is 0.8 kpc, which is twice this parameter in the Milky Way Galaxy.
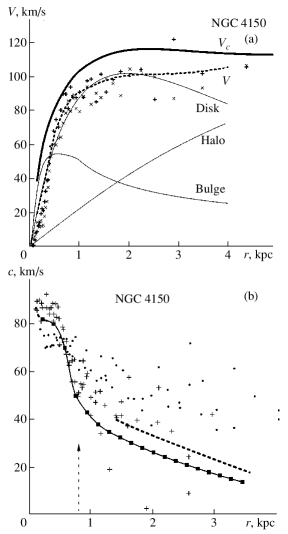
NGC 4150. Figure 6a illustrates the radial distributions of the rotational velocity of the stellar disk (various symbols), the circular rotational velocity calculated for the maximum-disk model (solid bold curve), and the results of decomposing the circular velocity for this model (thin solid curves). The dynamical model of this galaxy was calculated with a “live” bulge, where the distributions of mass and particle velocities could evolve with time.
In the maximum-disk model, the decomposition of the rotation curve yields a central disk surface density of pc2 and a component-mass ratio of . The bulge mass fraction in this galaxy is low, , but the observed stellar kinematics cannot be explained by allowing for the bulge.
Figure 6b shows the velocity dispersion estimates along the major and minor axes for the galaxy model considered together with the observational data. Again, the stellar disk is appreciably overheated. The disk of the galaxy is fairly thick, with a vertical-to-radial scale ratio of no less than 0.32. The velocity dispersion of the “live” bulge in the model agrees with the observed velocity dispersion at kpc.
The photometric data imply a very short (less than 1 kpc) radial disk scale for this galaxy. Given the slow radial decrease of the stellar velocity dispersion, this implies that the thickness of the stellar disk increases significantly with galactocentric distance, so that the estimate listed in Table 3 below should not be taken too literally. The disk half-thickness within 1 kpc from the center of this galaxy does not exceed 400 pc (which is still greater than the corresponding parameter for the Milky Way), but it becomes equal to the radial disk scale at a galactocentric distance of several kpc. Starting from kpc, the disk proper appears to be absent. Indeed, the photometric profile becomes flat at these galactocentric distances [12].

NGC 6340. As in NGC 4150, rotation was measured only for the stellar component. Only the gradient of the rotational velocity along the major axis can be confidently estimated (see Section 3). The estimates of the stellar velocity dispersion reported both here and in the earlier paper of Bottema [35] are characterized by a large scatter. The dispersion at the center of the galaxy is 130 km/s, but this refers to the bulge, not the disk. The velocity dispersion decreases considerably with increasing . Judging from the photometric profile of the galaxy [13], the disk dominates in brightness beginning from kpc.
Figure 7a shows the model rotation curves and measured rotational velocities of the stellar disk. As we pointed out above, the stellar-velocity measurements for this galaxy prevent the reconstruction of the form of the rotation curve. Due to the lack of direct estimates of the rotational velocity of the gaseous component for this galaxy, we accepted an overall form of the rotation curve for the disk of this galaxy that makes it consistent with the adopted radial scale . The maximum of the curve was conventionally set to be equl to the HI rotational velocity according to the HYPERLEDA database— km/s (after reducing the latter to the adopted inclination inferred from the outer isophotes).
Figure 7b shows the radial dependences of the line-of-sight velocity dispersion. At galactocentric distances 2–8 kpc, the average estimated velocity dispersion based on measurements made along the minor axis is no less than 60 km/s, suggesting that the disk is rather “hot.” In the maximum-disk model, the central disk surface brightness is pc2. The velocity dispersion in the marginally stable disk model is much lower than , confirming the overheated state of the disk component. The velocity-dispersion estimates extend beyond three radial scales along the minor axis, far beyond the bulge. These estimates suggest an approximately twofold excess of the observed stellar velocity dispersion at the far edge of the disk over the minimum required to maintain gravitational stability in the maximum-disk model. Other evidence suggesting that the stellar system is overheated includes the large systematic difference between the rotational velocities of the stellar disk inferred from observations and implied by the marginally stable disk model (Fig. 7a).
| Model | , | , | , | , | , | , | ||
|---|---|---|---|---|---|---|---|---|
| pc2 | kpc | |||||||
| n1167-a | 38.7 | 12.0 | 26.0 | 1400 | 0.51 | 3.9 | 2.8 | 0.35 |
| n2273-a | 8.69 | 1.08 | 6.38 | 1100 | 0.65 | 5.9 | 0.8 | 0.23 |
| n4150-a | 0.53 | 0.046 | 0.32 | 1330 | 0.56 | 1.6 | 0.78 | 0.93 |
| n6340-a | 4.54 | 0.84 | 3.53 | 1380 | 0.66 | 3.8 | 1.3 | 0.54 |
6 DISCUSSION AND CONCLUSIONS
Dynamical state of the disk. Of the four galaxies considered, the observed parameters of only one—the SBa galaxy NGC 2273—are consistent with the hypothesis that the stellar disk was not subject to dynamical heating, with the stellar velocity dispersion corresponding to the minimum level sufficient to maintain a quasi-stationary equilibrium state. In this respect, NGC 2273 resembles many later-type spiral galaxies, whose stellar velocity dispersions are close to their threshold levels throughout a considerable fraction of the disk (see, e.g., [8, 22, 36, 37]).
The disks in the other three (lenticular) galaxies are “hotter” even for the maximum allowed mass. This can be viewed as evidence that these galaxies were subject to external gravitational perturbations in the past, most likely as a result of close interactions with nearby galaxies or mergers of fairly large satellites. Numerical simulations (see, e.g., [38]) confirm the efficiency of the latter process. Gravitational perturbations of the gaseous component of the disk can also explain why these galaxies have rapidly exhausted their interstellar-gas reserves due to a burst of star formation, thereby acquiring the properties characteristic of lenticular systems.
Estimates of , and the thickness of the stellar disk. In a disk that is stable against bending perturbations, perturbations in its plane due, e.g., to stochastic spiral arms, would primarily increase , and hence decrease . Merging of satellites and their passage across the disk should result in a more isotropic distribution of the velocity dispersion. In this case, heating occurs mostly via bending perturbations of the disk (see Ardi et al. [38] for the discussion of this issue).
For all four galaxies, the velocity-dispersion components and and their ratio calculated in the marginal-disk model (Fig. 8) decrease with galactocentric distance. Note that does not decrease rapidly enough to keep the marginally stable disk thickness constant: it increases with in all cases. The same is true for the measured stellar velocity dispersions in the galaxies, although the insufficient accuracy of the velocity-dispersion estimates prevented us from reconstructing the detailed behavior of the radial variation of from the observations. However, we estimated the average values by analyzing the variation of the velocity dispersion along the major and minor axes for three of the four galaxies observed—NGC 1167, NGC 2273, and NGC 4150. We found this ratio to be 0.6–0.8 in the interval (1–2) for all three galaxies, and to decrease to 0.4–0.5 at (2.5–3) (for NGC 2273 and NGC 4150).

Table 3 lists the average disk half-thicknesses within the maximum galactocentric radius covered by the observations for the galaxies considered. We calculated these half-thicknesses for the inferred and vertical density profile . In all cases, the disks turned out to be thicker than the disk of the Milky Way. The average estimate for NGC 4150 should not be taken at face value, it reduces to a half the tabulated value in the inner region of the galaxy [(1–1.5)] (see previous Section). The disk of this galaxy is very “chubby,” strongly widens with , so that it grades into the halo at a distance of several radial disk scales.
Note that the inferred values are fairly typical for the thick disks of spiral galaxies, where they coexist with more massive thin disks of galaxies like those observed in the Hubble Space Telescope Ultra Deep Field in early stages of their formation [39].
Estimates of the masses of the disks and halos. Table 3 lists estimates of the masses of these two main components of the disk galaxies and the mass-to-luminosity ratio for the stellar disk found for the maximum-disk model. It is evident from the estimates obtained that the mass of the dark halo is fairly high, even when calculated in the maximum-disk model: the ratio of the halo mass to the total mass of the stellar components (disk bulge) within the photometric radius is equal to 0.5–0.8. Similar or even higher ratios are also observed in later-type galaxies [29, 40]. Thus, lenticular galaxies do not differ strongly from galaxies of other types in terms of their dark-mass content.
The mass-to-luminosity ratio for the disks of the four galaxies are several solar units, which, at least for three of these objects (all except NGC 4150), is quite consistent with the ratio expected for the old stellar population. For NGC 4150, in solar units. Although this ratio was inferred for a model with the maximum disk mass, it is a factor of two to three lower than expected for the othergalaxies. It is unclear why the ratio is so low; such values are rarely found in galaxies dominated by their old stellar population. Either the disk of this galaxy is deficient in low-mass stars (due to a shallow initial mass function), or the adopted model underestimates the disk mass, e.g., due to an overestimation of the inclination . However, the latter possibility is unlikely, since the inclination is fairly large (56∘), if our initial assumption that the structure of the disk is axisymmetric is correct.
Recall that NGC 4150 ranks well below the other three galaxies in terms of its luminosity, mass (by about an order of magnitude), and size. The stellar disk of this galaxy appears to have a low volume density. The formation history and evolution of the disk in this case may have differed from those for the disks in the other more massive galaxies.
ACKNOWLEDGMENTS
This paper is based on observational data obtained with the 6-m telescope of the Special Astrophysical Observatory of the Russian Academy of Sciences, which is operated with financial support from the Ministry of Science of the Russian Federation (registration number 01-43). Some of the observations at the 6-m telescope were carried out by A.N. Burenkov and S.S. Kaĭsin. We are grateful to Edo Nordermeer for sharing his digitized galaxy velocity fields for NGC 2273 and NGC 4150 and to Eric Emsellem for kindly providing velocity fields and stellar velocity dispersion from the SAURON archive. This work was supported by the Russian Foundation for Basic Research (project nos. 07-02-00792 and 07-02-01204).
References
- (1) H. Butcher and A. Oemler, Astrophys. J. 219, 18 (1978).
- (2) H. Butcher and A. Oemler, Astrophys. J. 285, 426 (1984).
- (3) C. Daniel and A. J. Zabludoff, Astrophys. J. 621, 201 (2005).
- (4) L. J. Sage and G. A. Welch, Astrophys. J. 644, 850 (2006),
- (5) E. Noordermeer, PhD Thesis (Rijkuniversitet, Groningen, 2004).
- (6) E. Noordermeer, J. M. van der Hulst, R. Sancisi, et al., Mon. Not. R. Astron. Soc. 376, 1513 (2007).
- (7) A. G. Bedregal, A. Aragon-Salamanca, and M. R. Merrifield, Mon. Not. R. Astron. Soc. 373, 1125 (2006).
- (8) A. V. Zasov, A. V. Khoperskov, and N. V. Tyurina, Pis’ma Astron. Zh. 30, 653 (2004) [Astron. Rep. 30, 593 (2004)].
- (9) A. V. Moiseev, J. R. Valdres, and V. H. Chavushyan, Astron. Astrophys. 421, 433 (2004).
- (10) P. Erwin, Mon. Not. R. Astron. Soc. 364, 283 (2005).
- (11) HyperLeda Database, http://leda.univ-lyon1.fr.
- (12) T. Bremnes, B. Binggeli, and P. Prugniel, Astron. Astrophys., Suppl. Ser. 141, 211 (2000).
- (13) M. Sanchez-Portal, A. Diaz, E. Terlevich, and R. Terlevich, Mon. Not. R. Astron. Soc. 350, 1087 (2004).
- (14) E. Noordermeer, J. M. van der Hulst, and R. Sancisi, Astron. Astrophys. 442, 137 (2005).
- (15) E. Noordermeer, and J. M. van der Hulst, Mon. Not. R. Astron. Soc. 376, 1480 (2007).
- (16) W. van Driel and R. J. Buta, Astron. Astrophys. 245, 7 (1991).
- (17) J. Falcon-Barroso, R. Bacon, M. Bureau, et al., Mon. Not. R. Astron. Soc. 369, 529 (2006).
- (18) A. Gil de Paz, S. Boissier, B. F. Madore, et al., astro-ph/0606440 (2006).
- (19) I. D. Karachentsev, M. E. Sharina, A. E. Dolphin, et al., Astron. Astrophys. 398, 467 (2003).
- (20) E. Emsellem, M. Cappelari, R. F. Peletier, et al., Mon. Not. R. Astron. Soc. 352, 721 (2004).
- (21) W. E. Baggett, S. M. Baggett, and K. S. J. Anderson, Astrophys. J. 116, 1626 (1998).
- (22) R. Bottema, Astron. Astrophys. 275, 16 (1993).
- (23) E. M. Corsini, A. Pizzella, L. Coccato, et al., Astron. Astrophys. 408, 873 (2003).
- (24) O. K. Sil’chenko, Astron. J. 120, 721 (2000).
- (25) O. K. Sil’chenko, Astrophys. J. 641, 929 (2006).
- (26) V. L. Afanas’ev and A. V. Moiseev, Pis’ma Astron. Zh. 31, 214 (2005) [Astron. Lett. 31, 194 (2005)].
- (27) A. V. Moiseev, Bull. Spec. Astrophys. Obs. 51, 11 (2001).
- (28) A. V. Khoperskov, A. V. Zasov, and N. V. Tyurina, Astron. Zh. 80, 387 (2003) [Astron. Rep. 47, 357 (2003)].
- (29) A. V. Khoperskov, A. V. Zasov, and N. V. Tyurina, Astron. Zh. 78, 213 (2001) [Astron. Rep. 45, 180 (2001)].
- (30) T. Kranz, A. Slyz, and H.-W. Rix, Astrophys. J. 586, 143 (2003).
- (31) A. V. Khoperskov, A. V. Zasov, and N. V. Tyurina, Astron. Zh. 80, 483 (2003) [Astron. Rep. 47, 443 (2003)].
- (32) N. V. Tiurina, A. V. Khoperskov, and D. V. Bizjaev, in Bending Instability in Galaxies: The Stellar Disk Thickness and the Mass of Spheroidal Component, Ed. by A. M. Fridman et al., Astrophys. Space Sci. Library 337, 291 (2006).
- (33) C. A. Narayan and C. J. Jog, Astron. Astrophys. 394, 89 (2002).
- (34) F. K.B. Barbosa, T. Storchi-Bergmann, R. C. Fernandes, et al., Mon. Not. R. Astron. Soc. 371, 170 (2006).
- (35) R. Bottema, Astron. Astrophys. 221, 236 (1989).
- (36) A. V. Zasov, D. V. Bizyaev, D. I. Makarov, and N. V. Tyurina, Pis’ma Astron. Zh. 28, 599 (2002) [Astron. Lett. 28, 527 (2002)].
- (37) A. V. Zasov and D. V. Bizyaev, in Galactic and Stellar Dynamics, Ed. by C. Boily, P. Pastis, et al., EAS Publ. Ser. 10, 121 (2003).
- (38) E. Ardi, T. Tsuchiya, and A. Burkert, Astrophys. J. 596, 204 (2003).
- (39) D. M. Elmegreen and B. G. Elmegreen, Astrophys. J. 650, 644 (2006).
- (40) A. V. Khoperskov, Pis’ma Astron. Zh. 28, 723 (2002) [Astron. Lett. 28, 651 (2002)].
Translated by A. Dambis