11email: pnoterda@eso.org, cledoux@eso.org 22institutetext: UPMC Paris 06, Institut d’Astrophysique de Paris - CNRS, 98bis Boulevard Arago, F-75014, Paris, France
22email: petitjean@iap.fr 33institutetext: Inter-University Centre for Astronomy and Astrophysics, Post Bag 4, Ganesh Khind, Pune 411 007, India
33email: anand@iucaa.ernet.in
Molecular hydrogen in high-redshift Damped Lyman- systems: The VLT/UVES database††thanks: Based on data gathered at the European Southern Observatory (ESO) using the Ultraviolet and Visual Echelle Spectrograph (UVES) installed at the Very Large Telescope (VLT), Unit-2 (Kueyen), on Cerro Paranal, Chile.
Abstract
Aims. We present the current status of ongoing searches for molecular hydrogen in high-redshift () Damped Lyman- systems (DLAs) capitalising on observations performed with the ESO Very Large Telescope (VLT) Ultraviolet and Visual Echelle Spectrograph (UVES).
Methods. We identify 77 DLAs/strong sub-DLAs, with and , which have data that include redshifted H2 Lyman and/or Werner-band absorption lines. This sample of H i, H2 and metal line measurements, performed in an homogeneous manner, is more than twice as large as our previous sample (Ledoux et al. 2003) considering every system in which searches for H2 could be completed so far, including all non-detections.
Results. H2 is detected in thirteen of the systems, which have molecular fractions of values between and , where HH. Upper limits are measured for the remaining 64 systems with detection limits of typically H, corresponding to . We find that about 35% of the DLAs with metallicities relative to solar [X/H (i.e., 1/20th solar), with X = Zn, S or Si, have molecular fractions , while H2 is detected – regardless of the molecular fraction – in % of them. In contrast, only about 4% of the [X/H DLAs have . We show that the presence of H2 does not strongly depend on the total neutral hydrogen column density, although the probability of finding is higher for than below this limit (19% and 7% respectively). The overall H2 detection rate in DLAs is found to be about 16% (10% considering only detections) after correction for a slight bias towards large . There is a strong preference for H2-bearing DLAs to have significant depletion factors, [X/Fe. In addition, all H2-bearing DLAs have column densities of iron into dust grains larger than Fe, and about 40% of the DLAs above this limit have detected H2 lines with . This demonstrates the importance of dust in governing the detectability of H2 in DLAs. Our extended sample supports neither the redshift evolution of the detection fraction of H2-bearing DLAs nor that of the molecular fraction in systems with H2 detections over the redshift range .
Key Words.:
cosmology: observations – quasars: absorption lines – galaxies: ISM – ISM: molecules1 Introduction
Damped Lyman- systems (DLAs) were discovered in the seventies (e.g., Lowrance et al., 1972; Beaver et al., 1972; Carswell et al., 1975; Wright et al., 1979) and identified afterwards as redshifted damping absorptions from large column densities of neutral atomic hydrogen (Smith et al., 1979).
Numerous DLAs, with atoms cm-2, have been discovered through large dedicated surveys (e.g., Wolfe et al., 1986) and more recently thanks to the huge number of quasar spectra available from the Sloan Digital Sky Survey (Prochaska et al., 2005). Because DLAs contain most of the neutral hydrogen available for star formation in the Universe (Wolfe et al., 1986; Lanzetta et al., 1991) and are associated with numerous metal absorption lines, they probably arise in the interstellar medium of protogalaxies, progenitors of present-day galaxies (see, e.g., Wolfe & Prochaska, 2000; Haehnelt et al., 2000; Wolfe et al., 2005). Our understanding of DLAs is mainly based on the study of low-ionisation metal absorptions (e.g., Prochaska & Wolfe, 2002) but also high-ionisation species (Lu et al., 1996; Wolfe & Prochaska, 2000; Fox et al., 2007a, b) and, in a few cases, molecular absorptions (e.g., Ledoux et al., 2003). The latter are not conspicuous however in contrast to what is seen in the Galaxy and, for a long time, only the DLA towards Q 05282505 was known to contain H2 molecules (Levshakov & Varshalovich, 1985). H2-bearing DLAs are nevertheless crucial to understand the nature of DLAs because molecular hydrogen is an important species to derive the physical conditions in the gas (see, e.g., Tumlinson et al., 2002; Reimers et al., 2003; Hirashita & Ferrara, 2005; Srianand et al., 2005; Cui et al., 2005; Noterdaeme et al., 2007b).
The first systematic search for molecular hydrogen in high-redshift () DLAs was carried out using the Ultraviolet and Visual Echelle Spectrograph (UVES) at the Very Large Telescope (VLT) (Ledoux et al., 2003). It consisted of a sample of 33 DLAs with H2 detected in eight of them. Molecular fractions were found to lie in the range with HH. Upper limits of typically H cm-2 (corresponding to ) were measured in the other systems. More recently, we noted a correlation between the presence of molecular hydrogen and the metallicity of high-redshift DLAs (Petitjean et al., 2006). High molecular fractions () were found in about 40% of the high-metallicity DLAs ([X/H solar) whilst only % of the [X/H DLAs have . Other papers by our group focused on specific detections. We presented the analysis of three systems with low molecular fractions, i.e., , one of them having a low metallicity (Noterdaeme et al., 2007a), and the H2-bearing DLA with, to date, the highest redshift, at towards Q 14412737 (Ledoux et al., 2006b). We note that a possible detection of H2 in a DLA towards a Gamma-ray Burst (GRB) afterglow has been reported recently (Fynbo et al., 2006). However, the origin of DLAs at the GRB host-galaxy redshift is very likely to be different from those observed in QSO spectra (e.g., Jakobsson et al., 2006; Prochaska et al., 2007a).
We present here the whole sample of UVES high-redshift QSO-DLAs for which the wavelength range where H2 lines are redshifted is covered by the available spectra. This sample is more than twice as large as in our previous study (Ledoux et al., 2003). We present the observations and the UVES DLA sample in Sect. 2 and provide comments on individual absorbers in Sect. 3. We discuss the overall population in Sect. 4 and results in Sects. 5 to 8. We conclude in Sect. 9.
2 Observations and sample
All the quasars in our sample were observed with the Ultraviolet and Visual Echelle Spectrograph (UVES, Dekker et al., 2000) mounted on the ESO VLT-UT 2 (Kueyen) 8.2 m telescope on Cerro Paranal, Chile. We have used our UVES database to build up a sample of 77 DLAs/strong sub-DLAs along 65 lines of sight, hereafter called sample . The systems were selected as having cm-2, and redshifts so that at least part of the wavelength range into which H2 absorption lines are expected to be redshifted, is covered. Systems for which the flux at the wavelengths of all redshifted H2 lines is zero as a consequence of the presence of an intervening Lyman-limit system located at a higher redshift were rejected. Systems for which the Ly- forest is so crowded that no meaningful upper limit on (H2) could be derived were also excluded from the final sample.
Sample comprises a total of 68 DLAs () and nine strong sub-DLAs () according to the common definition of DLAs (; Wolfe et al., 1986). Our lower limit on (H i) for sub-DLAs is only slightly lower than the classical definition of DLAs ensuring that these absorbers are mostly neutral and share the same physical nature as classical DLAs (Viegas, 1995).
Most of the systems in sample (53 out of 77) come from the sample of Ledoux et al. (2006a). This sample is mainly drawn from the follow-up of the Large Bright QSO Survey (LBQS, Wolfe et al., 1995) and has been observed between 2000 and 2004 in the course of our systematic search for molecular hydrogen at (see also Petitjean et al., 2000; Ledoux et al., 2003). This comprises 46 bona-fide DLAs and seven strong sub-DLAs.
In addition to this sample, we are considering UVES data for 13 absorbers (11 DLAs and two strong sub-DLAs) from the Hamburg-ESO DLA survey (Smette et al., 2005), seven DLAs from the CORALS survey (Akerman et al., 2005), and four DLAs mainly from our own observing runs. Among the latter systems, the and 3.774 DLAs towards Q 01310345 and the DLA towards Q 06425038 were observed in visitor mode on September 17-20 2004, under Prog. ID 073.A-0071 (PI: Ledoux). On the other hand, the DLA towards Q 09510450 was observed in service mode on January 26-27 and February 19-21, 2004, under Prog. ID 072.A-0558 (PI: Vladilo).
We have reduced all the data including those retrieved from the ESO archive in an homogeneous manner using the UVES pipeline (Ballester et al., 2000), which is available as a dedicated package of the ESO MIDAS data reduction system. The main characteristics of the pipeline are to perform a robust inter-order background subtraction for master flat-fields and science frames and an optimal extraction of the object signal subtracting the sky spectrum and rejecting cosmic rays simultaneously. The wavelength scale of the reduced spectra was converted to vacuum-heliocentric values. Each spectrum, corresponding to different instrument settings, was rebinned to a constant wavelength step. No further rebinning was performed during subsequent data analysis. Individual exposures were then weighted, scaled and combined altogether.
Total neutral hydrogen column densities have been measured from Voigt-profile fitting of the damped Lyman- and/or Lyman- lines (see Ledoux et al. 2006a; Smette et al., in prep). Most of the metallicity and depletion measurements are from Ledoux et al. (2006a) except when more recently re-measured (see details in footnote of Table LABEL:sumtable). Apart from the DLAs towards Q 01310345 and Q 09510450 (for which abundances were taken from Prochaska et al. (2007b) because UVES observations did not allow a sufficient number of metal lines to be covered), we (re)determined all metal column densities by the homogeneous fitting of Voigt-profiles to non-saturated absorption lines. This includes the systems from the Hamburg-ESO and CORALS DLA surveys. Metallicities were determined using the zinc abundance (when Zn ii is detected), or from the abundances of sulphur or silicon. No ionisation correction has been applied. Zinc and sulphur are known to be little depleted into dust grains. Silicon, in turn, is probably mildly depleted and has been used only in cases where Zn and S are not detected. The results are summarised in Table LABEL:sumtable. Abundances are given relative to solar, i.e., [X/HXH (X/H)⊙. Solar abundances as listed in Morton (2003), based on meteoritic data from Grevesse & Sauval (2002), were adopted.
3 Comments on individual systems
Q 00002619, : Levshakov et al. (2000, 2001) reported a tentative detection of H2 in this system. However, they detected only two weak absorption features in the Lyman- forest, identified as H2 W2-0 Q1 and L4-0 R1. The probability that these features are actually due to intervening Lyman- absorbers is high and we consider the derived column density as an upper limit only. In any case, this system has a very low molecular fraction of .
Q 00130029, : The detection of H2 in this system has been reported for the first time by Ge & Bechtold (1997). Petitjean et al. (2002) showed that this system is actually the blend of a DLA () and a sub-DLA () separated by 500 km s-1. H2 is present in both systems, with four components detected up to .
Q 00271836, : This system has the lowest metallicity ([X/H] ) of systems in which H2 molecules have been detected. H2 is detected in a single component up to rotational level and possibly 6. Thanks to the high data quality, we detected an increase in the Doppler parameter , from low to high rotational levels, for the first time at high redshift (Noterdaeme et al., 2007a).
Q 03473819, : The detection of H2 in this system was first reported by Levshakov et al. (2002) using UVES commissioning data. Subsequently Ledoux et al. (2003) analysed higher quality spectra of the system. Weak molecular absorption is observed in a single component up to .
Q 04054418, : Molecular hydrogen is detected up to in a single component (see Ledoux et al., 2003; Srianand et al., 2005). There is some indication that the relative strengths of the and 3 lines require km s-1, while the and 1 lines are consistent with km s-1.
Q 05282505, : This is the first DLA system in which H2 was detected (Levshakov & Varshalovich, 1985). The detection of H2 was readdressed in more detail by Foltz et al. (1988), Srianand & Petitjean (1998) and Srianand et al. (2005). The single H2 component seen in a low resolution CASPEC spectrum (Srianand & Petitjean, 1998) is resolved into two components in a UVES spectrum (Srianand et al., 2005). Rotational levels up to are detected.
Q 05513638, : This system has the highest metallicity in the UVES DLA sample with [Zn/H. H2 is clearly detected in two well-resolved features separated by about 55 km s-1 (Ledoux et al., 2002). The first feature is narrow and weak, but detected up to . The second feature is broader and stronger and has been fitted using two components at precisely the same redshift as the detected C i lines.
Q 06425038, : H2 in this system is detected in a single strong component. This is a new detection and details will be presented in a forthcoming paper (Ledoux et al., in prep.).
Q 08411256, : Petitjean et al. (2000) detected two weak absorption features corresponding to H2 L4-0 R0 and L2-0 R0 at the same redshift. As for the DLA towards Q 00002619, we consider the tentative measurement of the column density as an upper limit only.
Q 12320815, : A single H2 component is seen in rotational levels to 5 (Ge et al., 2001; Srianand et al., 2005). This is the only DLA in which deuterated molecular hydrogen (HD) has been detected until now (Varshalovich et al., 2001).
Q 14412737, : Because of the high redshift of this system (actually the highest amongst known H2-bearing DLAs), the Lyman- forest is quite dense in the wavelength region in which H2 lines are redshifted. However, H2 could be detected and studied in a large number of transitions thanks to the high spectral resolution of the data. Four rotational levels are detected in no less than three velocity components (Ledoux et al., 2006b).
Q 14440126, : Molecular hydrogen is found in two components of this sub-DLA in rotational levels (Ledoux et al., 2003).
Q 14511223, : Because of the Lyman-break from the DLA at , the expected positions of only two lines (H2 L0-0 R0 and L0-0 R1) fall in a region of non-zero flux. The high upper limit we derive is not strongly constraining and the molecular fraction is probably well below .
Q 23181107, : Weak H2 absorption features from to 2 are unambiguously detected in a single component (Noterdaeme et al., 2007a).
Q 23431232, : Thanks to the high quality of the spectrum, H2 absorption lines (from and 1) are unambiguously detected although they are extremely weak (H cm-2). We measure the lowest molecular fraction yet measured for a DLA, (Petitjean et al., 2006; Noterdaeme et al., 2007a).
Q 23480108, : No less than seven H2 components are detected in this system (Petitjean et al., 2006; Noterdaeme et al., 2007b). The H2 profile is complex with three strong and four weak components spread over about 250 km s-1, making H2 lines from different transitions overlap. However, the large number of observed transitions and the good data quality allow an accurate measurement of column density for different rotational levels.
4 Overall population
In this Section, we use the results summarised in Table LABEL:sumtable to derive the properties of the H2 gas in the global DLA population. We list in this table, the name of the quasar in column 1, the emission and absorption redshifts in columns 2 and 3, the total H i column density in column 4, the metallicity relative to solar [X/H] and the depletion factor [X/Fe] in columns 5 and 6, with X given in column 7, the velocity spread of the low-ionisation metal line profiles (see Ledoux et al., 2006a) in column 8, the total molecular hydrogen column densities in the and 1 rotational levels in columns 9 and 10, the mean molecular fraction in column 11, and the references for the measurements in column 12. Upper limits on the molecular fraction were calculated to be the sum of the upper limits on the first two rotational levels ( and 1) and are given at the 3 significance level. The thirteen firm detections of H2 constitute what we will hereafter call sub-sample H2. Ten of them have molecular fractions higher than all upper limits, i.e., , and will constitute sub-sample HF (standing for high molecular fractions). We note that obviously .
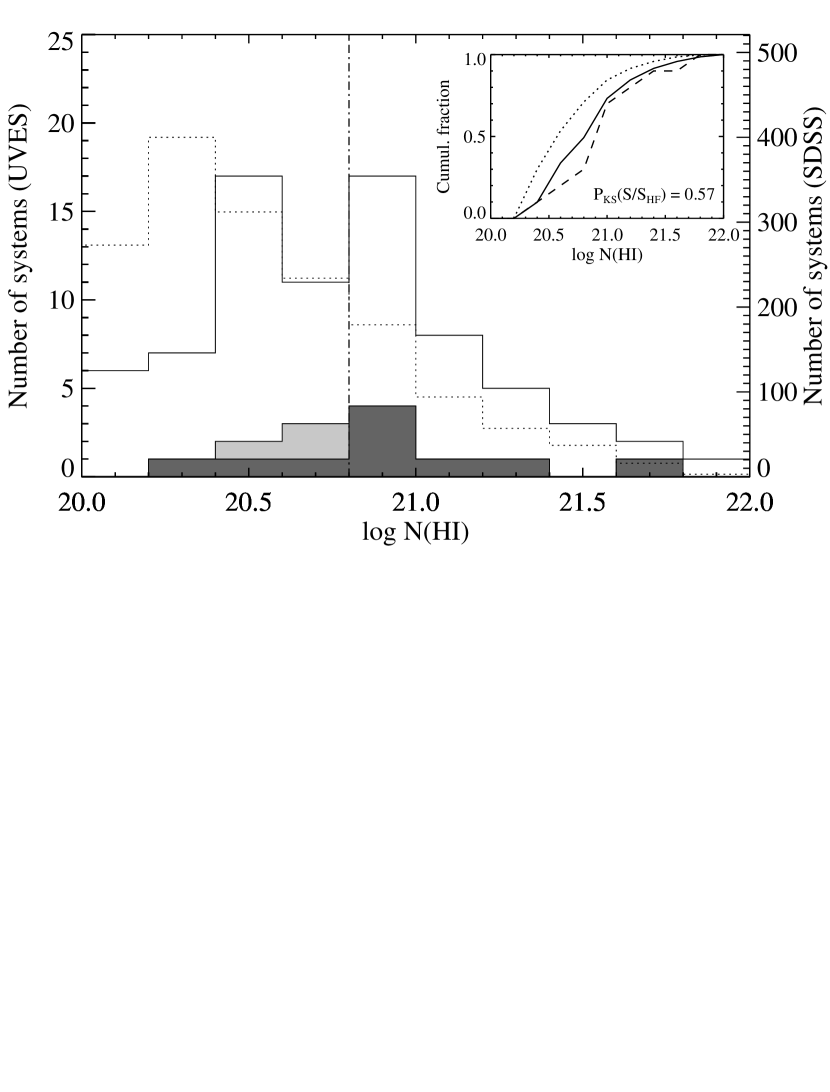
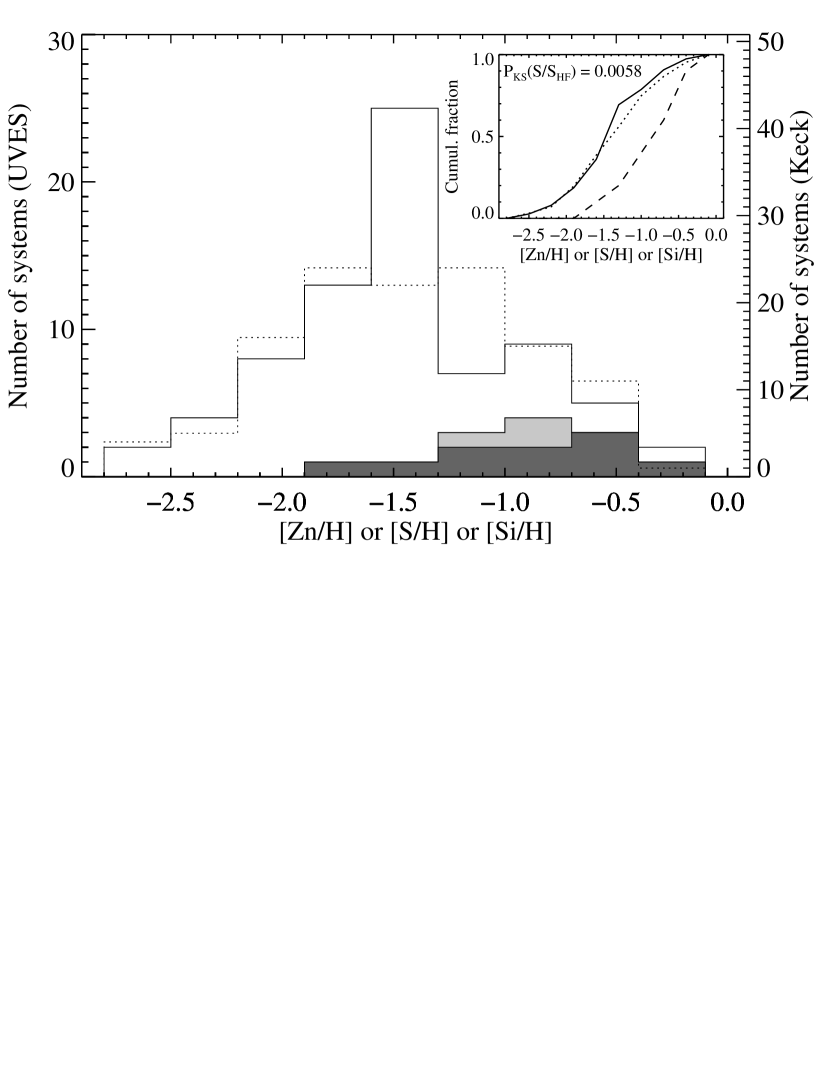
The upper panel of Fig. 1 gives the distribution of from sample , sub-samples H2 and HF to be compared to the reference distribution derived from the SDSS-DR5 DLA sample scaled to the number of systems in the UVES sample (Prochaska et al., 2005). It is apparent that the distribution from the UVES sample is slightly biased compared to the scaled SDSS distribution111Note that the SDSS (H i) distribution itself may be biased, however it is currently the best available representation of the DLA population. in favour of large DLAs (i.e., with ). We can however correct for this bias. We divide each DLA sample into two halves, above and below . We scale the number of systems in each bin of the UVES distribution by the ratio of the number of systems in the (scaled) SDSS and UVES samples, above (by a ratio of ) and below (by ) . The result of this scaling is shown in the bottom panel of Fig. 1. In the inset, the cumulative distributions are shown in order to compare the two populations. It is apparent that the scaling has corrected for the above-mentioned bias.
The overall H2 detection rate in systems is found to be about 16% (10% considering only detections) after correction for the above-mentioned bias. There is no H2 detection for . These numbers, however, may well be affected by small number statistics. H2 is in fact detected in a sub-DLA component () of the system towards Q 00130029 (see Petitjean et al., 2002). The corresponding molecular fraction is larger than . In any case, additional observations are required to investigate the molecular content of sub-DLAs. Apart, possibly, from the first bin (), there is no strong dependence of the presence of molecules on the neutral hydrogen column density. Large molecular fractions are seen over the range .
 |
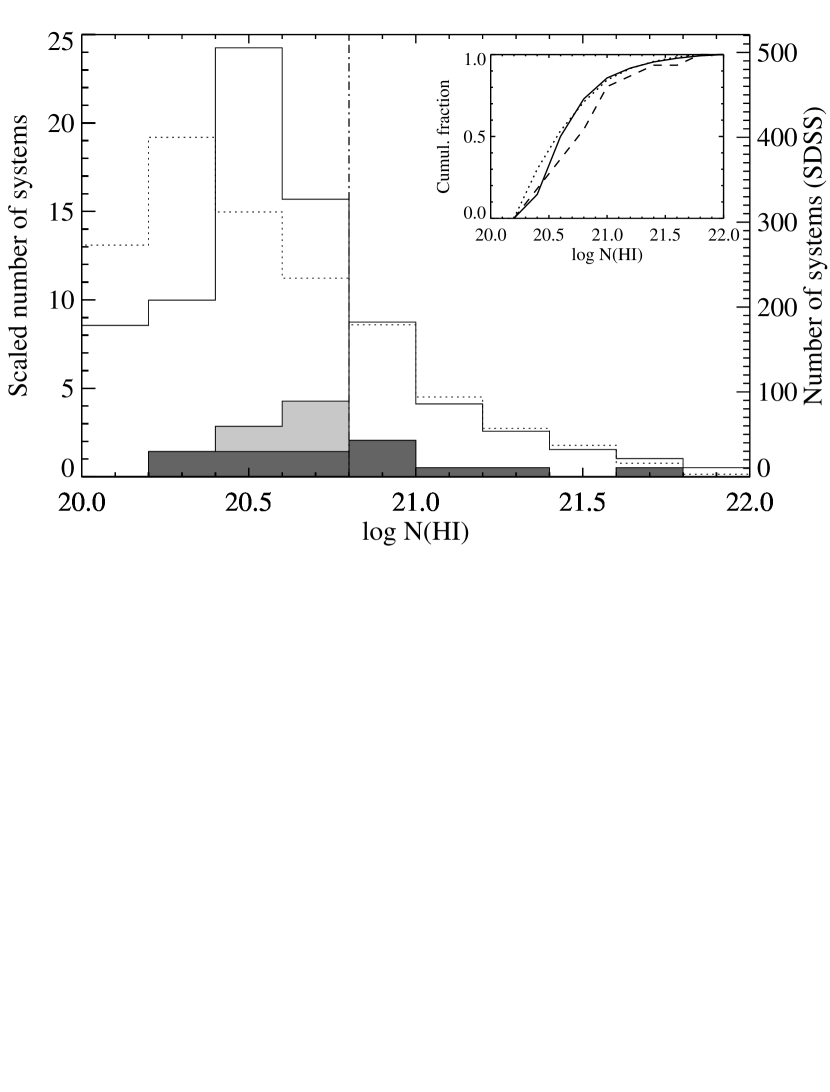 |
The double-sided Kolmogorov-Smirnov test yields a probability that sample and sub-sample HF are drawn from the same parent population.
However, molecular hydrogen with is detected in respectively 9% and 19% of the systems in the two sub-samples: (3/35) and (7/36), which implies that there is probably a tendency for H2 to be seen more often in large column density systems. We note that the fraction is 7% (3/41) for the range . We also note that we are considering here the total neutral hydrogen column densities. The actual H i-clouds corresponding to the H2 absorptions probably have smaller . This is in fact observed for the DLA at towards Q 00130029, for which partial deblending of the Ly- absorption is possible.
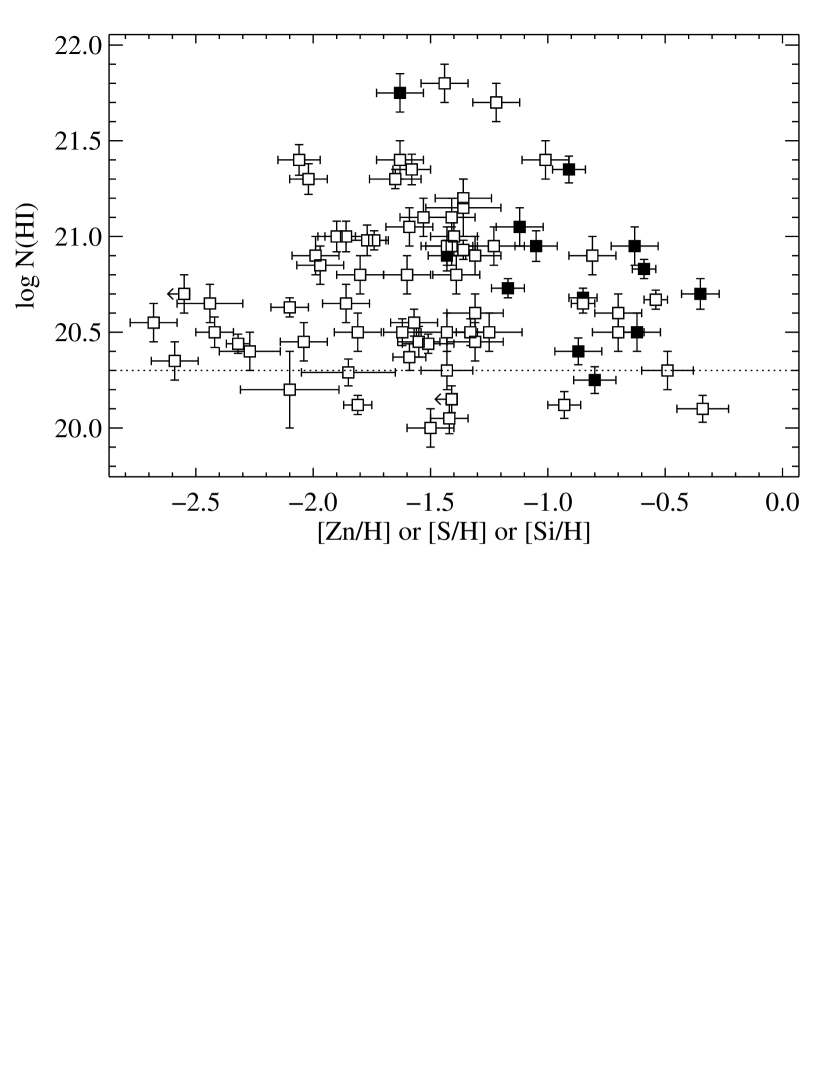
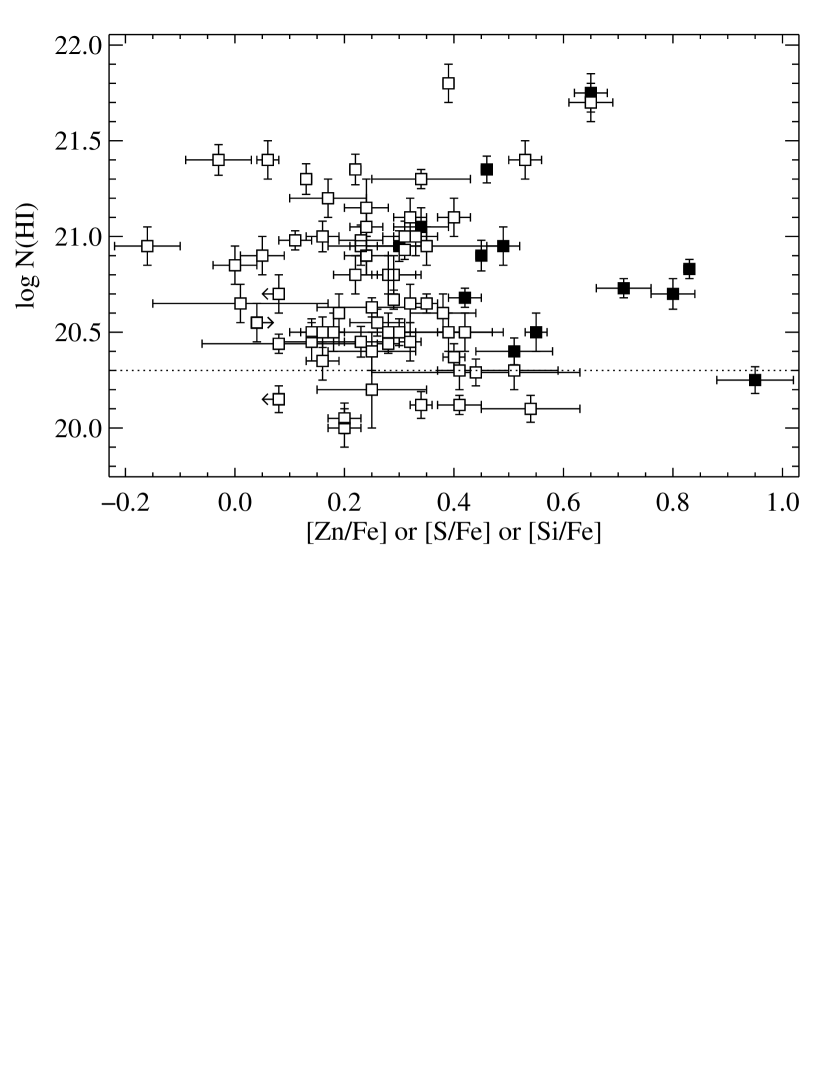
The fact that the sample is biased in favour of large H i column density DLAs could be a problem for the analysis of the overall DLA population if any correlation exists between and the metallicity ([X/H]) and/or the depletion of metals onto dust grains ([X/Fe]). This is not the case however: Figure 2 shows the neutral hydrogen column density as a function of metallicity (top panel) and depletion factor (bottom panel). It is apparent that there is no correlation between [X/H] or [X/Fe] and . The Kendall’s rank correlation coefficient is as small as 0.02 (resp. ) for [X/H] (resp. [X/Fe]) vs. . The lack of systems with both a high metallicity and large is a feature common to all DLA samples. It can be explained either by a lack of large H i column densities because of the transition of H i into H2 (Schaye, 2001) and/or by the fact that any quasar located behind such an absorber would remain undetected because of the induced extinction (e.g., Boissé et al., 1998; Vladilo & Péroux, 2005). Such systems could also be associated with regions with low projected cross-sections. Therefore, although the lack of high-metallicity systems with large , together with the bias towards large in our sample, could introduce a small bias towards low metallicities, the absence of the above-described correlations implies that any bias will have little influence on the properties based on the metallicities and depletion factors discussed in Sect. 6.
 |
 |
In Fig. 3, we compare the metallicity distribution of DLAs in the UVES sample to that of DLAs in the Keck sample (HIRES+ESI, Prochaska et al., 2007b). Although a difference can be seen in the range X/H, partly due to the bias towards large (H i), no systematic bias is observed for the UVES sample, apart from any also affecting the Keck sample, as shown by the cumulative distributions (inset). We note that the observed distributions are similar in shape to the distribution derived using simulations by Hou et al. (2005, their fig. 3). The metallicity distribution for H2-bearing DLAs is also plotted. It is apparent from the figure that the distribution of H2-bearing systems is strongly skewed towards high metallicities (see Sect. 6).
5 Molecular fraction
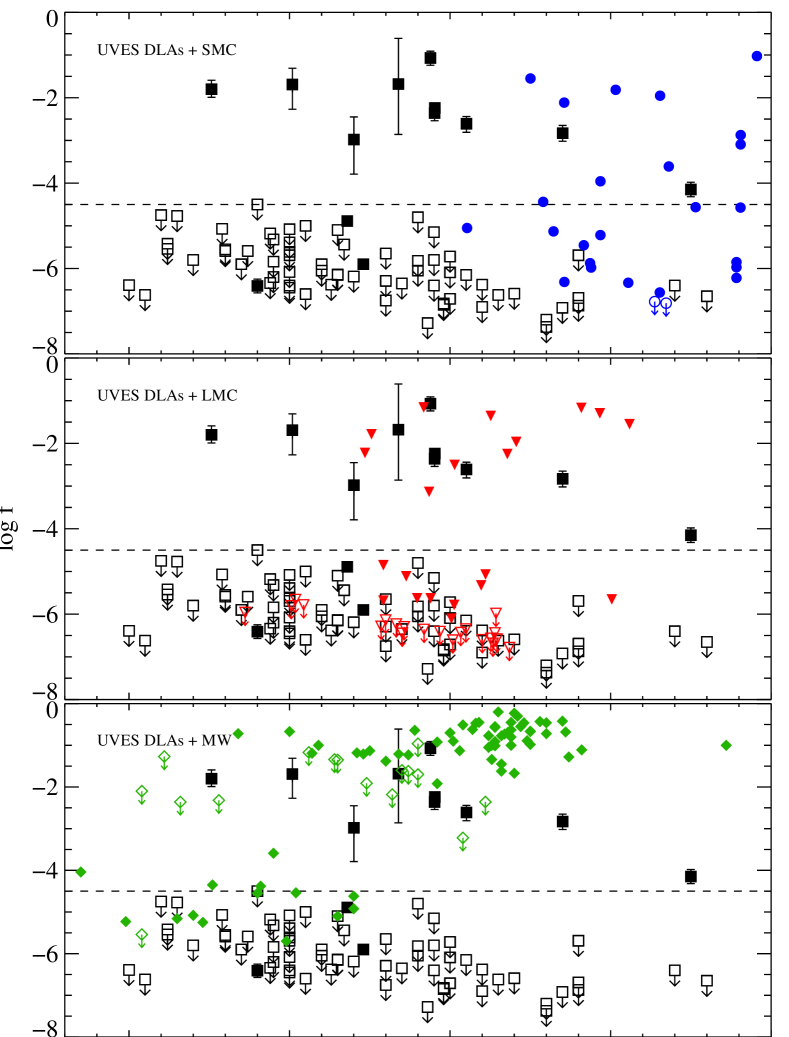
As can be seen in Fig. 4, there is no sharp transition in the molecular fraction of DLAs at any total hydrogen (H2) column density (H), in contrast to what is observed at (H) = 20.7 in the Galactic disk (Savage et al., 1977, bottom panel of Fig. 4) or at (H) = 20.4 along high-latitude Galactic lines of sight (Gillmon et al., 2006). We note also that no sharp transition from H i to H2 is observed in the Magellanic clouds (upper and middle panels of Fig. 4), although SMC lines of sight probe larger gas column densities. Such transitions are expected to occur at (H) in the LMC and (H) in the SMC (Tumlinson et al., 2002). The molecular fractions of DLAs are similar to values measured for the Magellanic clouds, but are lower than measurements for the Galactic disk. The absence of a sharp H i/H2 transition does not contradict the predictions by Schaye (2001) because the covering factor of large H systems is expected to be small (Zwaan & Prochaska, 2006). Moreover, the induced extinction could be large (see below) and such systems may have so far been missed. We should compile a representative sample of strong DLAs () in order to address this point.
6 The importance of dust
Figure 5 is an extension of fig. 3 from Petitjean et al. (2006) to the whole UVES sample, with about 2.5 times more systems with [X/H. It can be seen from this figure that about 35% of the [X/H (1/20th solar) systems have molecular fractions , while H2 is detected – regardless of the molecular fraction – in % of them. In contrast, only about 4% of the [X/H DLAs have . We remind the reader that we use the limit to define systems with high molecular fraction because all of our upper limits are below this value. The lowest metallicity at which H2 has been detected to date in a DLA is [Zn/H (Noterdaeme et al., 2007a). The corresponding system, at towards Q 00271836, has a molecular fraction of .
This trend in metallicity supports the idea that the presence of dust is an important ingredient in the formation of H2. The correlation between the depletion of metals into dust grains and the metallicity (Ledoux et al., 2003) has now been confirmed using a sample more than twice the size, and at higher confidence level (5.3 compared to 4 ) (see Fig. 6). High-metallicity DLAs are usually more dusty and, as a consequence, the formation rate of H2 onto dust grains is enhanced, while the photo-destruction rate is lowered by dust- and self-shielding.
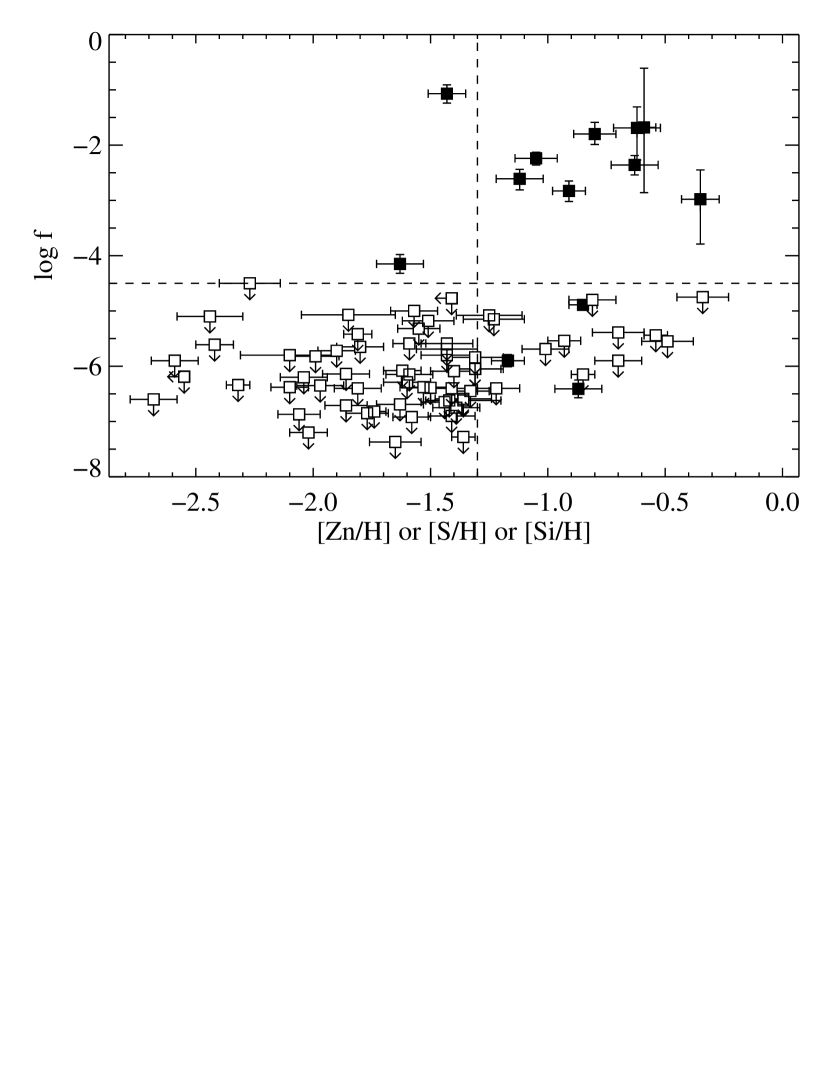
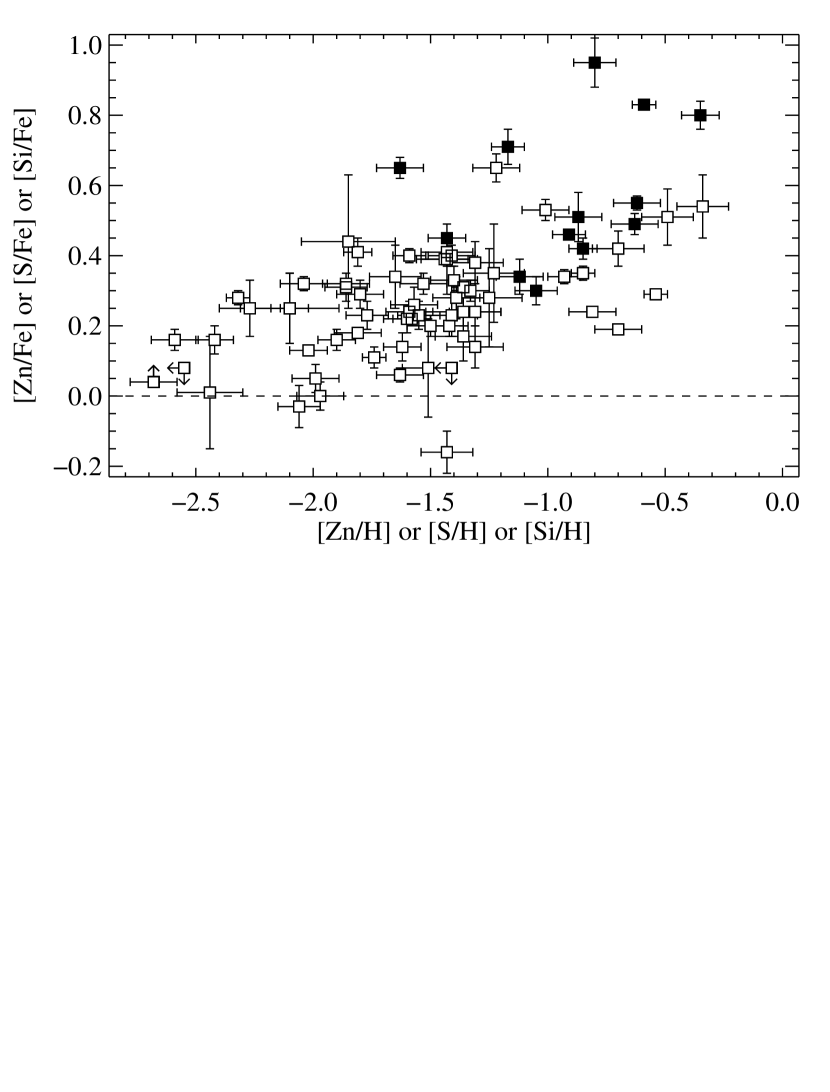
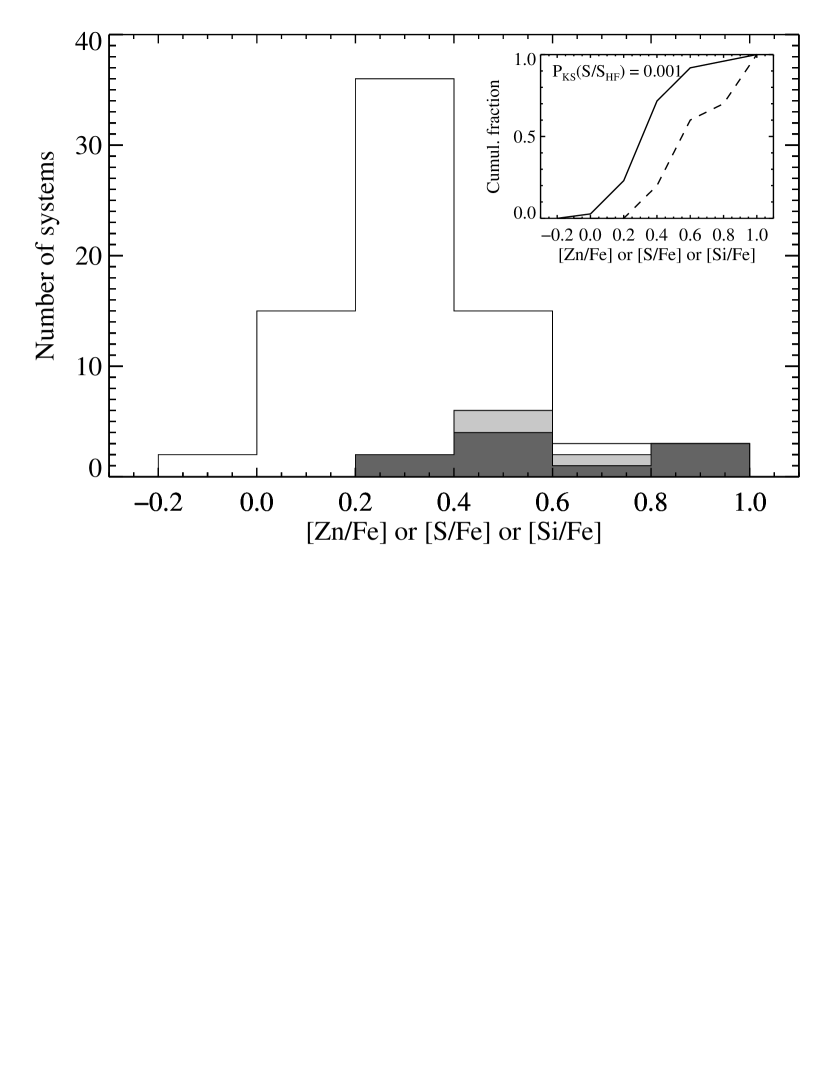
Figure 7 shows the distribution of depletion factors (defined as [X/Fe], with XZn, S or Si) for the different samples of systems defined in this paper. It is clear from this histogram that H2 is found in DLAs with the highest depletion factors. The probability that sample and sub-sample H2 are drawn from the same parent population is very small, i.e., .
To test the influence of the presence of dust on the molecular hydrogen column density, it is worth comparing (H2) to the column density of iron into dust, Fe (see Fig. 8). Vladilo et al. (2006) showed that absorbers associated with large column densities of iron in dust, generally induce more extinction (i.e. have larger values of ). This correlation is consistent with that observed along Galactic interstellar lines of sight (e.g., Snow et al., 2002). We note that the above expression of (Fe)dust assumes that X is a non-refractory element and that the intrinsic [X/Fe] ratio is solar. Vladilo (2002) introduced corrections for zinc depletion and possible non-solar intrinsic abundances (i.e., (Fe/XFe/X; see also Vladilo et al., 2006) that we do not apply here because the corrections are small, and not necessary for our purposes. This effect is most important for Silicon that can be depleted into dust grains, and the depletion factor is underestimated when using [Si/Fe]. The effect is however probably less than 0.3 dex (see Petitjean et al., 2002) and should have no consequence on the characteristics of the whole population. When [X/Fe] is negative, which happens for three DLAs, Fe cannot be computed directly. We thus estimated a 3 upper limit on Fe by considering the upper bound provided by the 3 error on [X/Fe].
It can be seen on Fig. 8 that all H2-bearing DLAs have Fe cm-2, supporting the idea that dust is an important ingredient in the formation of H2. We note however that this column density corresponds to a small extinction (; Vladilo et al. 2006) possibly explaining the absence of detectable H2 in three DLAs at Fe cm-2.
An additional reason why H2 is not detected in these systems could be related to the particle density in the neutral gas being too small. The equilibrium between formation and destruction of H2 molecules can be written as HH, where is the photo-dissociation rate, is the formation rate, the particle density, H the proton density and H the H2 density. By multiplying this expression by the longitudinal size of the cloud, one can see that the H2 column density depends linearly on the particle density. Large dust column densities may occasionally result from large and diffuse clouds where the particle density is insufficiently large for H2 to form efficiently enough to be detectable. The column densities of iron in dust are in fact large (Fe cm-2) in three DLAs without detectable H2 mainly because of the large neutral hydrogen column densities (i.e. towards Q 04580203; towards Q 11570128; and towards Q 12090919).
The fact that H2 is detected in some DLAs at low extinction, could imply that the weak (due to high depletion) iron component, associated with the H2-bearing component, is hidden in the overall metal-line profile (see, e.g., Ledoux et al., 2002). This may bias the measurements of metallicities and depletion factors, and hence the measurement of column density of iron into dust grains. In the future, we propose that this issue is more deeply investigated.

7 Gas kinematics
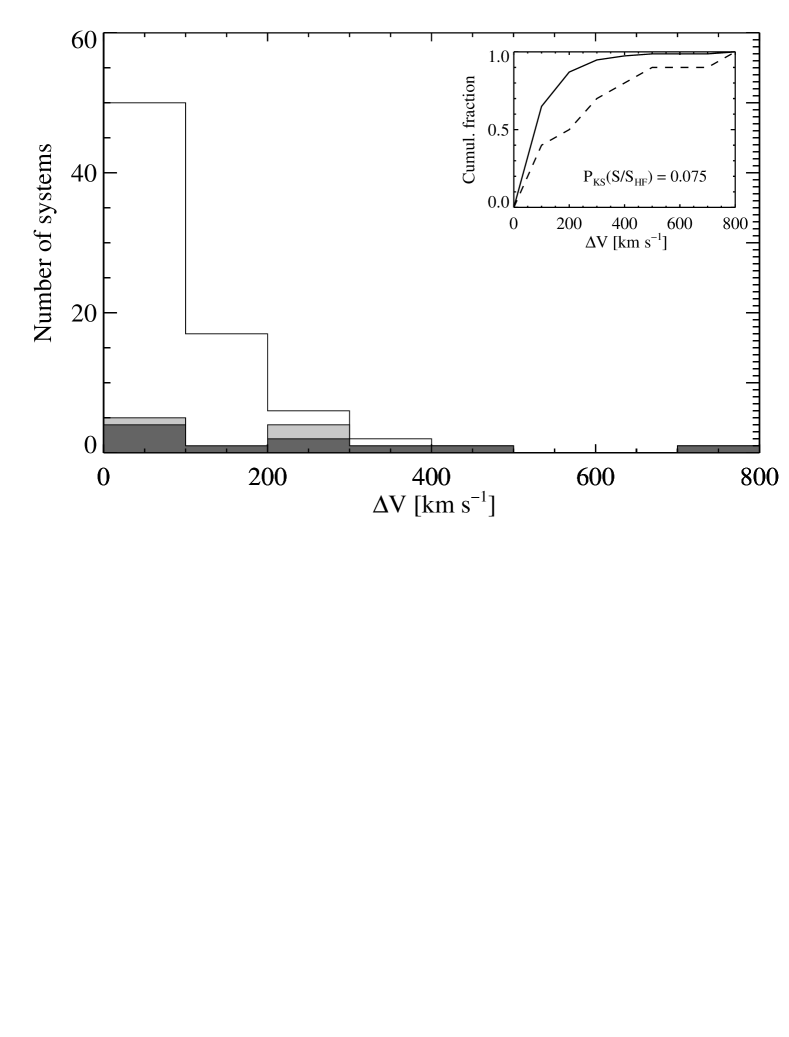
Figure 9 shows the distribution of the velocity widths of the low-ionisation metal line profiles. These measurements were completed using the method described in Ledoux et al. (2006a), and many were previously published in that paper. It is clear from Fig. 9 that the probability of finding H2 is higher when the velocity width of the low-ionisation metal line profiles is larger. Using the double-sided Kolmogorov-Smirnov test, we calculate a probability that samples and HF are derived from the same parent distribution. A natural explanation is provided by Ledoux et al. (2006a) who suggested that higher metallicity DLAs arise from more massive objects. The amount of molecular gas and the star-formation rate in these systems could therefore be enhanced (Hirashita & Ferrara, 2005) naturally explaining the above correlation. Another explanation could be that outflows can pull out cold and dusty gas, as well as providing a large number of velocity components that would increase the probability of finding H2 (Murphy et al., 2007). However, H2 is usually detected in few components (typically one or two) in the main clumps of the systems, and not in the satellite components at high velocities that make up most of the width of the profile. The only exceptions to this are the DLA at towards Q 23480108 where no less than seven H2 components are spread over 250 km s-1 (Noterdaeme et al., 2007b), and the system towards Q 00130029 where two pairs of H2 components are separated by more than 500 km s-1 (Petitjean et al., 2002). The latter could be considered as the blend of two DLA systems (see Sect. 3). In addition, Fox et al. (2007a) interpreted DLAs where the C iv total line width exceeds the escape velocity to be associated with outflowing winds. Using this criterion, there is no indication that H2 is found preferably in DLAs with outflows. Indeed, considering the 54 DLA systems common to the present sample and that of Fox et al. (2007a), we can estimate that H2 is detected in 16% (3/19) of the DLAs with outflows while this percentage is 22% (12/54) for the entire DLA population.
8 Evolution with redshift
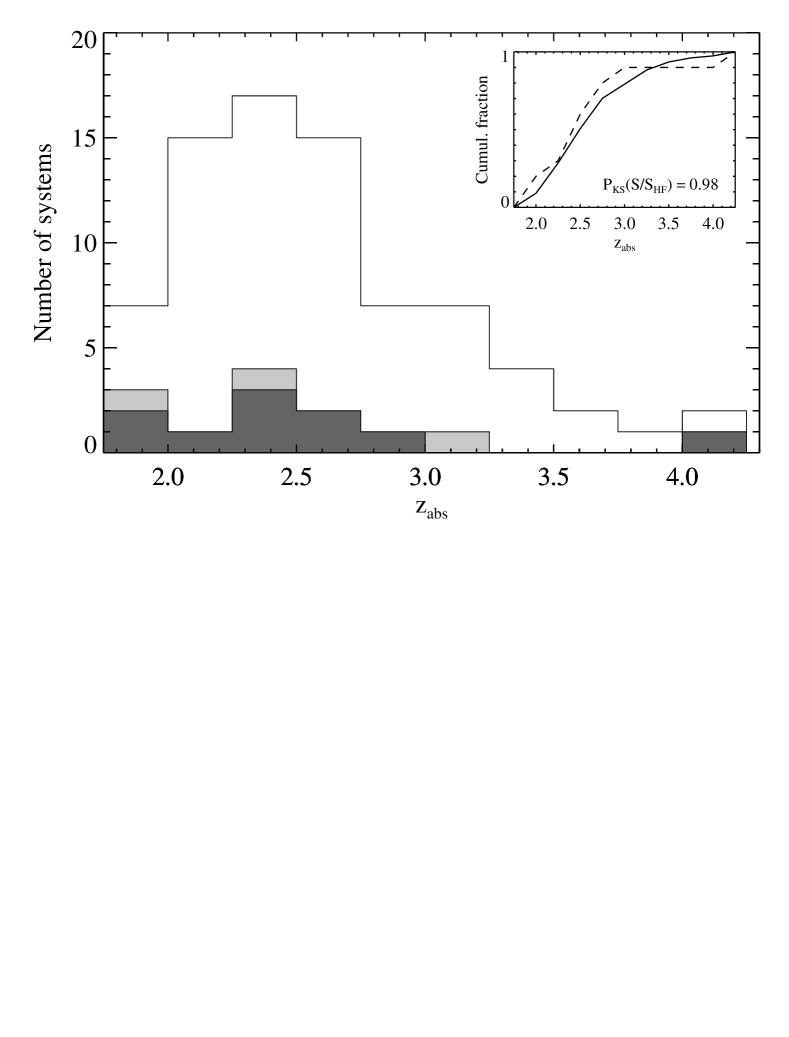
In Fig. 10, we analyse the redshift distribution of DLAs within the UVES sample. The H2-bearing DLA sub-sample is statistically indistinguishable from the overall UVES sample. A double-sided Kolmogorov-Smirnov test shows that sample and sub-sample H2 have a probability to be drawn from the same parent population. There is no indication of any evolution of the fraction of H2-bearing DLAs with redshift. Molecular hydrogen is more difficult to detect at the lowest redshifts observable using UVES () because fewer and weaker transitions are then covered by the UVES spectra and lines are located in the bluest part of the spectra where the signal-to-noise ratios are lower. While this could imply a bias in the detection rate of H2 in systems with low molecular fractions, high molecular fractions (i.e., ) are detected anyway because the corresponding column densities are always well above the detection limit. When considering only high molecular fractions, the same Kolmogorov-Smirnov test yields (/. Contrary to previous tentative evidence (Curran et al., 2004), there is also no evolution of the molecular fraction in systems with detected H2 (see Fig. 10).
However, because of small number statistics for systems at , it is still unclear whether there is no really evolution in the sense of fewer H2 detections at higher redshift. Therefore, we restrict our claim of no evolution with redshift of the detection fraction and the molecular fraction to the range . On the other hand, large molecular fractions are observed in the local Universe and significant evolutions of both the fraction of H2-detected systems and the molecular fractions are expected at lower redshifts. It is then of prime importance to cover the redshift interval . This will soon be possible using the Cosmic Origins Spectrograph to be installed onboard the Hubble Space Telescope.
 |
 |
9 Conclusion
We present results of the largest survey of molecular hydrogen in high-redshift () DLAs compiled to date using high signal-to-noise ratio, high spectral-resolution VLT-UVES data. We analyse data for 77 DLAs/strong sub-DLAs with cm-2, a dataset more than twice as large as that studied previously by Ledoux et al. (2003). From the thirteen high-redshift H2-bearing DLAs known to date, nine have been discovered by our group. Due to the superb quality of the Ultraviolet and Visual Echelle Spectrograph, we are able to detect unambiguously the H2 absorption features, measure accurate column densities, and in the cases of non-detections derive stringent upper limits.
A double-sided Kolmogorov-Smirnov test shows that the ten H2-bearing systems with (which is our conservative completeness limit) have H i column densities that are compatible with those of the overall DLA population. This may be due however to small number statistics. There is evidence (see Sect. 4) that the probability of finding large molecular fractions is higher in DLAs with large , as observed in the LMC. About % of the systems with have while % of the systems with larger H i column densities have similar molecular fractions. There is no sharp transition in the molecular fraction of DLAs at any of the measured total hydrogen (H2) column density.
It is surprising to see that most of the DLAs have very low molecular fractions, i.e., . This is much smaller than observed along lines of sight in the Galactic disk (Savage et al., 1977). However, Wakker (2006) measured similar molecular fractions towards high-latitude Galactic lines of sight.
We confirm that a good criterion to find H2-bearing DLAs is to select high-metallicity systems. Indeed, 35% of the systems with [X/H have whilst this is the case for only 4% of those with metallicities lower than that. Since there is a correlation between metallicity and depletion factor, the latter being defined as [X/Fe] with XZn, S or Si, H2 is found in DLAs also having the highest depletion factors. Therefore, clouds with large molecular fractions are expected to be dusty and clumpy (e.g., Hirashita et al., 2003). They can be missed because of the associated extinction and/or because of their small cross-section.
The presence of H2 is closely related to the dust column density. Indeed, all detections pertain to systems where the column density of iron into dust grains is larger than cm-2, and about 40% of these systems have detectable H2. This shows that the presence of dust is an important ingredient in the formation of H2 in DLAs. The low molecular fractions measured for most of the DLAs are probably a consequence of low abundances of metals and dust.
We show that the probability of finding H2 increases with increasing velocity width of low-ionisation metal line profiles. The correlation between velocity width and metallicity (Ledoux et al., 2006a), if interpreted as a mass-metallicity relation, provides a natural explanation in which H2-bearing DLA systems are preferably associated with massive objects where star-formation is enhanced. There is no evidence of systematic outflows in H2-bearing DLAs neither from the H2 profiles nor from the study of the associated high-ionisation phase.
From the comparison between H2-bearing systems and the overall UVES sample, we show that there is no evolution with redshift of the fraction of H2-bearing DLAs nor of the molecular fraction in systems with detected H2 over the range . This, compared to the large amounts of H2 observed in the local Universe, suggests that a significant increase of the molecular fraction in DLAs could take place at redshifts . Ultraviolet observations from space are therefore needed to observe the H2 Lyman and Werner bands in low and intermediate redshift DLAs.
Increasing the sample of H2-bearing DLAs is required to cover a large range in column density and derive the H2 frequency distribution, HX) – where X is the absorption distance – in a way similar to studies completed for H i (Lanzetta et al., 1991). This would assess whether the steep slope observed in X) at large column densities (e.g., Prochaska et al., 2005) is due to the conversion H iH2 (Schaye, 2001) rather than to a magnitude-dependent bias from dust obscuration of the background quasars (e.g., Boissé et al., 1998; Vladilo & Péroux, 2005; Smette et al., 2005). Both effects can explain the apparent lack of DLAs of both high metallicity and large H i column density, as observed in all DLA samples.
While the exact nature of DLAs is still an open debate, H2-bearing DLAs provide interesting probes of the physical conditions close to star-forming regions. About a decade ago, only one H2-bearing DLA was known. With the criteria revealed by the present survey, it will be possible to select these systems more efficiently and their numbers should increase rapidly. This opens up the exciting prospect of the detailed study of the ISM in distant galaxies.
Acknowledgements.
We thank an anonymous referee and the language editor for useful comments that improved the paper. PN is supported by a PhD studentship from ESO. PPJ and RS gratefully acknowledge support from the Indo-French Centre for the Promotion of Advanced Research (Centre Franco-Indien pour la Promotion de la Recherche Avancée) under contract No. 3004-3.References
- Akerman et al. (2005) Akerman, C. J., Ellison, S. L., Pettini, M., & Steidel, C. C. 2005, A&A, 440, 499
- Ballester et al. (2000) Ballester, P., Modigliani, A., Boitquin, O., et al. 2000, The Messenger, 101, 31
- Beaver et al. (1972) Beaver, E. A., Burbidge, E. M., McIlwain, C. E., Epps, H. W., & Strittmatter, P. A. 1972, ApJ, 178, 95
- Boissé et al. (1998) Boissé, P., Le Brun, V., Bergeron, J., & Deharveng, J.-M. 1998, A&A, 333, 841
- Carswell et al. (1975) Carswell, R. F., Hilliard, R. L., Strittmatter, P. A., Taylor, D. J., & Weymann, R. J. 1975, ApJ, 196, 351
- Cui et al. (2005) Cui, J., Bechtold, J., Ge, J., & Meyer, D. M. 2005, ApJ, 633, 649
- Curran et al. (2004) Curran, S. J., Webb, J. K., Murphy, M. T., & Carswell, R. F. 2004, MNRAS, 351, L24
- Dekker et al. (2000) Dekker, H., D’Odorico, S., Kaufer, A., Delabre, B., & Kotzlowski, H. 2000, in Proc. SPIE Vol. 4008, p. 534-545, Optical and IR Telescope Instrumentation and Detectors, Masanori Iye; Alan F. Moorwood; Eds., 534–545
- Foltz et al. (1988) Foltz, C. B., Chaffee, F. H., & Black, J. H. 1988, ApJ, 324, 267
- Fox et al. (2007a) Fox, A. J., Ledoux, C., Petitjean, P., & Srianand, R. 2007a, A&A, 473, 791
- Fox et al. (2007b) Fox, A. J., Petitjean, P., Ledoux, C., & Srianand, R. 2007b, A&A, 465, 171
- Fynbo et al. (2006) Fynbo, J. P. U., Starling, R. L. C., Ledoux, C., et al. 2006, A&A, 451, L47
- Ge & Bechtold (1997) Ge, J. & Bechtold, J. 1997, ApJ, 477, L73
- Ge et al. (2001) Ge, J., Bechtold, J., & Kulkarni, V. P. 2001, ApJ, 547, L1
- Gillmon et al. (2006) Gillmon, K., Shull, J. M., Tumlinson, J., & Danforth, C. 2006, ApJ, 636, 891
- Grevesse & Sauval (2002) Grevesse, N. & Sauval, A. J. 2002, Adv. Space Res., 30, 3
- Haehnelt et al. (2000) Haehnelt, M. G., Steinmetz, M., & Rauch, M. 2000, ApJ, 534, 594
- Heinmüller et al. (2006) Heinmüller, J., Petitjean, P., Ledoux, C., Caucci, S., & Srianand, R. 2006, A&A, 449, 33
- Hirashita & Ferrara (2005) Hirashita, H. & Ferrara, A. 2005, MNRAS, 356, 1529
- Hirashita et al. (2003) Hirashita, H., Ferrara, A., Wada, K., & Richter, P. 2003, MNRAS, 341, L18
- Hou et al. (2005) Hou, J. L., Shu, C. G., Shen, S. Y., et al. 2005, ApJ, 624, 561
- Jakobsson et al. (2006) Jakobsson, P., Fynbo, J. P. U., Ledoux, C., et al. 2006, A&A, 460, L13
- Lanzetta et al. (1991) Lanzetta, K. M., McMahon, R. G., Wolfe, A. M., et al. 1991, ApJS, 77, 1
- Ledoux et al. (2006a) Ledoux, C., Petitjean, P., Fynbo, J. P. U., Møller, P., & Srianand, R. 2006a, A&A, 457, 71
- Ledoux et al. (2003) Ledoux, C., Petitjean, P., & Srianand, R. 2003, MNRAS, 346, 209
- Ledoux et al. (2006b) Ledoux, C., Petitjean, P., & Srianand, R. 2006b, ApJ, 640, L25
- Ledoux et al. (2002) Ledoux, C., Srianand, R., & Petitjean, P. 2002, A&A, 392, 781
- Levshakov et al. (2002) Levshakov, S. A., Dessauges-Zavadsky, M., D’Odorico, S., & Molaro, P. 2002, ApJ, 565, 696
- Levshakov et al. (2000) Levshakov, S. A., Molaro, P., Centurión, M., et al. 2000, A&A, 361, 803
- Levshakov et al. (2001) Levshakov, S. A., Molaro, P., Centurión, M., et al. 2001, in Deep Fields, ed. S. Cristiani, A. Renzini, & R. E. Williams, 334–+
- Levshakov & Varshalovich (1985) Levshakov, S. A. & Varshalovich, D. A. 1985, MNRAS, 212, 517
- Lowrance et al. (1972) Lowrance, J. L., Morton, D. C., Zucchino, P., Oke, J. B., & Schmidt, M. 1972, ApJ, 171, 233
- Lu et al. (1996) Lu, L., Sargent, W. L. W., Barlow, T. A., Churchill, C. W., & Vogt, S. S. 1996, ApJS, 107, 475
- Morton (2003) Morton, D. C. 2003, ApJS, 149, 205
- Murphy et al. (2007) Murphy, M. T., Curran, S. J., Webb, J. K., Ménager, H., & Zych, B. J. 2007, MNRAS, 376, 673
- Noterdaeme et al. (2007a) Noterdaeme, P., Ledoux, C., Petitjean, P., et al. 2007a, A&A, 474, 393
- Noterdaeme et al. (2007b) Noterdaeme, P., Petitjean, P., Srianand, R., Ledoux, C., & Le Petit, F. 2007b, A&A, 469, 425
- Petitjean et al. (2006) Petitjean, P., Ledoux, C., Noterdaeme, P., & Srianand, R. 2006, A&A, 456, L9
- Petitjean et al. (2000) Petitjean, P., Srianand, R., & Ledoux, C. 2000, A&A, 364, L26
- Petitjean et al. (2002) Petitjean, P., Srianand, R., & Ledoux, C. 2002, MNRAS, 332, 383
- Prochaska et al. (2007a) Prochaska, J. X., Chen, H.-W., Wolfe, A. M., Dessauges-Zavadsky, M., & Bloom, J. S. 2007a, arXiv:astro-ph/0703701
- Prochaska et al. (2003) Prochaska, J. X., Gawiser, E., Wolfe, A. M., Cooke, J., & Gelino, D. 2003, ApJS, 147, 227
- Prochaska et al. (2005) Prochaska, J. X., Herbert-Fort, S., & Wolfe, A. M. 2005, ApJ, 635, 123
- Prochaska & Wolfe (2002) Prochaska, J. X. & Wolfe, A. M. 2002, ApJ, 566, 68
- Prochaska et al. (2007b) Prochaska, J. X., Wolfe, A. M., Howk, J. C., et al. 2007b, ApJS, 171, 29
- Reimers et al. (2003) Reimers, D., Baade, R., Quast, R., & Levshakov, S. A. 2003, A&A, 410, 785
- Savage et al. (1977) Savage, B. D., Bohlin, R. C., Drake, J. F., & Budich, W. 1977, ApJ, 216, 291
- Schaye (2001) Schaye, J. 2001, ApJ, 562, L95
- Smette et al. (2005) Smette, A., Wisotzki, L., Ledoux, C., et al. 2005, in IAU Colloq. 199: Probing Galaxies through Quasar Absorption Lines, ed. P. Williams, C.-G. Shu, & B. Menard, 475–477
- Smith et al. (1979) Smith, H. E., Margon, B., & Jura, M. 1979, ApJ, 228, 369
- Snow et al. (2002) Snow, T. P., Rachford, B. L., & Figoski, L. 2002, ApJ, 573, 662
- Srianand & Petitjean (1998) Srianand, R. & Petitjean, P. 1998, A&A, 335, 33
- Srianand et al. (2000) Srianand, R., Petitjean, P., & Ledoux, C. 2000, Nature, 408, 931
- Srianand et al. (2005) Srianand, R., Petitjean, P., Ledoux, C., Ferland, G., & Shaw, G. 2005, MNRAS, 362, 549
- Tumlinson et al. (2002) Tumlinson, J., Shull, J. M., Rachford, B. L., et al. 2002, ApJ, 566, 857
- Varshalovich et al. (2001) Varshalovich, D. A., Ivanchik, A. V., Petitjean, P., Srianand, R., & Ledoux, C. 2001, Astronomy Letters, 27, 683
- Viegas (1995) Viegas, S. M. 1995, MNRAS, 276, 268
- Vladilo (2002) Vladilo, G. 2002, A&A, 391, 407
- Vladilo et al. (2006) Vladilo, G., Centurión, M., Levshakov, S. A., et al. 2006, A&A, 454, 151
- Vladilo & Péroux (2005) Vladilo, G. & Péroux, C. 2005, A&A, 444, 461
- Wakker (2006) Wakker, B. P. 2006, ApJS, 163, 282
- Wolfe et al. (2005) Wolfe, A. M., Gawiser, E., & Prochaska, J. X. 2005, ARA&A, 43, 861
- Wolfe et al. (1995) Wolfe, A. M., Lanzetta, K. M., Foltz, C. B., & Chaffee, F. H. 1995, ApJ, 454, 698
- Wolfe & Prochaska (2000) Wolfe, A. M. & Prochaska, J. X. 2000, ApJ, 545, 591
- Wolfe et al. (1986) Wolfe, A. M., Turnshek, D. A., Smith, H. E., & Cohen, R. D. 1986, ApJS, 61, 249
- Wright et al. (1979) Wright, A. E., Morton, D. C., Peterson, B. A., & Jauncey, D. L. 1979, MNRAS, 189, 611
- Zwaan & Prochaska (2006) Zwaan, M. A. & Prochaska, J. X. 2006, ApJ, 643, 675
| Quasar | [X/H | [X/Fe | X | (H2) | Refs. | ||||||
|---|---|---|---|---|---|---|---|---|---|---|---|
| B1950 | [km s-1] | J = 0 | J = 1 | ||||||||
| Q 00002619 | 4.11 | 3.390 | Zn | 33 | |||||||
| Q 00100012 | 2.15 | 2.025 | Zn | 32 | |||||||
| Q 00130029 | 2.09 | 1.973 | Zn | 720 | |||||||
| Q 00271836 | 2.56 | 2.402 | Zn | 44 | |||||||
| Q 00393354 | 2.48 | 2.224 | Si | 122 | |||||||
| Q 00492820 | 2.26 | 2.071 | Si | 51 | |||||||
| Q 00582914 | 3.09 | 2.671 | Zn | 34 | |||||||
| Q 01001300 | 2.69 | 2.309 | Zn | 37 | |||||||
| Q 01021902 | 3.04 | 2.370 | S | 17 | |||||||
| Q 01021902 | 3.04 | 2.926 | Si | 146 | |||||||
| Q 01123030 | 2.99 | 2.418 | Si | 31 | |||||||
| Q 01123030 | 2.99 | 2.702 | Si | 218 | |||||||
| Q 01120259 | 2.81 | 2.423 | S | 112 | |||||||
| Q 01310345 | 4.15 | 3.692 | S | 39 | |||||||
| Q 01310345 | 4.15 | 3.774 | Si | 128 | |||||||
| Q 01352722 | 3.21 | 2.800 | S | 65 | |||||||
| Q 02160803 | 2.99 | 2.293 | Zn | 104 | |||||||
| Q 02422917 | 3.27 | 2.560 | S | 70 | |||||||
| Q 02544025 | 2.28 | 2.046 | S | 37 | |||||||
| Q 03003152 | 2.37 | 2.179 | S | 41 | |||||||
| Q 03314506 | 2.67 | 2.411 | Si | 31 | |||||||
| Q 03351213 | 3.44 | 3.180 | Si | 15 | |||||||
| Q 03360143 | 3.20 | 3.062 | Si | 67 | |||||||
| Q 03473819 | 3.22 | 3.025 | Zn | 93 | |||||||
| Q 04054418 | 3.02 | 2.550 | Zn | 165 | |||||||
| Q 04054418 | 3.02 | 2.595 | Zn | 79 | |||||||
| Q 04054418 | 3.02 | 2.622 | Si | 182 | |||||||
| Q 04212624 | 2.28 | 2.157 | Si | 47 | |||||||
| Q 04255214 | 2.25 | 2.224 | S | 40 | |||||||
| Q 04324401 | 2.65 | 2.302 | Si | 88 | |||||||
| Q 04501310 | 2.25 | 2.067 | S | 148 | |||||||
| Q 04580203 | 2.29 | 2.040 | Zn | 88 | |||||||
| Q 05282505 | 2.77 | 2.811 | Zn | 304 | |||||||
| Q 05513638 | 2.32 | 1.962 | Zn | 468 | |||||||
| Q 06425038 | 3.09 | 2.659 | Zn | 99 | |||||||
| Q 08411256 | 2.50 | 2.375 | Zn | 37 | |||||||
| Q 08411256 | 2.50 | 2.476 | Zn | 30 | |||||||
| Q 09130714 | 2.78 | 2.618 | Si | 22 | |||||||
| Q 09333319 | 2.91 | 2.682 | Si | 312 | |||||||
| Q 09510450 | 4.37 | 4.203 | Si | 15 | |||||||
| Q 10362257 | 3.13 | 2.778 | S | 80 | |||||||
| Q 11080747 | 3.92 | 3.608 | Si | 31 | |||||||
| Q 11111517 | 3.37 | 3.266 | Zn | 140 | |||||||
| Q 11171329 | 3.96 | 3.351 | Zn | 43 | |||||||
| Q 11570128 | 1.99 | 1.944 | Zn | 89 | |||||||
| Q 12090919 | 3.30 | 2.584 | Zn | 214 | |||||||
| Q 12201800 | 2.16 | 2.113 | S | 95 | |||||||
| Q 12231753 | 2.94 | 2.466 | Zn | 91 | |||||||
| Q 12320815 | 2.57 | 2.338 | S | 85 | |||||||
| Q 13371121 | 2.92 | 2.508 | Si | 32 | |||||||
| Q 13371121 | 2.92 | 2.796 | Si | 42 | |||||||
| Q 13401340 | 3.20 | 3.118 | S | 153 | |||||||
| Q 13541046 | 3.01 | 2.501 | S | 71 | |||||||
| Q 13541046 | 3.01 | 2.967 | Si | 30 | |||||||
| Q 14180630 | 3.69 | 3.448 | Si | 35 | |||||||
| Q 14412737 | 4.42 | 4.224 | Zn | 130 | |||||||
| Q 14440126 | 2.21 | 2.087 | Zn | 294 | |||||||
| Q 14511223 | 3.25 | 2.469 | Si | 35 | |||||||
| Q 14511223 | 3.25 | 3.171 | Si | 45 | |||||||
| Q 20593604 | 3.09 | 2.507 | S | 25 | |||||||
| Q 20593604 | 3.09 | 3.083 | S | 44 | |||||||
| Q 21163550 | 2.34 | 1.996 | Zn | 177 | |||||||
| Q 21384427 | 3.17 | 2.852 | Zn | 58 | |||||||
| Q 22061958 | 2.56 | 1.921 | Zn | 136 | |||||||
| Q 22061958 | 2.56 | 2.076 | Si | 20 | |||||||
| Q 22223939 | 2.18 | 2.154 | S | 21 | |||||||
| Q 22283954 | 2.21 | 2.095 | Zn | 138 | |||||||
| Q 22300232 | 2.15 | 1.864 | S | 148 | |||||||
| Q 22436031 | 3.01 | 2.331 | Zn | 173 | |||||||
| Q 23113721 | 2.48 | 2.182 | Si | 77 | |||||||
| Q 23181107 | 2.96 | 1.989 | Zn | 207 | |||||||
| Q 23320924 | 3.32 | 3.057 | S | 111 | |||||||
| Q 23431232 | 2.51 | 2.431 | Zn | 289 | |||||||
| Q 23441229 | 2.76 | 2.538 | Si | 69 | |||||||
| Q 23480108 | 3.01 | 2.426 | S | 248 | |||||||
| Q 23480108 | 3.01 | 2.615 | Si | 95 | |||||||
| Q 23481444 | 2.94 | 2.279 | S | 55 | |||||||
a Levshakov et al. (2000, 2001),
b Petitjean et al. (2000),
c Ledoux et al. (2003),
d Ge & Bechtold (1997),
e Petitjean et al. (2002),
f Noterdaeme et al. (2007a),
g Smette et al. (2005),
h this work,
i Petitjean et al. (2006),
j Akerman et al. (2005),
k Levshakov et al. (2002),
l Srianand et al. (2005),
m Heinmüller et al. (2006),
n Levshakov & Varshalovich (1985),
o Foltz et al. (1988),
p Srianand & Petitjean (1998),
q Ledoux et al. (2002),
r Srianand et al. (2000),
s Ge et al. (2001),
t Ledoux et al. (2006b),
u Noterdaeme et al. (2007b).
† (Fe ii) from Prochaska et al. (2007b).
∗ Metal column densities from Prochaska et al. (2007b). Only an upper limit on (Fe ii) could be measured (Prochaska et al. 2003).
The abundance of iron is therefore estimated through that of nickel, assuming [Fe/H] = [Ni/H dex.