Molecules in Space & Laboratory
The search for complex molecules in the ISM:
a complete 3 mm line survey of Sgr B2-N and -M
Abstract
Famous for the extraordinary richness of its molecular content, the Sgr B2 molecular cloud complex is the prime target in the long-standing search for ever more complex species. We have completed a molecular line survey of the hot dense cores Sgr B2(N) and SgrB2(M) in the 3 mm wavelength range with the IRAM 30 m telescope. We performed the analysis of this huge data set by modeling the whole spectrum at once in the LTE approximation. Ongoing analyses yield an average line density of about 100 features/GHz above 3 for Sgr B2(N), emitted and/or absorbed by a total of 51 molecular species. We find lines from 60 rare isotopologues and from 41 vibrationally excited states in addition to the main species, vibrational ground state lines. For Sgr B2(M), we find about 25 features/GHz above 3, from 41 molecular species plus 50 isotopologues and 20 vibrationally excited states. Thanks to the constant updates to the Cologne Database for Molecular Spectroscopy, we are working our way through the assignment of the unidentified features, currently 40 and 50 above 3 for Sgr B2(N) and SgrB2(M), respectively.
1 Introduction
With several active regions and a total mass of more than M⊙, Sagittarius B2 (hereafter SgrB2) is one of the most complex and massive sites of star formation in the Galaxy. It is located close to the galactic center and harbors two hot dense cores (M and N), which fragment into several sub cores. SgrB2(N) has a very rich chemistry and was called the Large Molecule Heimat (LMH) by Snyder, Kuan, & Miao (1994). Many complex molecules were discovered there like, e.g., acetic acid (CH3COOH, Mehringer et al. 1997), glycolaldehyde (CH2(OH)CHO, Hollis, Lovas, & Jewell 2000), and acetamide (CH3CONH2, Hollis et al. 2006). It is therefore a prime target to look for new complex molecules.
Line surveys at (sub)mm wavelengths are needed to search for large complex molecules since these molecules emit hundreds of (weak) lines. Regions with rich chemistry produce very crowded spectra with many blended lines and the confusion limit is easily reached. In this context, the secure identification of a new molecule requires the identification of many lines and no single line predicted by a temperature and column density derived from multiple lines should be missing (see, e.g., the rebuttal of glycine by Snyder et al. 2005). Since the spectra are complex, modeling the emission of all known molecules is necessary to prevent mis-assignments and point out blended lines before claiming the detection of a new molecule.
To search for new complex molecules, we carried out a complete line survey at 3 mm toward the two hot cores SgrB2(N) and SgrB2(M) and we present here some preliminary results.
2 Observations
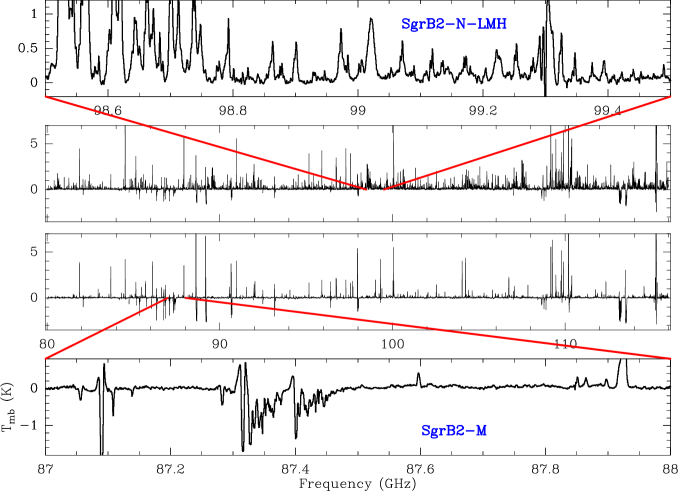
We carried out a complete line survey of SgrB2(N) and SgrB2(M) between 80 and 116 GHz with the IRAM 30 m telescope in 2004 and 2005, as well as partial surveys at 2 mm and 1.3 mm. We obtained an rms sensitivity of 15-30 mK at 3 mm in scale and reached the confusion limit at 1.3 mm. The full 3 mm spectra are shown in Fig. 1, as well as a closer view on two small frequency ranges. The average line density above 3 is about 100 and 25 features per GHz, translating into about 3700 and 950 lines over the whole 80-116 GHz band, for SgrB2(N) and SgrB2(M), respectively. Some lines are seen in absorption with numerous velocity components and are produced by the diffuse spiral arm clouds lying along the line of sight (Hieret et al., in prep.).
3 Modeling and preliminary results
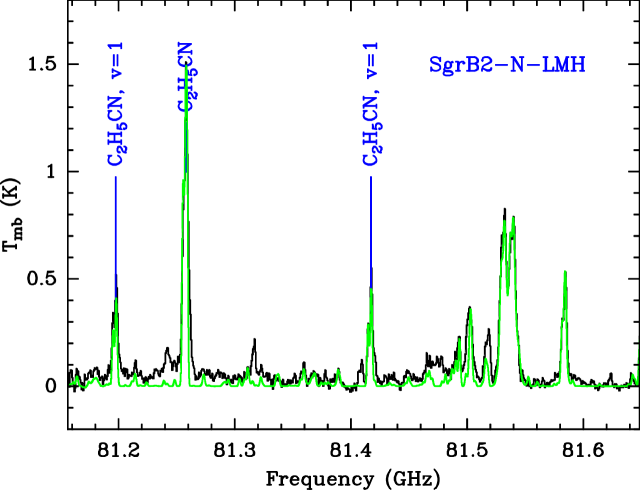
We model the emission of all known molecules, including vibrationally and torsionally excited states, and their isotopologues. We use the XCLASS software (see Comito et al. 2005 , and references therein) to model the emission and absorption lines in the LTE approximation. These calculations take into account beam dilution, lines opacity, and blending. The molecular spectroscopic parameters are taken from our line catalog which mainly contains all entries from the Cologne Database for Molecular Spectroscopy (CDMS, see Müller et al. 2005) and from the molecular spectroscopic database of the Jet Propulsion Laboratory (JPL, see Pickett et al. 1998). Each molecule is modeled separately. The whole spectrum including all the identified molecules is then computed at once (see the example in Fig. 2), and the parameters for each molecule are adjusted again when necessary. The quality of the fit is checked by eye over the whole frequency coverage of the line survey.
The detailed results of this modeling will be published in a forthcoming article (Belloche et al., in prep). So far, we have identified 51 molecules, 60 isotopologues, and 41 vibrationally/torsionally excited states in SgrB2(N), which represent about 60 of the lines detected above 3. In SgrB2(M), the corresponding numbers are 41, 50, 20, and 50, respectively. We detected very few deuterated species, and only simple ones.
Currently, there are still 4050 lines unidentified in our survey of SgrB2(N) and SgrB2(M), respectively, and 157 are even stronger than 0.3 K (i.e. times our noise level). Although most of these unidentified lines are most likely emitted by vibrationally or torsionally excited states of already known molecules missing in our database (e.g. ethanol C2H5OH =1, vinyl cyanide C2H3CN , ethyl cyanide C2H5CN v=2), there is room for detection of new complex molecules. In particular, we have strong evidence that we detected the molecule aminoacetonitrile – a likely precursor of the simplest amino acid, glycine – in our 30 m survey. This detection is supported by follow-up observations we carried out with the Plateau de Bure Interferometer and the Australia Telescope Compact Array in 2006 (Belloche et al., to be submitted). This would be a step forward in the long standing search for amino acids.
References
- Comito et al. (2005) Comito, C., Schilke, P., Phillips, T. G., Lis, D. C., Motte, F., & Mehringer, D. 2005, ApJS, 156, 127
- Hollis, Lovas, & Jewell (2000) Hollis, J. M., Lovas, F. J., & Jewell, P. R. 2000, ApJL, 540, L107
- Hollis et al. (2006) Hollis, J. M., Lovas, F. J., Remijan, A. J., Jewell, P. R., Ilyushin, V. V., & Kleiner, I. 2006, ApJL, 643, L25
- Mehringer et al. (1997) Mehringer, D. M., Snyder, L. E., Miao, Y., & Lovas, F. J. 1997, ApJL, 480, L71
- Müller et al. (2005) Müller, H. S. P., Schlöder, F., Stutzki, J., & Winnewisser, G. 2005, J. Mol. Struct., 742, 215
- Pickett et al. (1998) Pickett, H. M., Poynter, R. L., Cohen, E. A., Delitsky, M. L., Pearson, J. C., & Müller, H. S. P. 1998 , J. Quant. Spectrosc. & Rad. Transfer, 60, 883
- Snyder, Kuan, & Miao (1994) Snyder, L. E., Kuan, Y.-J., & Miao, Y. 1994, The Structure and Content of Molecular Clouds, Lecture Notes in Physics, eds T. L. Wilson and K. J. Johnston (Springer-Verlag), 439, 187
- Snyder et al. (2005) Snyder, L. E., Lovas, F. J., Hollis, J. M., Friedel, D. N., et al. 2005, ApJ, 619, 914