Atomic mass measurements of short-lived nuclides around the doubly-magic
Abstract
Accurate atomic mass measurements of neutron-deficient and neutron-rich nuclides around the doubly-magic and of neutron-rich cesium isotopes were performed with the Penning trap mass spectrometer ISOLTRAP at ISOLDE/CERN. The masses of , , , , , , , , , , , and were determined. The obtained relative mass uncertainty in the range of to is not only required for safe identification of isomeric states but also allows mapping the detailed structure of the mass surface. A mass adjustment procedure was carried out and the results included into the Atomic Mass Evaluation. The resulting separation energies are discussed and the mass spectrometric and laser spectroscopic data are examined for possible correlations.
keywords:
atomic mass , binding energy , Penning trap , radionuclide , isomer , cesium , thallium , lead , bismuth , radium , franciumPACS:
07.75.+h Mass spectrometers , 21.10.Dr Binding energies and masses , 27.70.+q , 27.80.+w , 27.90.+b, ††thanks: This publication comprises part of the Ph.D. thesis of C. Weber. ††thanks: Present address: University of Jyväskylä, FIN-40014 Jyväskylä, Finland , , , ††thanks: Present address: Universität Mainz, D-55099 Mainz, Germany , , , ††thanks: Present address: MPI für Kernphysik, D-69029 Heidelberg, Germany , , and
1 Introduction
The accurate knowledge of atomic masses is required for many areas
of physics [1, 2]. In particular, the mass gives
access to the nuclear binding energy which in turn reveals
distinct features of nuclear structure, notably shell effects and
their relative strength as a function of isospin. This paper
reports on mass data in the vicinity of the doubly-magic
nucleus. Strong nuclear structure effects are
observed in particular at the neutron-deficient side from to . They have been revealed by laser spectroscopic
measurements of the optical isotope shift
[3, 4]. Such measurements allow one to determine
the changes of the root-mean-square charge radii relative to a reference nucleus. Characteristic
irregularities were observed in the isotopic chains of iridium (), platinum (), gold (), mercury (),
and thallium () at approximately mid-shell ().
The most prominent example is the odd-even shape staggering effect
within the mercury isotopes [5, 6]. These
phenomena were first explained for mercury as two different minima
in the potential energy surface at a weakly oblate and a stronger
prolate
deformation (shape coexistence) [7].
In addition, several rotational bands were observed in the nuclear
excitation spectra of these nuclei. An overview on nuclear shape
coexistence of even-mass nuclides is given in [8]. In
, even triple shape coexistence has been observed
[9]. Here, the three lowest energy states having
spin/parity correspond to spherical, oblate and prolate
shapes, all within an energy spanning only . These
phenomena are described by particle-hole excitations of proton
pairs across the closed shell [10, 11]. The
interaction of additional proton-hole pairs and valence neutrons
will lead to a minimum in energy around mid-shell. If the energies
of the ground state and the intruder state are close, tiny changes
in the nuclear binding energy are decisive for the nuclear ground
state shape.
Such minute nuclear binding energy effects in this mass range () are only accessible by mass determinations with mass
uncertainties of . This has been
demonstrated by ISOLTRAP measurements on neutron-deficient mercury
isotopes [12, 13, 14]. In that work, isomeric
states, a 54-keV level in and a 128-keV level in
were even identified. This was the first example
of nuclear spectroscopy by mass spectrometry. The present work
complements the information on high-precision masses in this area
of the chart of nuclei with data on bismuth, lead, and thallium
isotopes. The interconnection of the nuclides studied in this work
by -decay chains results in an improvement of further mass
values up to .
In case no direct experimental data existed, previous mass values
were obtained by a combination of up to four links
with results from mass spectrometry. For example, the
-decay of neutron-deficient bismuth was studied at the
LISOL facility for odd [15] and even isotopes
[16]. All direct data being available in this region
are either ISOLTRAP measurements [13, 17, 18]
or mass determinations by the Schottky technique at the
Experimental Storage Ring ESR [19, 20, 21]. A
detailed comparison to the latter data sets is made in Sec.
6.5. Mass values of neutron-rich cesium isotopes were
previously determined by triplet measurements with a
Mattauch-Herzog
spectrometer [22] and [23].
A particular challenge while addressing the neutron-deficient
nuclides experimentally is caused by the existence of two or even
three isomeric states with both short half-lives and low
excitation energies of sometimes less than . This
requires an extremely
high mass resolution of up to .
Masses on the neutron-rich side of the doubly magic
nucleus are of great importance for predictions
on the stability of superheavy elements, which are stabilized by
shell corrections [24]. A variation of this correction
by about leads to changes in the calculated
half-lives for spontaneous fission or decay by several
orders of magnitude. Since no experimental mass values are
available in this region, model calculations of the shell
correction can be verified at the adjacent shell closure of .
Furthermore, accurate mass values are required in order to provide
reliable reference masses for the calibration of mass data
obtained in measurements at the Experimental Storage Ring ESR
[19, 20, 21]. In an ESR mass determination on
neutron-deficient nuclides [20, 21] 117 reference
masses were used in order to calibrate the 466 mass values studied
in that experiment. In the neutron-rich region the number of
reference masses is particularly low.
2 Experimental setup and procedure
The Penning trap mass spectrometer ISOLTRAP
[25, 26, 27] is installed at the on-line
isotope separator ISOLDE [28] at CERN. Here,
mass-separated beams of short-lived nuclides are provided for
different experiments at an energy of . They are
produced by bombarding a thick target with high-energy
() proton pulses (
protons/pulse) which induce spallation, fission, or fragmentation
reactions. Reaction products diffuse from the heated target into
an ion source region. Here, they are ionized either by surface
ionization, by electron impact in a hot plasma, or a resonant
photo ionization in a resonance ionization
laser ion source (RILIS) [29, 30].
In this experiment nuclides around the shell closure of
were produced by proton-induced (1.4-GeV) spallation and
fragmentation reactions on a target
(). For lead and bismuth a resonant
laser ionization was applied, whereas cesium, thallium, francium,
and radium were surface-ionized. Finally, the ions were
mass-selected with a resolving power of in the high-resolution separator
(HRS).
Figure 1 shows a schematic of the ISOLTRAP
mass spectrometer. The radiofrequency quadrupole (RFQ) cooler and
buncher [26] decelerates and accumulates the
continuous 60-keV ISOLDE beam and delivers a cooled, low-energy
ion bunch for efficient injection into the preparation Penning
trap [31].
![[Uncaptioned image]](/html/0801.2068/assets/x1.png)
Figure 1: Schematic view of the Penning trap mass spectrometer ISOLTRAP (For details see text).
Here, a mass-selective buffer-gas cooling scheme [32]
is employed in order to separate isobars. A resolving power, , of up to can be
achieved in this process. In the precision Penning trap, the mass
of a stored ion species with charge is determined via a
measurement of its cyclotron frequency , where denotes the strength of the magnetic
field. A cyclotron resonance spectrum is obtained by the
time-of-flight detection method [33, 34]: The
extra radial kinetic energy resulting from the resonant excitation
with an azimuthal quadrupolar RF-field at is detected by a reduction in the time of flight of the
ejected ions towards a detector (MCP5 in Fig.
1). The resolving power is approximately
given by the product of the cyclotron frequency and the
observation time: [35]. A more detailed
description of a typical measurement cycle at ISOLTRAP can be
found in a recent publication
[36].
An illustrative example of a cyclotron resonance curve is shown in
Fig. 2. In such a resonance curve, the
mean time of flight of the ions is displayed as a function of the
applied radiofrequency, and a resonant excitation can be
recognized by a shorter flight time. The diagram comprises 16
frequency scans containing a total amount of 1820 detected ions.
The linewidth of the central resonance, as given by the Fourier
limit , results in a resolving power of (mass resolution ) with an excitation time of the quadrupolar
RF-field . This is
sufficiently high to resolve ground and isomeric states of
. The theoretical lineshape [34] was
used to fit the data points. In order to calibrate the strength of
the magnetic field , the cyclotron frequency of a reference
nuclide with well-known mass value is determined in regular time
intervals. This allows for the accurate mass determination of
short-lived nuclides far from stability with relative mass
uncertainties
[37, 38]. Examples of recent measurements on
[39] as well as on several isotopes of
potassium [40], nickel, copper, gallium
[41], and krypton [42] cover a wide mass
range from .
![[Uncaptioned image]](/html/0801.2068/assets/x2.png)
Figure 2: Cyclotron resonance curve of ions. The solid line is a fit of the theoretical lineshape [34] to the data points.
3 Data analysis
3.1 Determination of the cyclotron frequency ratios
The primary result of an ISOLTRAP measurement is the cyclotron frequency ratio of a reference ion with well-known mass relative to the ion species to be determined. Thus, these experimental ratios are independent from the uncertainty of the reference mass . From the ratios , the atomic mass of the nuclide under study can be deduced by
| (1) |
Here, the atomic mass of the reference ion is indicated by
and is
the mass of the electron. A correction for the binding energy of
the missing electron in the order of eV can be neglected.
Extensive studies using carbon cluster ions
[37, 43] helped to improve the assessment of
systematic effects. For example, systematic errors like
mass-dependent frequency shifts or the effect of a variation in
the magnetic field strength were quantified. In addition, these
investigations result in a better estimate of the final
uncertainty of the mass determination. The residual systematic
error of the ISOLTRAP mass measurements, estimated previously to
be , was determined in [37] to be
| (2) |
The data analysis was performed as described in [37]. Some aspects that are essential in the analysis of the data presented here are summarized in the following.
3.2 The presence of ions of different mass values
Simultaneous storage of ions of different mass values may result
in a shift of the line center of the cyclotron frequency
resonance. Such possible contaminations depend on the ion
production process. In the case of measurements at ISOLTRAP,
isobars or nuclides in isomeric states might be present in
addition to the nuclide under investigation. Systematic
experimental studies using 10 to 70 ions stored in the trap as
well as simulations with two ions interacting by Coulomb forces
are discussed in [44] and [45]: If the two
ions have different masses, the resulting frequency shifts depend
on the relative distance of the line centers divided by the
linewidth that is chosen during the measurement process. If both
lines cannot be resolved, only one cyclotron resonance is
observed at the frequency of the center of gravity. If the
cyclotron resonances of both ion species can be resolved, both
line centers are shifted to lower frequencies. The size of the
shift has been found to be
proportional to the number of stored ions.
To be able to exclude the possible presence of ions of different
mass in these measurements, the line center of the cyclotron
resonance is analyzed with respect to the number of ions
registered by MCP 5 (see Fig. 1) in a
so-called count-rate-class analysis. The number of ions counted by
the microchannel plate detector after each irradiation of the
stored ion cloud with radiofrequency and ejection from the trap is
subdivided into at least three count-rate classes with comparable
average ion counts . A possible shift
induced by a contamination is hence corrected by
extrapolating the cyclotron frequency to a vanishing number of
detected ions.
![[Uncaptioned image]](/html/0801.2068/assets/x3.png)
Figure 3: Dependance of the frequency of the cyclotron resonance on the number of detected ions for (top) and (bottom). Both measurements were performed with an excitation time . The center frequency is plotted versus the count-rate class containing an average number of as detected by MCP 5 (see Fig. 1). The straight line is a linear regression weighted by the individual error bars. The frequency , extrapolated to zero ions and its respective error is used as the final result.
Two examples of a count-rate-class analysis, both with the same average number of ions per count-rate class , are shown in Fig. 3. The upper plot shows a measurement done with stable ions from the off-line alkali ion source (see Fig. 1), which delivers only surface-ionized alkali elements. The resulting fit of the slope of shows no count-rate dependent effect. The lower one shows a measurement of the radionuclide as delivered by ISOLDE. With an increasing number of detected ions per cycle a significant slope of of the cyclotron frequency towards lower values is observed. This might be due to the presence of ions in the isomeric state. See also the discussion on the nuclide in Sec. 6.2. Combining several measurements, the final value of a frequency ratio is obtained from the weighted mean of individual results.
3.3 Correcting the mass-dependent systematic frequency shift
An ion species experiences a frequency shift which can originate for example from electric field imperfections or a possible misalignment of the magnetic and electric field axis versus each other [25]. Since these shifts are to first order mass-independent, this results in a systematic shift in the determination of the frequency ratios, depending on the mass difference between the mass of interest m and the reference mass . The upper limit of this effect has been previously estimated to [46]. Frequency ratios between carbon clusters whose values are exactly known were quantified by a linear dependance [37],
| (3) |
where is the difference between the measured and the true frequency ratio. In the experiments reported here, covering the mass region between and , the reference mass of ***This reference was chosen due to its high purity when delivered from the ISOLTRAP off-line ion source. () differs by about 70 mass units from the mass to be determined. After applying the correction given by Eq. (3) an uncertainty of the same size,
| (4) |
is added quadratically to the uncertainty. Due to the large mass difference , this yields an additional error on the order of 1 keV to the deduced mass excess value. In the end, the residual systematic uncertainty of (Eq. (2)) is added quadratically to obtain the final uncertainty.
3.4 Mass-to-state assignment
An unambiguous mass assignment to a specific state, ground state or isomer, is not possible if a non-resolved mixture of nuclei in their ground and isomeric states is present. If the production ratio (isomer to ground state), and the isomeric excitation energy are known, the ground state mass m can be extrapolated from the mass , corresponding to the observed cyclotron resonance, by [23]
| (5) |
If the production ratio of two ion species in ground and isomeric
state is not known, the presence of the so-called contamination
can be observed in the data analysis by studying the behavior of
the resulting cyclotron frequency as a function of the count rate
class (see Fig. 3). Only in the rare case of
very similar half-lives of the ion under investigation and
contaminating ion,
contaminations might remain undiscovered.
Table LABEL:A_kap5_NUBASE lists all relevant data of the nuclides
that have been studied: Half-life , spin state
and the isomeric excitation energy . In case several isomeric
states are known to exist, those having a half-life longer than
are
listed†††Such
short half-lives are also given in order to provide information on
spin systematics. Nuclides with are not
considered as contaminants in the studies reported here, since the
typical storage time of exceeds by far ..
The assignment of a measured mass value to an isomeric state is
performed under the assumption that isomeric states with a given
and excitation energy might appear as listed in Tab.
LABEL:A_kap5_NUBASE. The chosen RF-excitation time results in a
width of the cyclotron resonance , which corresponds to a width in energy units. This value is also called mass
resolution and is listed in the last column, since it serves as an
important criterion for the observation of a contamination and
hence for the identification of the states.
| Nuclide | Half-Life | Spin/Parity | Excitation | ||||||||||||||||||
|---|---|---|---|---|---|---|---|---|---|---|---|---|---|---|---|---|---|---|---|---|---|
| energy [keV] | [keV] | ||||||||||||||||||||
| 582 | ms | 220 | |||||||||||||||||||
| 225 | ms | () | 660 | ||||||||||||||||||
| 3.4 | s | # | 340 | ||||||||||||||||||
| 2.7 | ms | # | 850(30) | 340 | |||||||||||||||||
| 6.9 | s | # | 340 | ||||||||||||||||||
| 60 | ms | # | 625(17) | 340 | |||||||||||||||||
| *& | 40# | s | () | 210 | |||||||||||||||||
| *& | 27.5 | s | () | 40(190) | 210 | ||||||||||||||||
| 2.9 | s | () | 420(190) | 210 | |||||||||||||||||
| 51 | s | () | 540 | ||||||||||||||||||
| 15.6 | s | () | 332(4) | 540 | |||||||||||||||||
| 1.84 | h | 120 | |||||||||||||||||||
| 1.41 | h | () | 394.2(5) | 120 | |||||||||||||||||
| stable | 430 | ||||||||||||||||||||
| 8 | min | 120 | |||||||||||||||||||
| 43 | min | 319.3(7) | 120 | ||||||||||||||||||
| stable | 270 | ||||||||||||||||||||
| * | 6.3 | s | () | 560 | |||||||||||||||||
| * | 6.2 | s | () | 150(190) | 560 | ||||||||||||||||
| 500 | ns | # | 420(190) | 560 | |||||||||||||||||
| 12.3 | s | () | 110 | ||||||||||||||||||
| 128 | ms | () | 242(7) | 110 | |||||||||||||||||
| 34.6 | s | () | 110 | ||||||||||||||||||
| 39.6 | s | () | 210(50)# | 110 | |||||||||||||||||
| 67 | s | () | 110 | ||||||||||||||||||
| 3.2 | s | () | 308(7) | 110 | |||||||||||||||||
| * | 95 | s | () | 580 | |||||||||||||||||
| * | 125 | s | (,) | 100(70)# | 580 | ||||||||||||||||
| * | 115 | s | () | 230(310) | 580 | ||||||||||||||||
| 183 | s | # | 120 | ||||||||||||||||||
| 87 | s | # | 399(6) | 120 | |||||||||||||||||
| 5.1 | min | () | 590 | ||||||||||||||||||
| 0.6 | s | () | 167(3) | 590 | |||||||||||||||||
| 4 | min | () | 270(4) | 590 | |||||||||||||||||
| 9.3 | min | () | 600 | ||||||||||||||||||
| 5.04 | min | () | 350(160) | 600 | |||||||||||||||||
| 19 | Ey | 270 | |||||||||||||||||||
| 7.6 | min | () | 470 | ||||||||||||||||||
| 36.4 | min | () | 1347.5(2.5) | 470 | |||||||||||||||||
| 2.17 | min | # | 480 | ||||||||||||||||||
| 550 | ms | # | 420 | ||||||||||||||||||
| 3.85 | s | () | 260 | ||||||||||||||||||
| 50.2 | s | # | 810 | ||||||||||||||||||
| 2.46 | s | 470 | |||||||||||||||||||
| 4 | min | 810 | |||||||||||||||||||
| 93 | min | 330 | |||||||||||||||||||
|
|||||||||||||||||||||
3.5 Effects determining the production ratio of isomeric states
In the measurements reported here possible contaminations are
mostly isomeric states, which could not be separated in the
preparation Penning trap. Exceptions are the heavy isobars
and . The spallation process
does not transfer large angular momentum and hence low-spin states
are predominantly produced. Fragmentation reactions lead to a
production of higher spin states. Nuclides in states with
half-lives shorter than few 10 ms are suppressed due to the slow
release time of the reaction products from the ISOLDE target and
the time needed for the isobaric separation in the preparation
Penning trap (see Fig. 1).
A further selection of an atom in a specific nuclear state can be
obtained by resonance laser ionization (RIS) with the ISOLDE laser
ion source and a proper choice of laser wavelengths and bandwidths
[29]. Due to different hyperfine splittings and isotope
shifts in the ground and isomeric state, RIS can enhance the selectivity.
In the case of bismuth investigated in the present work, the
lasers were used in the broad-band mode. The production ratios in
this experiment can not be deduced from previous measurements with
the conventional ion source at ISOLDE. For lead, the applied
broad-band mode (laser bandwidth = 10 GHz) does not result in a
selection of isomeric states, since the isomeric shift and
hyperfine splitting are smaller or of the same size as the laser
bandwidth.
4 Experimental results
Table LABEL:A_kap5_ratios lists all frequency ratios that were determined relative to the cyclotron frequency of ions. If possible, the assignment to a particular isomeric state is indicated and will be discussed in Sec. 6. The last column lists all mass excess values deduced from the determined frequency ratios .
| Nuclide | Frequency ratio | Mass excess | |
|---|---|---|---|
| [keV] | |||
| 1.090516444(91) | -60052(11) | ||
| 1.10562975(48) | -52011(60) | ||
| 1.361768475(82) | -12802(10) | ||
| 1.376786217(81) | -16592(10) | ||
| 1.399332234(69) | -19874.4(8.6) | ||
| 1.40683800(18) | -22154(23) | ||
| 1.474515617(98) | -27103(12) | ||
| 1.542259739(82) | -23818(10) | ||
| 1.482061386(45) | -24429.5(5.5) | ||
| 1.564849038(42) | -21742.2(5.2) | ||
| 1.42950438(20) | -10535(25) | ||
| 1.437006669(64) | -13244.9(8.0) | ||
| 1.444529605(72) | -13398.5(9.0) | ||
| 1.452033781(84) | -15875(10) | ||
| 1.45955793(12) | -15878(50)‡‡‡The original error of is increased in the AME2003 due to a possible contamination by the and states. | ||
| 1.467064775(45) | -18023.7(5.6) | ||
| 1.47459021(12) | -17868(50) ∗∗ | ||
| 1.482099666(89) | -19706(25)§§§Value corrected by in the AME2003 for possible contamination from . | ||
| 1.572401384(35) | -18254.9(4.3) | ||
| 1.61770721(12) | 1648(15) | ||
| 1.625265520(93) | 5873(11) | ||
| 1.52741073(13) | 861(16) | ||
| 1.542441561(73) | -1308.6(9.0) | ||
| 1.72332168(30) | 35816(37) | ||
| 1.61017053(17) | 100(20) | ||
| 1.72329550(16) | 32575(19) | ||
| 1.73083537(10) | 34518(12) |
5 Atomic mass evaluation
The Atomic Mass Evaluation AME is an adjustment procedure giving mass data for all those nuclides where relevant experimental information, like for example mass values or half-lives, are known. Such an evaluation was performed in December 2002 before these ISOLTRAP data were included. This atomic mass evaluation is referred to in the following as Intermediate Atomic Mass Evaluation 2002 (IAME2002). It is an up-to-date adjustment after the published issue of AME1995 [50] and the NUBASE compilation [47]. The assignment of the observed cyclotron resonances to nuclear states was not straightforward at all since this area of the chart of nuclei is rich in low-lying isomers. Subsequently, the ISOLTRAP results, reported in this publication, were included into the Atomic Mass Evaluation 2003. A detailed description of the adjustment procedure is given in the particular issues of the AME [50, 51, 52]. Here, only some general features that are relevant for this work are described. As a result of the AME, adjusted mass values are obtained from different types of experimental input data. Even though a possible existence of more than 6000 different combinations of protons and neutrons is predicted, data from only approximately 2830 nuclides are available [53]. If direct experimental data are not existing for nuclides near to the region of known masses, mass values are extrapolated from systematic, experimental trends. All experimental results can be represented as a relation between two (and more) nuclides. They span a net of interconnections between nuclides across the whole nuclear chart as it can be seen in the diagram for to (Fig. 4).
![[Uncaptioned image]](/html/0801.2068/assets/x4.png)
Figure 4: Connection diagram between nuclides of mass number A and neutron excess (N - Z ). The symbols indicate primary nuclides (big symbols, with ’’ being an absolute mass-doublet nuclide) and secondary nuclides (small symbols). The latter ones can be distinguished between experimental data (filled) and extrapolated values from systematic trends (open). Primary connections are direct mass spectroscopic data (double line) or reaction data (single line), while thicker lines indicate data with higher precision. All secondary nuclides are connected via dashed lines. This plot is taken from the AME2003 [54].
For the present ISOLTRAP data giving a frequency ratio to a
nuclide with precisely known atomic mass value, these connections
are linked to the mass of , which has been
determined with a relative uncertainty of only
[49].
All input data are transformed into a set of linear equations. For
the case of experimental frequency ratios this is explained in
[55]. Each datum with a standard deviation
represents a link between two, three, or four unknown
masses . The over-determined set of X equations
for Y mass values is represented as a set of
linear equations with Y parameters and is finally solved by
the least-squares method as described in [53]. Most of
the ISOLTRAP frequency ratios that are published in the present
work were introduced already into the most recently published
atomic mass evaluation, i.e. AME2003 [52].
6 Assignment of the observed cyclotron resonances to nuclear states
The assignment of a measured mass value to an isomeric state is performed under the assumption that isomeric states with a given and excitation energy might appear as listed in Tab. LABEL:A_kap5_NUBASE.
6.1 Nuclides with odd mass number
In this section those odd-mass nuclides having a long-lived
isomeric state are discussed. According to Tab.
LABEL:A_kap5_NUBASE the ground states of and have always a low spin value,
whereas in the bismuth isotopes the
ground state has a high spin.
The comparison of the results of Tab. LABEL:A_kap5_ratios with
those of the intermediate adjustment (IAME2002) [48],
helps to indicate which spin states have most probably been
produced during the experiment. Shown in Fig. 5 is such a
comparison of the ISOLTRAP masses to the IAME2002 masses with and
without the added isomeric energy. The zero line depicts the
experimental ISOLTRAP data with their uncertainties. The
differences to the literature values are indicated by open
symbols, whereas the position of excited nuclear states is taken
from the current NUBASE data (Tab. LABEL:A_kap5_NUBASE)
[47, 48]. The uncertainty of the excited state is
derived by adding the uncertainties of the
ground state mass value and the excitation energy quadratically.
![[Uncaptioned image]](/html/0801.2068/assets/x5.png)
Figure 5: Comparison of ISOLTRAP mass values for odd-even and even-odd nuclides to literature values. The zero line represents the experimental ISOLTRAP data with their uncertainties. Open symbols indicate the results of an intermediate atomic mass evaluation performed end of 2002 (IAME2002). IAME2002 includes all literature values available at that time but not the ISOLTRAP data. The excitation energies are taken from NUBASE [47, 48].
and : Here, the
half-lives of the excited isomeric states () of
for and for
, are much shorter than the duration of a
measurement cycle (approximately ). Therefore, the
measured cyclotron frequency ratios are clearly assigned to the
respective ground states. The measurements of ISOLTRAP agree with
the values from the intermediate adjustment IAME2002 (compare Fig.
5), but the uncertainties got significantly
improved.
: The measurement of the nuclide
has been performed with a mass resolution of
, which is insufficient to resolve both ground and
isomeric states, differing by . Hence, an
eventually present admixture of either of the states can not be
excluded. The determined ISOLTRAP value suggests a predominant production of the isomer.
: The mass values of both ground and
isomeric states in are listed in IAME2002 with
uncertainties of only . The value resulting from
the ISOLTRAP measurement with a final uncertainty of
agrees within the error bars to the one of the
excited state () and
hence is assigned to it.
, : A series
of bismuth isotopes with odd mass numbers
and has been studied. With the exception of the case of
the mass resolution (see Tab.
LABEL:A_kap5_NUBASE) is at least a factor of two smaller than the
mass difference between both states. Therefore, a contamination of
the respective second state is definitely excluded in the
count-rate-class analysis. The remaining question which of the two
states has been measured cannot be solved easily. Yield
measurements for lead and bismuth isotopes at ISOLDE reveal that
states having higher spin values are predominantly produced
[30]. These are for the ground states of bismuth. Indeed, the comparison of the
ISOLTRAP results shows a good agreement with the values of the
intermediate evaluation IAME2002 for the ground states of
. The measurements of
were performed with a resolution of
which is not sufficient to resolve ground and
isomeric state, differing by . Measurements
of the neighboring odd- isotopes and
with approximately resolution
did not show any hint of a contamination by an excited state. A
systematic comparison of individual measurements with low
() and high () resolution was used
in order to quantify a correction by a possible contamination by
the excited state. This correction of
increases the uncertainty of the ISOLTRAP
value in the atomic mass table AME2003 from to
.
Considering the isomeric states of all odd-mass nuclides studied
here a consistent picture is observed. Except for cases where the
presence of a state can be excluded right away due to its short
half-life, higher spin states are predominantly produced. In
and these are the excited states with spins of and . In bismuth () the ground states have a higher spin value of .
For the nuclide with an excited state of energy and a spin , the ground state
mass value has been determined.
6.2 Nuclides with even mass number
In order to facilitate a spin-to-state assignment, the present
ISOLTRAP data are plotted in Fig. 6 and compared relative
to ground state mass values and excitation energies from the
intermediate evaluation IAME2002. These nuclides have sometimes
two excited, long-lived states (see also Tab.
LABEL:A_kap5_NUBASE). Excitation energies of states with
half-lives longer than are shown.
Apart from the -state of all
nuclides have half-lives that are sufficiently long () in order to be studied with the Penning trap mass
spectrometer ISOLTRAP. Due to the lack of any quantitative
information on production ratios, a conclusion can be only based
on a systematic comparison within the current data. In analogy to
the nuclides of odd mass number, it is expected that lower spin
states will be produced with lower yields.
![[Uncaptioned image]](/html/0801.2068/assets/x6.png)
Figure 6: Comparison of even- mass values from ISOLTRAP to an intermediate atomic mass evaluation (IAME2002). The zero line represents the experimental data points obtained within this work with their uncertainties. Excited, long-lived states as they are listed in NUBASE [47, 48] are shown by open triangles. Those isomeric states with the higher excitation energy are depicted by a triangle pointing upwards.
: An unambiguous assignment of the
ISOLTRAP mass value to one of the long-lived states in
is not straightforward. This is also reflected
by the different spin assignments given in NUBASE (Tab.
LABEL:A_kap5_NUBASE) and in the Evaluated Nuclear Structure Data
Files (ENSDF). Mass values of both excited states are given with
uncertainties of . The energy difference between
and is
[16]. The attempt to employ a
very long RF-excitation of , corresponding to a mass
resolution of , failed. For excitation
times beyond , a decay of the stored ions has been
observed (see half-lives in Tab. LABEL:A_kap5_NUBASE).
Figure 7 shows the results of the four cyclotron
frequency measurements. With a mass resolution of
(measurement # 2 - 4) a mixture between and
is resolved and the presence of either of
the states should have been detected. Measurement # 2 and # 4
yield count-rate-class corrected frequencies. The slope in
[mHz/ion] of the linear extrapolation of the cyclotron frequency
of is indicated for each measurement. The
third data point (# 3), which has been obtained after an
additional waiting time of in the upper precision
trap, does not show a significant count rate effect, since this
measurement allowed for a decay of the -state. To avoid any undetected contamination from
the low-resolution measurement # 1, it was not considered in the
final weighted average of the frequency ratio. After a comparison
to the spin systematics, as given in Tab. LABEL:A_kap5_NUBASE, and
the agreement of the ISOLTRAP value with the intermediate
evaluation IAME2002 this result is assigned to the
state. It is not excluded that a small
contamination by the ground
state () might be present.
![[Uncaptioned image]](/html/0801.2068/assets/x7.png)
Figure 7: Four cyclotron frequency measurements for with two different excitation times as indicated. corresponds to a mass resolution of and to . The result of the count-rate-class analysis of the cyclotron resonance of is given for each data point. In the measurement #3 an additional waiting time in the precision trap of has been employed prior to the frequency determination.
: The mass resolution, being
during this measurement, was sufficiently high to
separate both states of . The resulting ISOLTRAP
value agrees with the mass value of the excited, medium spin state
(, )
though the uncertainties of the IAME2002 values are rather
large.
: These nuclides have three
long-living states similar to almost all even- bismuth isotopes
up to . The excitation energies of about
are all known with uncertainties of around
, except for (Fig. 6).
The resolving power employed during those cyclotron frequency
measurements of approximately corresponds to a
mass resolution between and . In order to
obtain a mass resolution of an excitation time of
is required.
The mass value of ISOLTRAP for agrees well to
the one of the -state ().
However, a contamination cannot be excluded. Accounting for a
possible admixture of either the or the state the
original uncertainty of had been increased to
in the AME2003.
Due to the good agreement for , it is concluded
that the medium spin state has been predominantly produced for
as well. Since the possible presence of both
isomeric states, and , whereas each of them is about
different in energy, cannot be excluded with a
resolution of , the original error of
is increased in the Atomic Mass
Evaluation 2003 to .
In the medium
spin state exhibits a half-life in the nanoseconds regime.
The measured ISOLTRAP value with uncertainty
agrees within to the value of the -state
(). Due to the minor resolution during the
measurement, a mixture of both states and
differing by
might be present.
: In contrast to other even- bismuth isotopes from to , no medium nuclear spin of, for example, or has been observed. However, the general trend in this experiment points to a favored production of medium spin states, or 7. The question on the production ratio between the ground state and the excited state remains unsolved. From the general trend throughout all these measurements it is observed, that it is the higher spin state that is produced with a higher weight and measured in the trap. Consequently the mass value has been tentatively assigned to in the Atomic Mass Evaluation 2003. In the mass measurement of this nuclide two observations are made: First, the counting class analysis of two individual measurements with a resolution of indicate the presence of a contamination and give a shifted, extrapolated value. Secondly, the characteristic pattern for an in-trap decay with short half-life is observed in the time-of-flight spectrum although the half-lives of both known states are more than ten times longer than the excitation time of . This might indicate a third, so far unknown, isomeric state with shorter half-life or any other contamination.
6.3 Isobaric nuclides and
The nuclides and were stored simultaneously in the precision trap since the applied mass resolving power in the preparation Penning trap was not sufficient to separate the -isobars. Figure 8 shows the cyclotron resonance curves of the isobars, which differ in mass by .
![[Uncaptioned image]](/html/0801.2068/assets/x8.png)
Figure 8: Cyclotron resonance curves of the isobars (left) and (right). Both isobars were simultaneously delivered from the preparation trap to the precision trap.
The center frequencies including the first sidebands are clearly
separated with a resolving power of ,
using an excitation time of . A superposition of two individual cyclotron
resonance curves, weighed by their relative abundance, was fitted
to the data points. Assuming a detection efficiency of the
microchannel plate of 30 %, the average number of detected ions
of 2.5 corresponds to about eight ions that were simultaneously
stored. Therefore, the possibility of a frequency shift dependent
on the number of ions (see Sec. 3.2) was investigated
in a detailed count-rate-class analysis.
The result of such an analysis is plotted in Fig.
9 for the cyclotron frequencies of
(left) and (right). Here, a
total number of 2340 registered ions was subdivided into three
(upper diagrams) as well as into four (lower diagrams) count-rate
classes. Different subdivisions were made in order to
exclude any possible count-rate dependance produced within the
statistics. In both cases no significant count-rate dependance is
observed.
![[Uncaptioned image]](/html/0801.2068/assets/x9.png)
Figure 9: Count-rate-class analysis for isobaric ions (left) and (right) of the signal shown in Fig. 8. All registered ions were subdivided into three (upper diagrams) as well as into four (lower diagrams) count rate classes. The data points are fitted by linear regression. The resulting slopes and center frequencies of the cyclotron resonances are given in the inset. None of the individual measurements shows a significant variation of the cyclotron frequency on the number of detected ions.
6.4 Other nuclides
Figure 10 shows the mass excess values of other nuclides studied in this work, including the stable isotopes , , and . The masses of these stable isotopes, which are known with high accuracy, agree within one standard deviation with IAME2002. The largest discrepancies are observed for (), (), and ().
![[Uncaptioned image]](/html/0801.2068/assets/x10.png)
Figure 10: Comparison of ISOLTRAP mass values to the intermediate adjustment of the Atomic Mass Evaluation IAME2002. The line at zero represents the experimental ISOLTRAP values with their uncertainties. The inset shows an enlarged scale for the stable nuclides.
6.5 Comparison to other experimental data
Some of the mass values which are reported in this work have also been determined by Schottky mass spectrometry in the Experimental Storage Ring ESR at GSI [20, 21]. Figure 11 compares the results of both experiments and the values of the IAME2002. A larger set of data is obtained by including also the indirectly determined results at ESR using values from literature [20]. In most of the cases the data from both measurement techniques agree within their uncertainties. An exception is the nuclide , where both values differ by more than . Since the ESR value has been indirectly determined, this discrepancy could be attributed as well to the value.
![[Uncaptioned image]](/html/0801.2068/assets/x11.png)
Figure 11: Comparison of ISOLTRAP, ESR data, and the values of the intermediate adjustment IAME2002 [48]. The ESR values are distinguished between direct measurements (open triangles) and indirect (closed triangles) data which are linked to direct ESR measurements by values from literature. All directly determined ESR values are taken from [21], whereas the indirectly determined ones are from [20]. For some of the latter cases a direct value of a mixture of isomeric states is given in [21]. The symbol ’x’ denotes those nuclides where an isomeric mixture has not been resolved.
7 Results
Table LABEL:A_kap5_MA8_input compiles the mass excesses of those
radionuclides discussed here and compares the data with values
given in NUBASE 1997 [47] and [48]. In
addition, the results of the atomic mass evaluation published in
2003 (AME2003) are given, which include the ISOLTRAP results. Due
to the manifold interconnections, the present ISOLTRAP data
improve not only the directly measured nuclides, but also a large
region from to interconnected via
chains in particular. Fig. 12 shows the
respective section of the nuclear chart from tantalum to neptunium
isotopes, indicating all related nuclides in this region.
For primary nuclides, which directly contribute to the adjustment
procedure, the total influence of each input value in the AME is
given in Tab. LABEL:A_kap5_MA8_input by the significance in
per cent. It is the sum of all influences on individual mass
values . The quantity ’v/s’ denotes the difference
between both values, divided by the uncertainty of the ISOLTRAP
value. The last column marks those data which were not used in the
adjustment procedure. This is the case, if, for example, a
contamination of the ISOLTRAP measurement by a further isomeric
state could not be excluded, or if, for the stable nuclides,
another high-accuracy mass determination already exists, which is
at least three times more precise than the ISOLTRAP value.
In addition, the mass values of around 100 other nuclides changed
after the atomic mass evaluation with the ISOLTRAP data reported
here. The largest modifications in the adjusted mass values is
observed for ().
![[Uncaptioned image]](/html/0801.2068/assets/x12.png)
Figure 12: Region of the nuclear chart around and , indicating the nuclides measured by ISOLTRAP (in red). All other nuclides which are connected to ISOLTRAP data are shown (in blue). Color figure online.
| Nuclide | Mass excess [keV] | Sign. | v/s | Remark | ||
|---|---|---|---|---|---|---|
| ISOLTRAP | NUBASE1997 and [48] | AME2003 | % | |||
| -60052(11) | -60180(50) | -60057(11) | 94 | -0.4 | ||
| -52011(60) | -52290(150) | -52020(50) | 79 | -0.1 | ||
| -12802(10) | -12490#(300#) | -12801(9) | 92 | -0.2 | ||
| -16592(10) | -16290#(190#) | -16587(10) | 91 | 0.4 | ||
| -19874.4(8.6) | -19980(50) | -19874(9) | 100 | |||
| -22154(23) | -22085(22) | -22109(8) | 2 | F | ||
| -27103(12) | -27470#(100#) | -27497(12) | 100 | E | ||
| -23818(10) | -23820.8(1.4) | -23820.6(1.3) | -0.3 | U | ||
| -24429.5(5.5) | -24423(15) | -24429(6) | 100 | |||
| -21742.2(5.2) | -21749.6(1.3) | -21748.5(1.2) | -1.2 | U | ||
| -10535(25) | -10590(50) | -10483(10) | 2.1 | F | ||
| -13244.9(8.0) | -13211(23) | -13240(7) | 86 | 0.6 | ||
| -13398.5(9.0) | -13220#(120#) | -13399(9) | 100 | ¶¶¶Tentative assignment | ||
| -15875(10) | -15870(80) | -15873(10) | 100 | 0.2 | ||
| -15878(50) | -15970#(440#) | -15880(50) | 100 | |||
| -18023.7(5.6) | -18039(21) | -18024(6) | 100 | |||
| -17868(50) | -17856(30) | -17842(25) | 100 | 0.5 | ||
| -19706(25) | -19689(15) | -19688(8) | 100 | 0.8 | ||
| -18254.9(4.3) | -18259.1(1.5) | -18258.5(1.4) | -0.8 | U | ||
| 1648(15) | 1710(100) | 1649(15) | 100 | |||
| 5873(11) | 5780#(100#) | 5874(11) | 100 | |||
| 861(16) | 870(70) | 861(16) | 100 | |||
| -1308.6(9.0) | -1310(50) | -1310(8) | 100 | -0.1 | ||
| 35816(37) | 35790#(360#) | 35820(40) | 100 | |||
| 100(20) | 100(10) | 101(9) | 100 | 0 | ||
| 32575(19) | 32440(60) | 32563(19) | 91 | -0.6 | ||
| 34518(12) | 34550(30) | 34518(12) | 100 | |||
8 Discussion
8.1 Irregularities of the mass surface
The mass values and the corresponding nuclear binding energies represent the underlying forces acting in a nucleus. In analogy to the ionization potential of atoms, plots of separation energies for the removal of two protons,
| (6) |
or two neutrons,
| (7) |
reveal the details of nuclear shell structure. In
this representation, odd-even effects caused by the usually much
larger binding energy for even proton or neutron
numbers are removed.
Figures 13 and 14 show the behavior of separation
energies for protons and neutrons versus the respective nucleon
number. The results from AME1995 and AME2003 are compared. A
global trend, a continuous decrease in the separation energies, is
observed. Discontinuities from this general trend appear at shell
closures or in regions of strong deformations. The shell
closure is clearly visible in Fig. 13. The much less
pronounced strength of the proton shell closure is larger
at the magic neutron number than at the half-filled shell
(Fig. 14). The main differences between the
appearance of the mass surface in 1995 and 2003 are substantially
reduced uncertainties, due to improved as well as numerous new
experimental input data. These are ISOLTRAP measurements in the
isotopic chains of mercury, platinum, lead, polonium, radon, and
radium [12, 13, 56] as well as a large number
of new results obtained at the ESR by the Schottky technique
[19, 20, 21]. In particular the small
uncertainty () of data from
ISOLTRAP along the extended isotopic chain from
to enables the observation of finer nuclear
structure effects and to study, for example, nuclear shape
coexistence and the influence of low-excitation intruder states
[13, 14, 57]. Note the pronounced
irregularities in the
thallium isotopic chain at neutron numbers and 114.
The two-proton separation energies are much more regular and
smooth in this region of the nuclear chart than those for two
neutrons. However, a peculiar irregularity in the two-proton
separation energies appears for the isotopes of thallium () with even neutron numbers from 98 to 108: Some separation
energies are nearly equal or even higher than those of the
isotopes with one additional neutron. Such an effect is very
uncommon in the chart of nuclei.
![[Uncaptioned image]](/html/0801.2068/assets/x13.png)
![[Uncaptioned image]](/html/0801.2068/assets/x14.png)
Figure 13: Comparison of two-neutron separation energies as obtained in AME1995 [50] and 2003. Color figure online.
![[Uncaptioned image]](/html/0801.2068/assets/x15.png)
![[Uncaptioned image]](/html/0801.2068/assets/x16.png)
Figure 14: Comparison of two-proton separation energies as obtained in AME1995 [50] and 2003. Color figure online.
In order to investigate this anomalous behavior further, the
two-proton separation energies are plotted in Fig. 15
against the neutron number and the isotopes of an element are
connected by lines. This presentation shows very clearly in the
region of the lead isotopes at the steadily increasing
shell gap from mid-shell towards the magic neutron
number . Also the above mentioned irregularities in the
thallium and (less pronounced) in the mercury isotopes are
revealed distinctly as an odd-even effect. The reason for this
effect is unclear. Three possible explanations
are discussed in the following:
1. The masses of and ,
determined with ISOLTRAP cyclotron resonances and included in
AME2003, were wrongly assigned to the ground states of these
isotopes. However, an assignment to the isomeric states
(excitation energy or ) would increase the staggering even further. Also
the mass of is determined to more than 60 % by
ISOLTRAP, but in this case indirectly via the value of the
decay and the directly measured mass of
. Also here, a possible problem in the assignment
can be excluded due to the sufficiently high resolving power for
separating ground and isomeric states and
because of the short half-life of the isomer.
2. Some mass measurements might be wrong. This explanation is
contradictory to the fact that the mass values in question stem
from different sources and mass spectrometric techniques
(ISOLTRAP, ESR, values, etc.). Furthermore, the odd-even
staggering is not an isolated phenomenon but appears also (less
pronounced) in the neighboring isotopic chain of mercury. This is
not easily explicable since the mercury and the thallium isotopes
are not interconnected by values.
3. The odd-even staggering of the two-proton separation energies
in the thallium isotopic chain is factual and represents a nuclear
structure effect. This would imply a stronger pairing effect for
neutron numbers around mid-shell () than for nearly
double-magic thallium nuclei with and .
Similar to the drastic odd-even staggering observed in the charge
radii of the mercury isotopes (caused by shape transitions)
[58] these phenomena depend very critically on the
neutron and proton configurations and very elaborated calculations
are required to reproduce these effects.
![[Uncaptioned image]](/html/0801.2068/assets/x17.png)
Figure 15: Two-proton separation energies as a function of neutron number.
8.2 Correlation between pairing energies and nuclear charge radii
Nuclear masses, as determined in this work, and nuclear charge
radii, as obtained by optical spectroscopy from isotope shift
measurements, illustrate global and collective properties of
nuclear matter. The mass is a measure of the binding energy and
the charge radii reflect static and dynamic deformations. The
nuclear system, as a function of protons and neutrons, maximizes
the binding energy according to the nuclear shape. The pairing
energy, which is about , plays an important role in
this context and becomes visible as odd-even effect in the masses
as well as in the charge radii.
Due to the complex interplay of single-particle and collective
degrees of freedom, one observes in the region of the nuclear
chart investigated in this work both a spherical and deformed
shape in the same nucleus at low excitation energies. This
phenomenon, first observed at ISOLDE/CERN in the seventies by
optical spectroscopy [5, 59] is known as ”shape
coexistence or shape isomerism” and nowadays an extensive bulk of
data has been collected throughout the chart of nuclei
[8, 10, 57, 58]. Shape coexistence is
visible in the vicinities of the shell closures
[8, 10, 58]. Most clearly it is observed in
the slope of charge radii in the mercury isotopic chain: It
manifests itself in a huge odd-even shape staggering near the mid-shell region [58] and a large difference in
charge radii and therefore nuclear deformation between the ground
and isomeric state in [6] (Fig.
18). Since the nuclear states of very different
configuration are (almost) degenerate in energy, one cannot expect
to observe any major trend in the slope of the masses or binding
energies as a function of neutron number. In fact, only now the
high mass resolving power of up to
of the Penning trap mass spectrometer ISOLTRAP enables one
to resolve ground and isomeric states in this region of the
nuclear chart where shape coexistence occurs. The implementation
of many new accurate mass data from ISOLTRAP
([12, 13, 56] and this work) to the data base
of the Atomic Mass Evaluation and a large data set of charge radii
[4, 60] stimulated an attempt to reveil a
correlation between masses and charge radii [61].
In order to uncover finer details in the binding energies
regarding odd-even staggering and general trends
[62, 63], the absolute values of the deduced
pairing gap parameters for
neutrons are plotted instead of the experimental masses.
The three-point indicator for the shell gap parameter is
given by
| (8) |
which is often interpreted as a measure of the empirical pairing gap [62]. Another commonly used relation is the four-point indicator, which averages the values and is given by
| (9) |
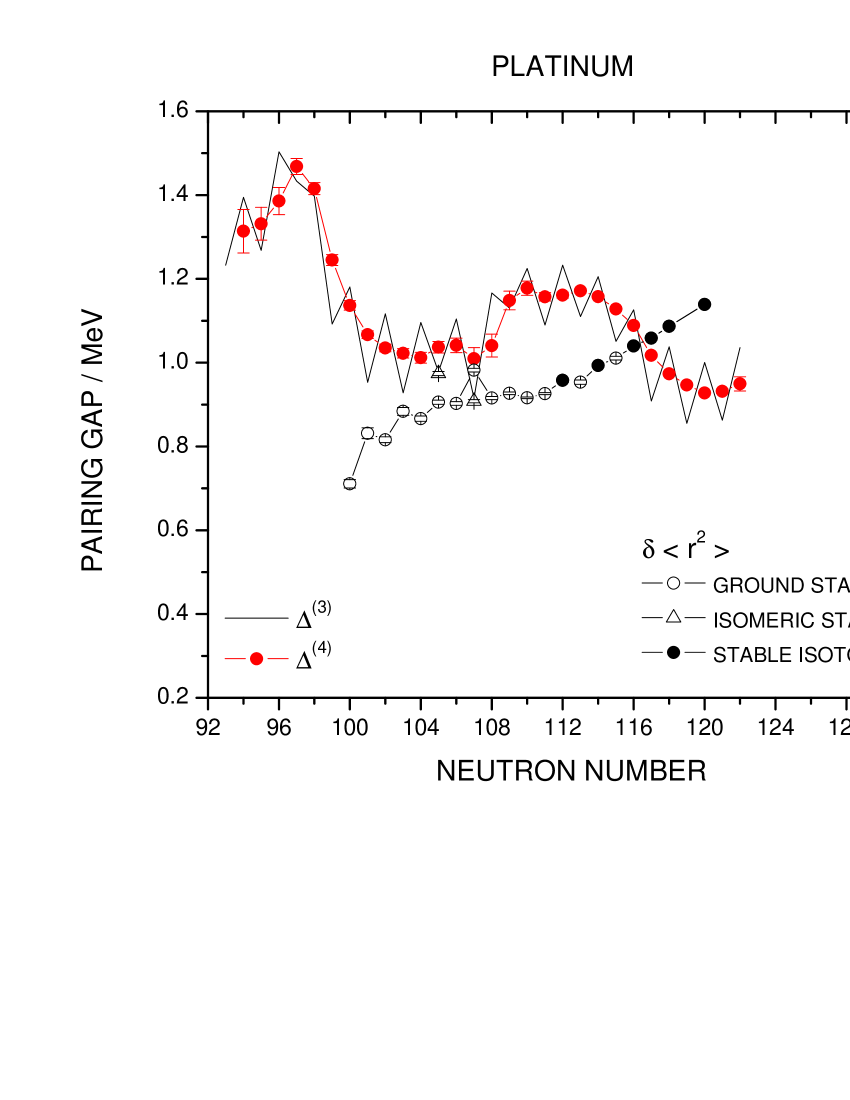
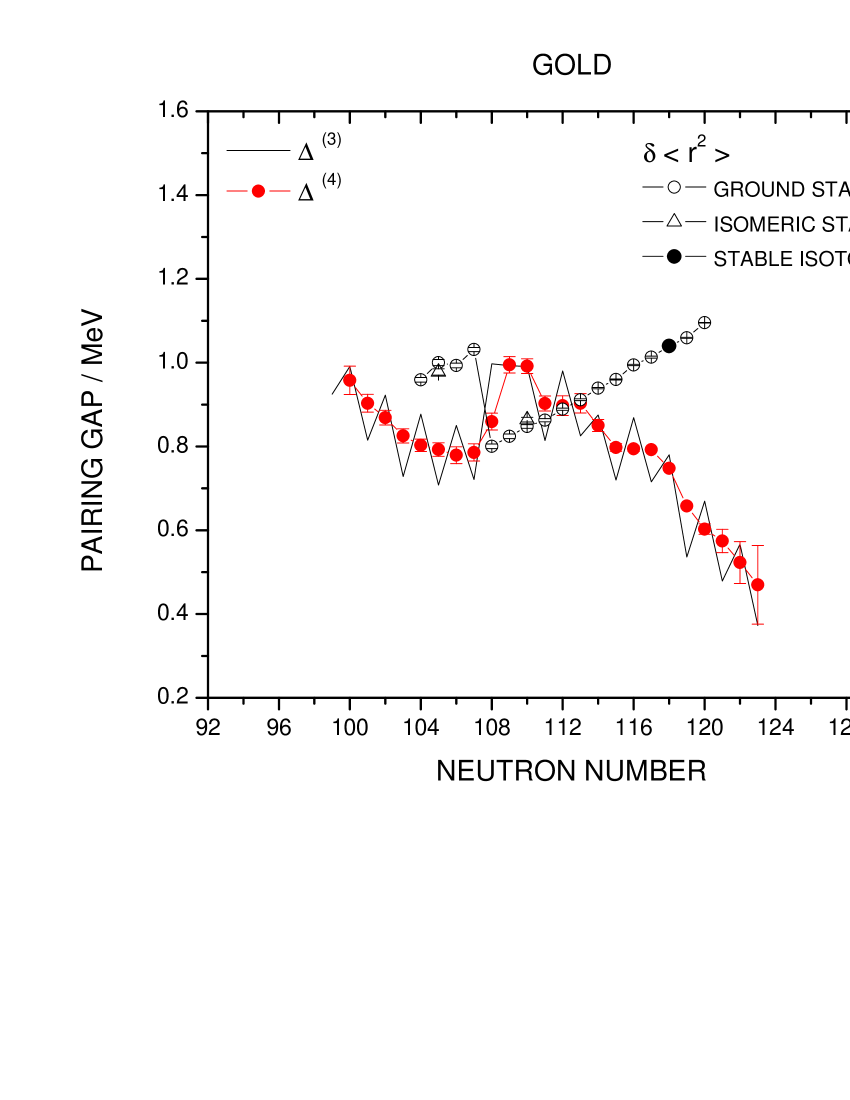
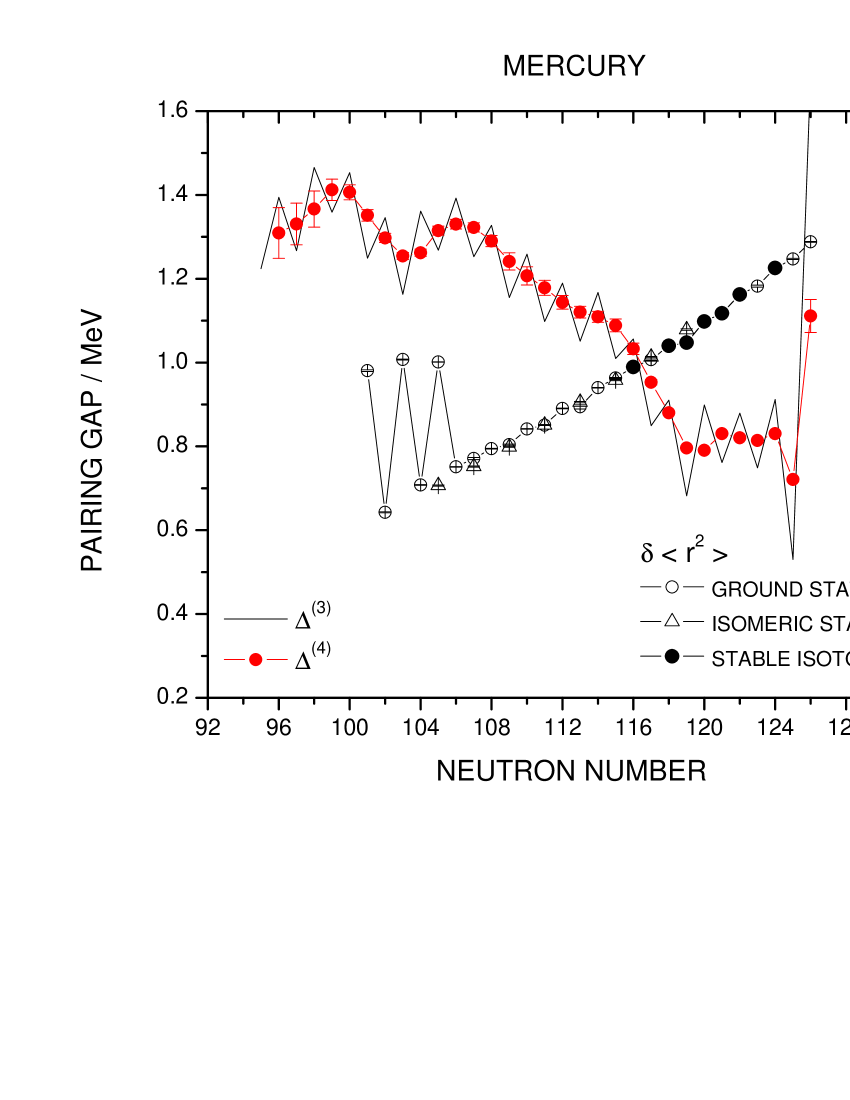
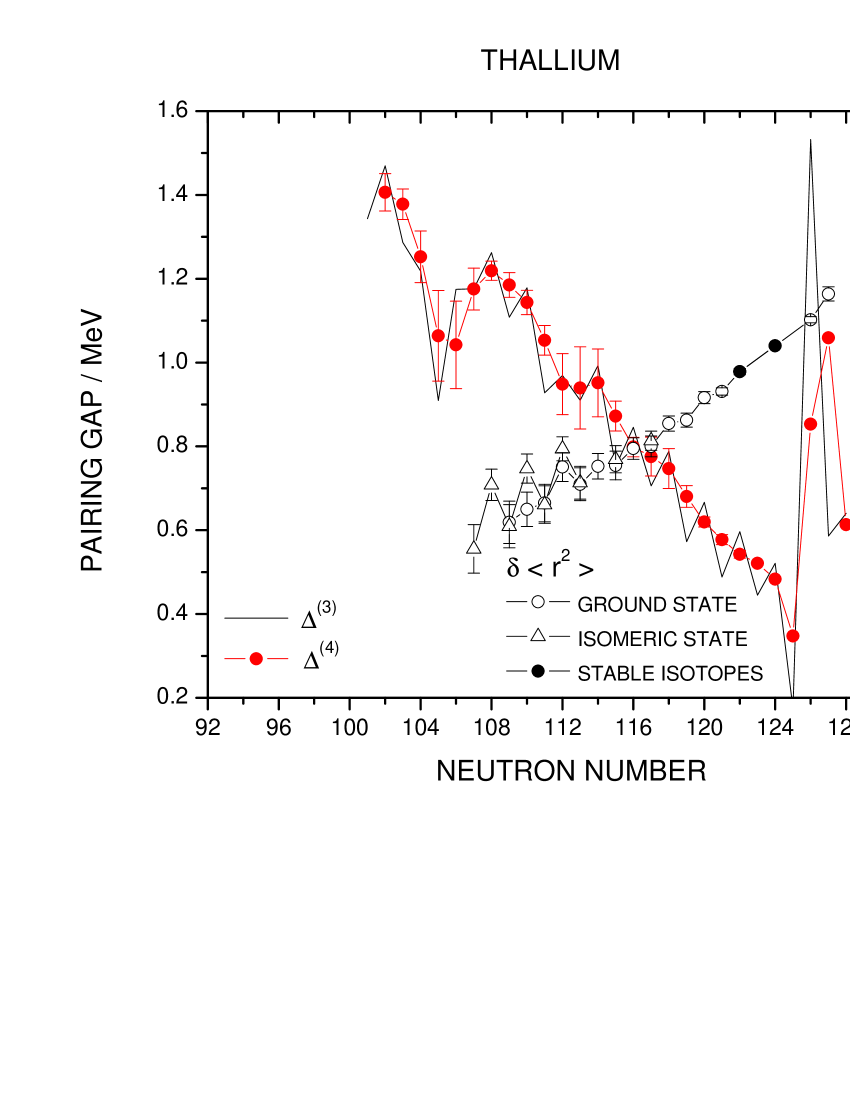
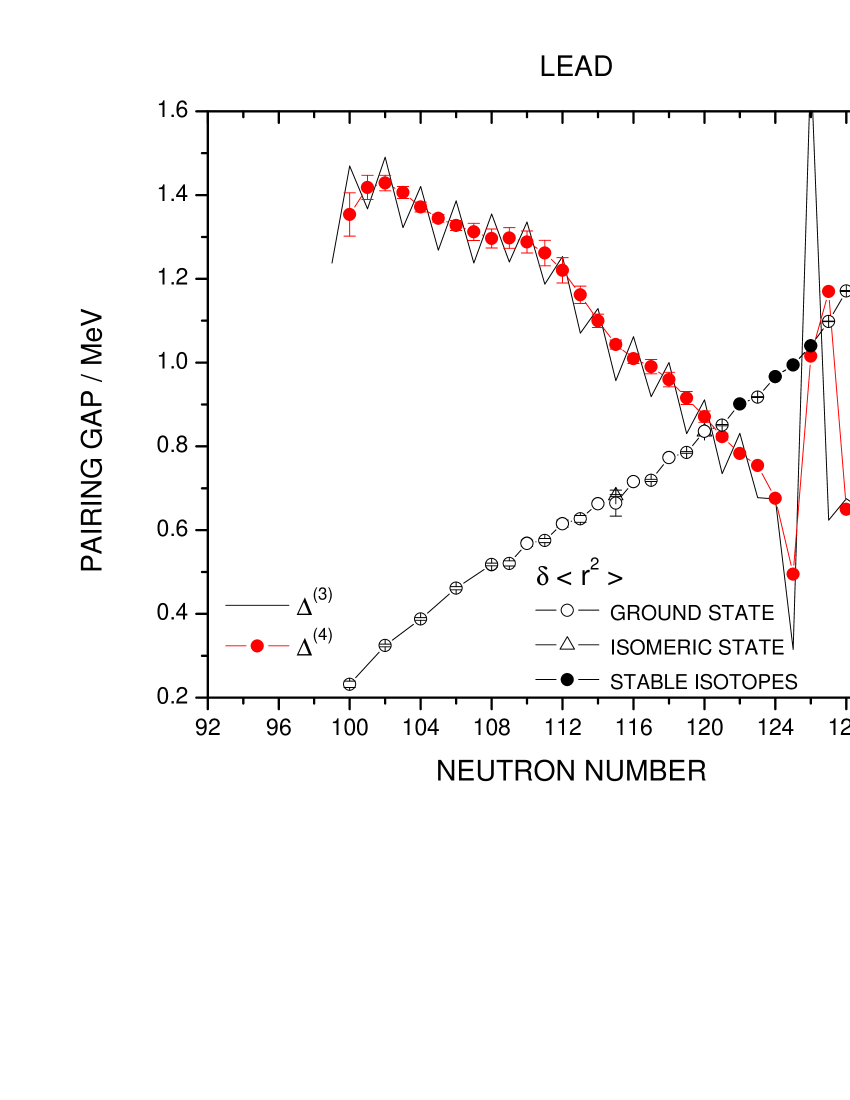
Figures 16 - 20 compare the results from
mass measurements with those from isotope shift determinations for
the isotopic chains of platinum, gold, mercury, thallium, and
lead. For these elements, extensive data are available. In order
to allow an easy comparison of pairing gap parameters with charge
radii for the different elements, the scales of the x- and y-axis
are made identical in Figs. 16 - 20. The
pairing gap parameters of the isotopic chains of the even-
elements lead, mercury and platinum are nearly identical in the
regions of and , respectively. The pairing
gap parameters for the isotopes of the odd- elements thallium
and gold show a similar behavior but the pairing gap is smaller in
magnitude. Around mid-shell neutron number a minimum
develops which is barely visible in the case of lead. It becomes
sharper and is shifted to for thallium, distinct and
narrow for mercury
but very much pronounced and broader for gold and platinum.
The slopes of the isotopic chains of lead, thallium and mercury
are almost identical in the region where data are available for
the same neutron number. Only the odd-even staggering is much more
pronounced for the thallium isotopes as compared to those of lead
and mercury.
Down to neutron number , the slope of the charge radii
for the isotopes of gold and platinum is a little bit smaller than
for the other isotopic chains which indicates increasing
deformation. For in the case of mercury and
for gold a sudden change of the charge radii is observed
which is due to a sharp change in deformation.
Comparing the slopes of pairing parameters with those of the
charge radii, one observes that the extremely sharp discontinuity
at the shell closure at is visible in the charge radii
only as a small kink in their slope, that the pronounced increase
of deformation at mid-shell is reflected as a local
minimum in the pairing parameters, and that the size of the
odd-even staggering in the pairing parameter is not
reflected in the size of the one of the charge radii. There is an
interesting observation: For thallium an unusual odd-even
staggering between the isomers below mass number is
observed.
The new data obtained in this region of the nuclear chart near will hopefully stimulate theoretical work to develop nuclear
models further which are able to describe simultaneously
experimental mean square charge radii as well as experimental
masses of spherical and deformed nuclei in a satisfactory way. Up
to now, only little attention has been paid to such investigations
which concern model-independent gross properties of nuclear
matter. For example, the charge radii are only poorly described by
macroscopic-microscopic mass models which are, however, quite
successful in describing nuclear masses [64]. Even more
demanding is a description of the odd-even staggering of masses
and of the charge radii as attempted in Ref. [65] for
spherical nuclei.
9 Summary and Outlook
The fine structure of the mass surface is important for the
elucidation of the dramatic shape changes that appear so suddenly
in this region of the nuclear chart. For most of the nuclides that
were investigated in this work a clear mass-to-state assignment
was possible. Few exceptions due to an insufficient resolving
power during the measurement are the nuclides ,
, , and .
Spectroscopic data giving production ratios could assist these
identifications using Eq. (5). The excitation energies
of bismuth isotopes (odd-odd nuclei) suffer from particulary high
uncertainties. Hence, these cases should be addressed in a future
mass measurement requiring the following conditions: (i) If the
half-lives of the states are sufficiently long in order to allow
an extremely high-resolution measurement: A mass resolution of,
for example, can be obtained with an excitation
time of . In these cases the count-rate-class
analysis can give a meaningful interpretation, i.e. a
possible contamination is detected. (ii) Similar to the
measurements of both states of [66],
a narrow-band laser ionization with a bandwidth of
can be used to selectively ionize one of the
states. As a prerequisite, the element of interest has to be
accessible for laser ionization and the hyperfine structure
splitting of the isomeric components with different nuclear spin
has to be known. (iii) In cases where the half-life is not
sufficiently long to perform a measurement with extended
excitation time, the mass determination should be supported by
nuclear spectroscopy in order
to enable a clear identification of states.
Acknowledgements
We gratefully acknowledge the ISOLDE technical group and the RILIS group for assistance during the experiments. This work was supported by the German Ministry for Education and Research (BMBF contracts 06MZ962I, 06MZ21S, and 06LM968), by the European Commission (contracts HPRI-CT-1998-00018 (LSF) and HPRI-CT-2001-50034 (NIPNET)), and by the Association of Helm- holtz Research Centers (contract VH-NG-037).
References
- [1] D. Lunney, J.M. Pearson, and C. Thibault, Rev. Mod. Phys. 75 (2003) 1021.
- [2] K. Blaum, Phys. Rep. 425 (2006) 1.
- [3] E.W. Otten, Treatise on Heavy Ion Physics 8 (1989) 517, and references therein.
- [4] H.-J. Kluge and W. Nörtershäuser, Spectrochim. Acta B 58 (2003) 1031, and references therein.
- [5] J. Bonn et al., Phys. Lett. B 38 (1972) 308.
- [6] P. Dabkiewicz et al., Phys. Lett. B 82 (1979) 199.
- [7] S. Frauendorf and V.V. Pashkevich, Phys. Lett. 55B (1975) 365.
- [8] J.L. Wood et al., Phys. Rep. 215 (1992) 101.
- [9] A.N. Andreyev et al., Nature 405 (2000) 430.
- [10] K. Heyde et al., Phys. Rep. 102 (1983) 291.
- [11] K. Heyde, Nucl. Phys. A. 507 (1990) 149c.
- [12] S. Schwarz, Ph.D. thesis, University of Mainz (1998), ISBN 3-8288-0735-6.
- [13] S. Schwarz et al., Nucl. Phys. A 693 (2001) 533.
- [14] R. Fossion et al., Nucl. Phys. A 697 (2002) 703.
- [15] E. Coenen et al., Phys. Rev. Lett. 54 (1985) 1783.
- [16] P. Van Duppen et al., Nucl. Phys. A 529 (1991) 268.
- [17] G. Bollen et al., J. Mod. Opt. 39 (1992) 257.
- [18] F. Herfurth et al., Eur. Phys. J. A 25 (2005) 17.
- [19] T. Radon et al., Nucl. Phys. A 677 (2000) 75.
- [20] Yu.A. Litvinov, Ph.D. thesis, University of Giessen (2003).
- [21] Yu.A. Litvinov et al., Nucl. Phys. A 756 (2005) 3.
- [22] M. Epherre et al., Phys. Rev. C 19 (1979) 1504.
- [23] G. Audi et al., Nucl. Phys. A 378 (1982) 443.
- [24] Z. Patyk et al., Nucl. Phys. A 491 (1989) 267.
- [25] G. Bollen et al., Nucl. Instr. Meth. A 368 (1996) 675.
- [26] F. Herfurth et al., Nucl. Instr. Meth. A 469 (2001) 254.
- [27] M. Mukherjee et al., submitted to Eur. Phys. J. A.
- [28] E. Kugler, Hyp. Int. 129 (2000) 23.
- [29] V.I. Mishin et al., Nucl. Instr. Meth. B 73 (1993) 550.
- [30] U. Köster et al., Spectrochim. Acta 58 (2003) 1047.
- [31] H. Raimbault-Hartmann et al., Nucl. Instr. Meth. B 126 (1997) 378.
- [32] G. Savard et al., Phys. Lett. A 158 (1991) 247.
- [33] G. Gräff, H. Kalinowski, and J. Traut, Z. Phys. A 297 (1980) 35.
- [34] M. König et al., Int. J. Mass. Spectrom. Ion Process. 142 (1995) 95.
- [35] G. Bollen, Nucl. Phys. A 693 (2001) 3.
- [36] G. Sikler et al., Nucl. Phys. A 763 (2005) 45.
- [37] A. Kellerbauer et al., Eur. Phys. J. D 22 (2003) 53.
- [38] K. Blaum et al., J. Phys. B 36 (2003) 921.
- [39] S. George et al., Phys. Rev. Lett. 98 (2007) 162501.
- [40] C. Yazidjian et al., Phys. Rev. C 76 (2007) 024308.
- [41] C. Guénaut et al., Phys. Rev. C 75 (2007) 044303.
- [42] P. Delahaye et al., Phys. Rev. C 74 (2006) 034331.
- [43] K. Blaum et al., Eur. Phys. J. A 15 (2002) 245.
- [44] M. König, Diploma thesis, University of Mainz (1991).
- [45] G. Bollen et al., Phys. Rev. C 46 (1992) R2140.
- [46] D. Beck et al., Nucl. Instr. Meth. B 126 (1997) 374.
- [47] G. Audi et al., Nucl. Phys. A 624 (1997) 1.
- [48] G. Audi, compilation of an intermediate atomic mass evaluation in 2002. This evaluation did not contain the ISOLTRAP data presented in this work but all other mass data published up to this date. IAME is used for comparison with our mass values, since those are already included in the AME 2003 [52].
- [49] M.P. Bradley et al., Phys. Rev. Lett. 83 (1999) 4510.
- [50] G. Audi and A.H. Wapstra, Nucl. Phys. A 595 (1995) 409.
- [51] G. Audi and A.H. Wapstra, Nucl. Phys. A 565 (1993) 1.
- [52] G. Audi, A.H. Wapstra, and C. Thibault, Nucl. Phys. A 729 (2003) 337.
- [53] G. Audi, Hyp. Int. 132 (2001) 7.
- [54] A.H. Wapstra, G. Audi and C. Thibault, Nucl. Phys. A 729 (2003) 129.
- [55] D. Beck et al., Eur. Phys. J. A 8 (2000) 307.
- [56] A. Kohl, Ph.D. thesis, University of Heidelberg (1999).
- [57] R. Julin et al., J. Phys. G 27 (2001) R109.
- [58] G. Ulm et al., Z. Phys. A 325 (1986) 247.
- [59] J. Bonn et al., Phys. Lett. B 36 (1971) 41.
- [60] H. De Witte et al., Phys. Rev. Lett. 98 (2007) 112502.
- [61] C. Weber et al., Eur. Phys. J. A 25 Supplem. 1 (2005) 201.
- [62] W. Satula et al., Phys. Rev. Lett. 81 (1998) 3599.
- [63] J. Dobaczewski et al., Phys. Rev. 63 (2001) 024308.
- [64] F. Buchinger et al., Phys. Rev. C 72 (2005) 057305.
- [65] S.A. Fayans and D. Zawischa, Int. J. Modern Phys. B 15 (2001) 1684.
- [66] C. Weber et al., Phys. Lett. A 347 (2005) 81.