11email: beuther@mpia.de 22institutetext: Centre for Astronomy, James Cook University, Townsville, QLD 4811 Australia
22email: Andrew.Walsh@jcu.edu.au 33institutetext: Max-Planck-Institute for Radioastronomy, Auf dem Hügel 69, 53121 Bonn, Germany
33email: sthorwirth@mpifr-bonn.mpg.de, kmenten@mpifr-bonn.mpg.de 44institutetext: Harvard-Smithsonian Center for Astrophysics, 60 Garden Street, Cambridge, MA 02138, USA
44email: qzhang@cfa.harvard.edu 55institutetext: NRAO, 520 Edgemont Rd, Charlottesville, VA 22903
55email: thunter@nrao.edu 66institutetext: Ritter Observatory, Department of Physics and Astronomy, University of Toledo, Toledo, OH 43606-3390, USA
66email: megeath@astro1.panet.utoledo.edu
ATCA 3 mm observations of NGC6334I and I(N): dense cores, outflows and an UCHii region
Abstract
Aims. Investigation of the dense gas, the outflows and the continuum emission from the massive twin cores NGC6334I and I(N) at high spatial resolution.
Methods. We imaged the region with the Australia Telescope Compact Array (ATCA) at 3.4 mm wavelength in continuum as well as CH3CN and HCN(1–0) spectral line emission.
Results. While the continuum emission in NGC6334I mainly traces the UCHii region, toward NGC6334I(N) we detect line emission from four of the previously identified dust continuum condensations that are of protostellar or pre-stellar nature. The CH3CN lines are detected in all -components up to energies of 128 K above ground toward two protostellar condensations in both regions. We find line-width increasing with increasing for all sources, which indicates a higher degree of internal motions of the hotter gas probed by these high K-transitions. Toward the main mm and CH3CN source in NGC6334I we identify a velocity gradient approximately perpendicular to the large-scale molecular outflow. This may be interpreted as a signature of an accretion disk, although other scenarios, e.g., an unresolved double source, could produce a similar signature as well. No comparable signature is found toward any of the other sources. HCN does not trace the dense gas well in this region but it is dominated by the molecular outflows. While the outflow in NGC6334I exhibits a normal Hubble-law like velocity structure, the data are consistent with a precessing outflow close to the plane of the sky for NGC6334I(N). Furthermore, we observe a wide (15.4 km s-1) HCN absorption line, much broader than the previously observed CH3OH and NH3 absorption lines. Several explanations for the difference are discussed.
Key Words.:
techniques: interferometric — stars: early type — stars: formation — ISM: individual (NGC6334I & I(N)) — line: profiles1 Introduction
The massive twin cores NGC6334I and I(N) at a distance of 1.7 kpc in the southern hemisphere (Neckel 1978; Straw & Hyland 1989) have been subjected to investigations for more than two decades. The two regions are located at the north-eastern end of the much larger molecular cloud/Hii region complex NGC6334 (e.g., Rodríguez et al. 1982; Gezari 1982; de Pree et al. 1995; Kraemer & Jackson 1999; Sandell 2000; Carral et al. 2002). The reason why NGC6334I (synonymous with NGC6334F) and NGC6334I(N) are so interesting from a comparison point of view is that they are only separated by approximately 1 parsec, hence they share a similar large-scale molecular environment, but they exhibit extremely different characteristics likely because they are at different evolutionary stages.
Both regions have been studied in much detail over the last decades; recent summaries of the past observations can be found, e.g., in Hunter et al. (2006), Beuther et al. (2007b) or Rodríguez et al. (2007). Here we just outline their main characteristics. NGC6334I is a prototypical hot molecular core right at the head of a cometary ultracompact Hii (UCHii) region (de Pree et al. 1995; Kraemer & Jackson 1995). It exhibits rich spectral line emission (McCutcheon et al. 2000; Thorwirth et al. 2003; Schilke et al. 2006), a bipolar outflow (Bachiller & Cernicharo 1990; Leurini et al. 2006) and H2O, OH, CH3OH class ii and NH3(3,3)/(6,6)/(8,6)/(11,9) maser emission (Moran & Rodríguez 1980; Forster & Caswell 1989; Gaume & Mutel 1987; Brooks & Whiteoak 2001; Norris et al. 1993; Caswell 1997; Walsh et al. 1998; Beuther et al. 2007b; Walsh et al. 2007). In contrast to that, up to very recently NGC6334I(N) was considered a typical cold core since no mid-infrared and only faint near-infrared emission was detected (Gezari 1982; Tapia et al. 1996; Persi et al. 2005). Furthermore, weak cm continuum and class i and ii CH3OH maser emission was reported (Carral et al. 2002; Kogan & Slysh 1998; Caswell 1997; Walsh et al. 1998). The spectral line forest is considerably less dense compared to NGC6334I (Thorwirth et al. 2003), however, a few species are stronger toward NGC6334I(N) (Sollins & Megeath 2004, Walsh et al. in prep.). In addition, Megeath & Tieftrunk (1999) report the detection of a molecular outflow in this region as well. In summary, both regions show signs of active star formation, however, the southern region NGC6334I appears to be in a more advanced evolutionary stage than the northern region NGC6334I(N).
To better characterize this intriguing pair of massive star-forming regions, we started a concerted campaign from cm to mm wavelengths with the Australia Telescope Compact Array (ATCA), the Submillimeter Array (SMA) and the Mopra single-dish telescope. The previous ATCA NH3(1,1) to (6,6) line observations revealed compact warm gas emission from both regions (Beuther et al. 2005, 2007b), and temperatures estimated to exceed 100 K. While toward NGC6334I(N) the low energy NH3 lines showed only extended emission, the high energy lines finally revealed compact gas components. The NH3(6,6) line profile from NGC6334I(N) allowed speculation about a potential accretion disk. CH3OH was strong in absorption toward the southern UCHii region in NGC6334I, indicative of expanding gas. In the mm continuum emission, Hunter et al. (2006) used the SMA to resolve several mm continuum sources toward both regions (4 in NGC6334I and 7 in NGC6334I(N)). Furthermore, Hunter et al. (in prep.) identified an additional SiO outflow in NGC6334I(N) that has its orientation in north-east south-west direction, approximately perpendicular to the one previously reported by Megeath & Tieftrunk (1999).
Here we present 3.4 mm continuum and HCN/CH3CN spectral line observations obtained with the new 3 mm facility at the ATCA. These observations shed light on the outflow and dense gas properties of both regions as well as on the continuum emission from the embedded protostellar objects and the UCHii region.
2 Observations
| Line | Freq. | ||
|---|---|---|---|
| [GHz] | [K] | [cm-3] | |
| HCN(1–0), F=1-1 | 88.630 | 4 | 32 |
| HCN(1–0), F=2-1 | 88.632 | 4 | 32 |
| HCN(1–0), F=0-1 | 88.634 | 4 | 32 |
| CH3CN | 91.959 | 128 | 7 |
| CH3CN | 91.971 | 78 | 7 |
| CH3CN | 91.980 | 42 | 7 |
| CH3CN | 91.985 | 20 | 6 |
| CH3CN | 91.987 | 13 | 6 |
For all observed lines the columns list (left to right) the species/quantum numbers, frequencies, upper level energy states ( is the Boltzmann constant) and critical densities .
a The critical densities are calculated at 60 K (Einstein coefficient and collisional rate ). For HCN, and are taken from LAMBDA (Schöier et al. 2005). For CH3CN, is calculated from ( in units of
100 m and debye), and the corresponding -values are from Pei & Zeng (1995b, a). For a line optical depth , has to be multiplied by (Tielens 2005).
The two regions NGC6334I & I(N) were observed in May 2006 during two nights with the ATCA in the H214 configuration that results in projected baselines between 14 and 73 k at 88 GHz. The weather conditions at Narrabri were excellent with approximate precipitable water vapor of 10 mm and measured system temperatures between 150 and 670 K. The phase reference centers were R.A. (J2000) , Decl. (J2000) for NGC6334I and R.A. (J2000) , Decl. (J2000) for NGC6334I(N). The velocities relative to the local standard of rest () for NGC6334I and NGC6334I(N) are and km s-1, respectively. We observed the 3.4 mm continuum emission at 88.4 GHz with a bandwidth and spectral resolution of 128 and 1 MHz, respectively. The spectral range for the continuum was checked to be line-free based on previous MOPRA single-dish observations of that region (Walsh et al., in prep.). During one night, simultaneously with the continuum emission, we observed the HCN(1–0) line at 88.632 GHz. In the second night, the CH3CN transitions at 91.98 GHz were targeted averaging two polarizations to achieve better signal-to-noise ratio. For more details on the spectral lines, see Table 1. A good uv-coverage was obtained through regular switching between both sources and the gain calibrators 1742-289 and 1759-39. The channel separation of the HCN observations was 0.25 MHz (0.85 km s-1) and slightly worse with 0.5 MHz (1.63 km s-1) for CH3CN because we had to cover a broader bandwidth due to the several -components. Flux calibration was performed with observations of Uranus and is estimated to be accurate within 20%. The primary beam of the ATCA at the observing frequency is (FWHM). The data were reduced with the MIRIAD package. Applying different weightings for the line and continuum data – mostly uniform weighting for the compact continuum and CH3CN emission and natural for the more extended HCN emission – the synthesized beams vary between the different maps. The achieved spatial resolution and rms values are given in Table 2.
| Line | rms | |
|---|---|---|
| [′′] | [] | |
| NGC6334I | ||
| 3.4mm cont. | 23 | |
| CH3CN, [-12,2]km/sa | 7 | |
| CH3CN, 1.7km/sb | 11 | |
| HCN(1–0), [-25,-19]km/sa | 19 | |
| HCN(1–0), [5,19]km/sa | 16 | |
| HCN(1–0), 1.7km/sb | 33 | |
| NGC6334I(N) | ||
| 3.4mm cont. | 2.6 | |
| CH3CNa, [-12,8]km/s | 4.9 | |
| CH3CN, 1.7km/sb | 8.4 | |
| HCN(1–0), [-16,-6]km/sa | 19 | |
| HCN(1–0), [4,12]km/sa | 15 | |
| HCN(1–0), 2.0km/sb | 26 |
a Integrated velocity regime.
b Channel maps with the given velocity resolution.
3 Results and Discussion
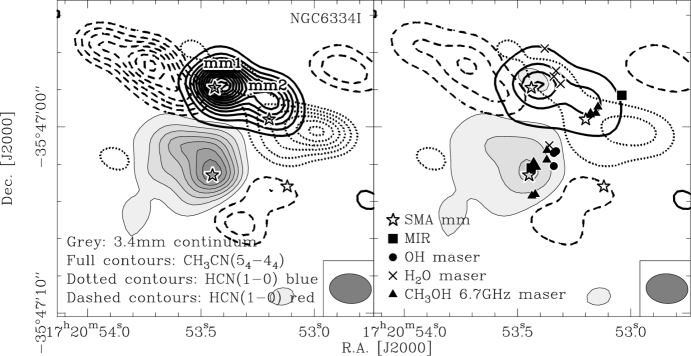
All of the targetted spectral lines with excitation levels above ground, , between 4 and 128 K (Table 1) and the 3.4 mm continuum emission were detected and mapped toward both target regions (Figs. 1 & 2). While CH3CN is a typical hot core molecule and only detected toward the central warm protostars, HCN exhibits significantly more extended emission and shows a strong association with the various molecular outflows in the two regions. This may be considered surprising since the critical density of HCN(1–0) is even larger than that of CH3CN. The 3.4 mm continuum emission is of different origin in both regions: while it is largely due to the free-free emission from the UCHii region in NGC6334I, toward the northern region NGC6334I(N) the continuum emission stems mainly from the dust in the vicinity of the embedded protostars. In the following we will outline the characteristics of both regions separately.
3.1 NGC6334I
3.1.1 3.4 mm continuum emission
Figure 1 presents an overlay outlining the main features of the spectral line and continuum emission toward NGC6334I. Almost all of the 3.4 mm continuum emission arises from the UCHii region with a comparable morphology to the previous cm continuum images of that region (e.g., de Pree et al. 1995; Beuther et al. 2005). In contrast to that, it is only barely detectable at a level of 87 mJy beam-1 toward the strongest 1.4 mm continuum, NH3 and CH3CN peak position, mm1 in Fig. 1 (Hunter et al. 2006; Beuther et al. 2007b), marking the location of the dominating protostar in the region. Comparing this detection with the 1.4 mm data-point from Hunter et al. (2006) of 2.09 Jy beam-1 (the 1.4 mm data were re-imaged with the same beam-size as the 3.4 mm data), we get a spectral index of 3.4. However, since our detection is barely above the level, and mm1 may well harbor a so far undetected hypercompact Hii region that could contribute still significant flux at 3.4 mm (e.g., Beuther et al. 2007a), we refrain from further analysis of that feature.
3.1.2 The dense gas observed in CH3CN
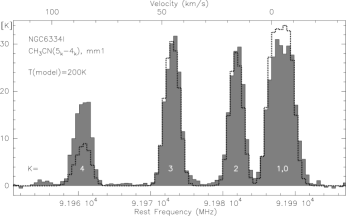
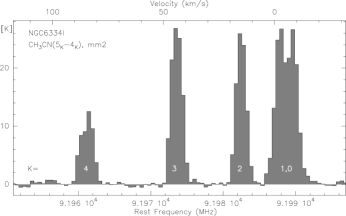
In contrast to the 3.4 mm continuum emission, the CH3CN emission distribution shows the typical double-peaked morphology known from the previous NH3 observations (Beuther et al. 2005, 2007b). The two CH3CN peaks appear to be associated with the two strongest mm continuum sources (mm1 and mm2) in the region (Hunter et al. 2006). Figure 3 presents the full CH3CN spectra extracted toward the two peak positions, and clearly all five -components up to with K are well detected. Table 3 lists the fitted line parameters of the spectra.
| Line | ||
|---|---|---|
| [K] | [km/s] | |
| NGC6334I, mm1 | ||
| CH3CN | 24.1 | 7.0 |
| CH3CN | 27.8 | 8.3 |
| CH3CN | 29.9 | 7.5 |
| CH3CN | 31.9 | 7.8 |
| CH3CN | 18.7 | 8.5 |
| NGC6334I, mm2 | ||
| CH3CN | 25.6 | 5.1 |
| CH3CN | 26.9 | 5.3 |
| CH3CN | 27.3 | 5.3 |
| CH3CN | 28.8 | 5.8 |
| CH3CN | 11.9 | 6.9 |
| NGC6334I(N), mm1 | ||
| CH3CN | 7.4 | 8.3 |
| CH3CN | 6.9 | 8.4 |
| CH3CN | 8.7 | 7.6 |
| CH3CN | 8.9 | 7.7 |
| CH3CN | 4.4 | 10.0 |
| NGC6334I(N), mm2 | ||
| CH3CN | 5.6 | 6.6 |
| CH3CN | 5.7 | 3.9 |
| CH3CN | 4.6 | 6.5 |
| CH3CN | 4.5 | 6.0 |
| CH3CN | 1.0 | 10.9 |
a The fits to the lines are less accurate because of the strong line blending of both components.
b Full Width Half Maximum (FWHM)
Since the early work by Loren & Mundy (1984) CH3CN has often been used as a thermometer to estimate rotation temperatures of the dense gas via Boltzmann plots assuming optically thin emission in Local Thermodynamic Equilibrium (LTE). We tried this approach here as well, however, it failed because CH3CN is optically thick. Similarly, we tried to model the CH3CN spectra in LTE using the XCLASS superset to the CLASS software developed by Peter Schilke (priv. comm., see also Comito et al. 2005). This software package uses the line catalogs from JPL and CDMS (Poynter & Pickett 1985; Müller et al. 2001). However, this approach failed as well. Fig. 3 shows a model spectrum at K overlaid on the CH3CN toward the main mm peak mm1. While the components still fit relatively well, the model does neither reproduce the nor the component. While this is partly again an opacity effect, it also shows that LTE is not appropriate for a source like NGC6334I. As outlined below, different -levels exhibit different line-widths and hence do not trace the same gas components. Temperature gradients within the sources are imprinted in the spectra further complicating single-temperature fits. More sophisticated modeling of the CH3CN emission is warranted. Although a few radiative transfer calculations of CH3CN data exist (e.g., Olmi et al. 1993), the sparsely available collisional transition rates make such calculations a difficult task (the only partly available data are a small compilation by Pei & Zeng 1995b, a). Furthermore, in such hot and dense regions radiative excitation starts to matter which is hard to account for in any modeling approach.
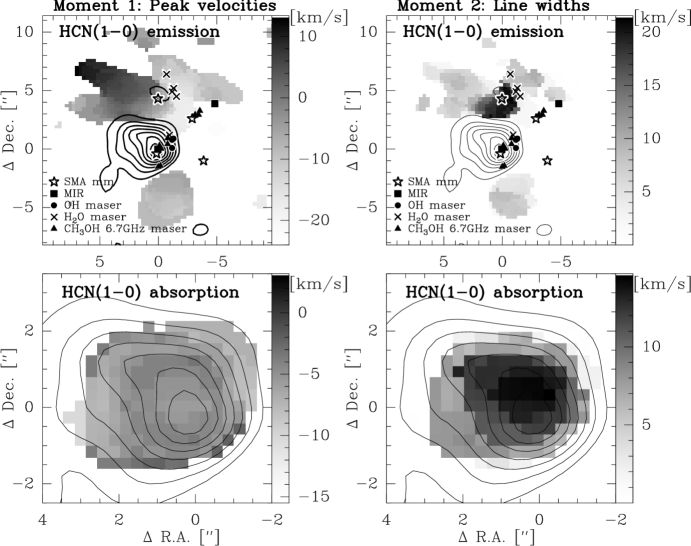
While the Full Width Half Maximum (FWHM) line-widths for the two lowest energy lines of the components are less certain because of the line-blending between both components, one identifies a trend of increasing line-width, , with increasing quantum number for (Table 3). Figure 4 shows the of CH3CN for toward the two CH3CN peaks in NGC6334I & I(N) plotted versus the level energy above ground, . For all four positions the trend of increasing versus is discernable. This trend indicates more internal motions from the warmer gas components (traced by the higher lines) which perhaps originate from the inner warm regions close to the protostars. Similar to that, the bottom-panel of Figure 5 shows the 2nd moment map of the CH3CN line, i.e., its line-width distribution. Again we see the line-width increase toward the center close to the main mm continuum peaks. Different processes may cause such line broadening, e.g., accretion disk rotation, infall or outflow motions. In particular, accretion disks are interesting candidates to explain such observational features.

To investigate rotation from a potentially embedded massive accretion disk, the top-panel of Figure 5 presents the 1st moment map of the CH3CN line, i.e., its peak velocity distribution. Although this structure is only barely resolved by the synthesized beam of we tentatively identify a velocity gradient across mm1 with an approximate position angle (PA) of degrees from north. The same velocity structure is descernable in the lower CH3CN transitions (we refrained from analyzing the lines because of their line-blending). To investigate this potential velocity gradient in more detail, we fitted the peak positions of each independent spectral channel (Fig. 6) which should allow us to increase the resolving power to approximately 0.5 HPBW/(S/N), where HPBW equals the synthesized beam and S/N the signal-to-noise ratio (Reid et al. 1988). Similar to the moment map, the case is not clear-cut, but nevertheless, the data are indicative of a velocity gradient with a PA of degrees from north. In comparison to these position angles, the PA of the previously identified molecular outflow is degrees from north (Bachiller & Cernicharo 1990), which is approximately perpendicular to that found from our measurements, especially those from the highest-spatial-resolution position fitting (Fig. 6).
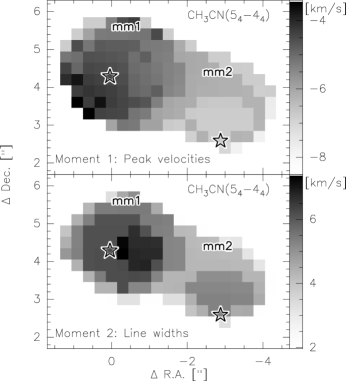

Based on these findings, we went back to the previous NH3(1,1) to (6,6) observations (Beuther et al. 2005, 2007b) searching for similar signatures in these data. While the main hyperfine lines as well as the satellite lines of NH3(1,1) are dominated by the large-scale velocity gradient over the two main cores (e.g., Fig. 13 in Beuther et al. 2005), the satellite lines of the (J,K) lines with J,K3 are overlapping and difficult to image. However, the satellite hyperfine lines of the NH3(2,2) transition exhibit, in addition to the velocity gradient over the two cores, a second velocity gradient across mm1, again approximately perpendicular to the large-scale outflow (Fig. 7). The confirmation of this velocity gradient, first identified in the CH3CN line, now in the lower opacity satellite hyperfine NH3(2,2) line supports its general credibility.
Since we do not resolve well the substructure of that velocity gradient to better investigate the kinematics (e.g., is there any Keplerian motion present?) the data do not allow the claim that a massive accretion disk was detected. For example, an unresolved double-source with different line-of-sight velocities could produce a similar signature (e.g., Brogan et al. 2007). Nevertheless, these observations are suggestive of a rotating structure perpendicular to the molecular outflow within a projected diameter of derived from Fig. 6. At the given distance of 1.7 kpc, this corresponds to a radius of the rotating structure of 280 AU. This scale fits well to the sizes of the accretion disks simulated recently via 3-dimensional radiative-transfer hydrodynamic calculations by Krumholz et al. (2007).
Adopting the proposed disk scenario, we can estimate the approximate rotationally supported binding mass assuming equilibrium between the centrifugal and gravitational forces at the outer radius of the disk. Then we get
| (1) | |||||
| (2) |
is the disk radius, and the Half Width Zero Intensity (HWZI) of the spectral line, approximately 5.1 km s-1 (half the velocity range shown in Fig. 6). Equations 1 & 2 have to be divided by sin where is the unknown inclination angle between the disk plane and the plane of the sky ( for an edge-on system). With the given values we can estimate to /(sin) M⊙. This is of the same order as the mass derived from the mm continuum emission (Hunter et al. 2006) which is assumed to stem largely from the disk/envelope system.
How do these masses correspond to the mass and luminosity of the central embedded source? While the bolometric luminosity of NGC6334I is estimated to be L⊙ (Sandell 2000), approximately L⊙ are attributed to the UCHii region (based on the Lyman continuum flux presented in de Pree et al. 1995). One should keep in mind that this value may be a lower limit since dust could absorb a significant fraction of the uv-photons (Kurtz et al. 1994). The remaining L⊙ has to be due to the various sources associated with the hot molecular core. Since the associated mid-infrared source to the west (Fig. 1) is of relatively low luminosity (only 67 L⊙, De Buizer et al. 2002), it is likely that most of the luminosity stems from the two main continuum and spectral line peaks. In the extreme case, splitting the luminosity simply by two, it still implies that about L⊙ emanate from the mm1 region. Assuming a ZAMS star, this corresponds to an embedded star of 30 M⊙. In the above adopted accretion disk scenario, this would imply an inclination angle between the disk plane and the plane of the sky of approximately 30 degrees. However, with the large uncertainties in the rotational mass and the central object mass estimate, such an inclination angle estimate should not be taken at face value, but only gives a rough idea that the system is neither edge- nor face-on. The comparable mass derived from the mm continuum emission (Hunter et al. 2006) indicates that a significant fraction of the total system mass stems from the proposed accretion disk and envelope. This implies that the rotating structure is unlikely in Keplerian motion but that it may be a self-gravitating structure and potential site of ongoing sub-fragmentation (see also comparable analytic calculations and hydro-simulations by, e.g., Kratter & Matzner 2006 and Krumholz et al. (2007)).
However, on a cautionary note, one has to keep in mind that the data are not conclusive as to whether we really see disk signatures or whether the observed gradient may be caused by other motions, e.g., an unresolved double-source.
3.1.3 The molecular outflow observed in HCN(1–0)
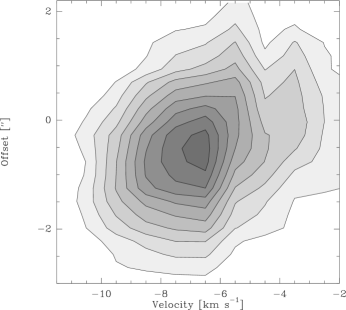
The blue- and red-shifted HCN(1–0) emission in Figure 1 shows high-velocity emission associated with the molecular outflow in north-east south-western direction (Bachiller & Cernicharo 1990; Leurini et al. 2006). The PA of the emission is not exactly the 45 degrees derived previously from the single-dish CO observations but it is closer to 65 degrees. However, such a discrepancy is not necessarily a surprise if one considers the missing flux problem we encounter in the HCN observations. Figure 8 (bottom panel) presents the HCN spectrum extracted toward the mm1 peak position, and while we see well the blue- and red-shifted emission, nearly all the flux around the of km s-1 is filtered out. This is also the reason why we do not see HCN emission from the hot core itself, which is prominent in CH3CN. Therefore, we just see some selectively chosen part of the outflow in HCN that could for example be associated with the limb-brightened cavity walls of the outflow which would explain the different apparent PA of the image. Figure 9 shows a position-velocity diagram centered at the main mm emission and CH3CN peak mm1 along the apparent axis of the HCN emission. Again we find no emission around the systemic but going to higher velocities, the blue- and red-shifted gas exhibits increasing velocity with increasing distance from the center, closely resembling the typical Hubble-law of molecular outflows (e.g., Lee et al. 2001). Such Hubble-law like behavior can be explained on the smallest jet-scales close to the protostar by the decreasing gravitational potential of the central star, however, on the larger scales we observe here this effect gets negligible and the Hubble-law of molecular outflows is explained by a density gradient decreasing with distance combined with the continuous (or episodic) driving of the jet that constantly induces energy in the outflow (e.g., Shu et al. 1991; Smith et al. 1997; Downes & Ray 1999).
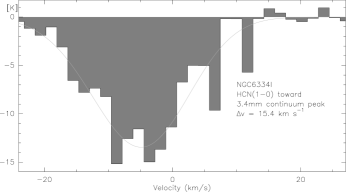
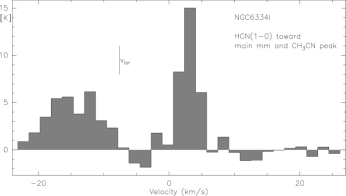

Figure 10 (top panels) presents the 1st and 2nd moment map (intensity-weighted peak velocity and line-width distributions) of the HCN(1–0) emission. It is interesting to note that the line-width distribution clearly peaks toward the strongest mm continuum and molecular line source mm1 and that the large-scale HCN velocity gradient is approximately centered toward that position as well. This is indicative of a scenario which puts the driving source of the molecular outflow observed in HCN at this position. However, previous NH3(6,6) maser observations showed the maser peak position being associated with mm2 with additional features along the axis of the CO molecular outflow (Beuther et al. 2007b). These features were interpreted as indicative of this outflow being driven by a source associated with mm2. While the case is not clear-cut with two independent and different outflow driver indications, it is also possible that we are witnessing two different outflows observed in HCN and CO that may emanate from mm1 and mm2, respectively. In this scenario, mm1 could be the driver of a potentially denser and younger outflow that is better detected in HCN, whereas mm2 may be the driver of the larger, possibly older outflow observed in CO. Future observations at higher angular resolution and/or with different outflow tracers are required to assess the validity of this scenario.
3.1.4 Absorption toward the UCHii region
Another interesting feature of the HCN data is that we see strong absorption in the direction of the UCHii region, similar to the previously observed absorption in CH3OH and NH3 (Beuther et al. 2005). Figure 8 (top panel) shows the HCN(1–0) spectrum extracted toward the 3.4 mm continuum peak position. Fitting the HCN(1–0) line-width, we take into account its hyperfine structure consisting of three lines () with relative intensities of 1:5:3 in the optically thin limit and velocity shifts of -7.1, 0 and 4.9 km s-1, respectively (Poynter & Pickett 1985). The line-width of that absorption feature is 15.4 km s-1, much broader than the previously observed line-widths between 1.7 and 2.1 km s-1 for CH3OH and between 1.3 and 1.9 km s-1 for NH3(1,1) and NH3(2,2) (Beuther et al. 2005). Table 4 lists the observed line-widths as well as the upper level excitation temperatures and the critical densities for all observed absorption lines. The other extreme of the line-widths distribution is the line-width of the ionized gas observed in the H76 line km s-1 (de Pree et al. 1995).
Inspecting the values in Table 4 one can discern two trends: the first is the distinction between the broad line-width and high critical density line HCN versus the small line-width and low critical density lines from NH3 and CH3OH. In addition, within the low critical density molecules, one can tentatively identify a correlation between increasing and increasing line-width. Although judging from the errors this correlation is less clear, it remains suggestive.
| Line | |||
|---|---|---|---|
| [K] | [cm-3] | [km/s] | |
| NH3(1,1) | 24 | 2.1e3 | |
| NH3(2,2) | 65 | 2.2e3 | |
| CH3OH | 36 | 1.0e4 | |
| CH3OH | 45 | 1.2e4 | |
| CH3OH | 29 | 0.8e4 | |
| HCN(1–0) | 4 | 2.6e6 |
The NH3 and CH3OH data are from Beuther et al. (2005). The listed parameters are the upper level excitation energies , the critical densities calculated at 60 K and the observed line-widths of the absorption lines toward the UCHii region peak position.
There are different possibilities to explain such trends: The picture of an expanding UCHii region111In contrast to the previous CH3OH and NH3 absorption lines that showed additional blue-shifted emission indicative of expanding gas around the UCHii region (Beuther et al. 2005), the HCN data do not exhibit any clear expansion or infall signature. (Beuther et al. 2005) in its surrounding envelope implies that closer to the UCHii region surface the molecular densities and temperatures are higher than further outside. Therefore, spectral lines tracing higher densities around an expanding UCHii region are expected to exhibit broader line-widths because their emitting gas is more directly impacted than the lower-density medium further out. A similar explanation could hold for the different excitation temperature regimes as well. A point of caution is that the opacity of HCN is probably one to two orders of magnitude larger than that of, e.g., NH3. While we do not detect any NH3 satellite hyperfine structure lines in absorption implying low NH3 opacities, we cannot infer that exactly for HCN. If the HCN(1–0) optical depth were that high that it could not trace the dense gas regions close to the expanding UCHii region, then the above picture could hardly hold. Another explanation is based on the enhancement of HCN in the molecular outflow. Although the outflow does not emanate from the UCHii region but from the neighboring mm continuum source(s), de Pree et al. (1995) found a velocity gradient in the ionized gas similar to that of the molecular outflow. They suggest that the molecular outflow(s) in the region may well disturb the velocity field of the UCHii region and produce the velocity gradient this way. Since HCN is known to be abundant in molecular outflows (see also IRAS 18566+0408, Zhang et al. 2007, and IRAS 20126+4104, Liu et al. in prep.) a similar effect could explain the broad HCN(1–0) line-widths toward the UCHii region. However, the 1st and 2nd moment maps (peak velocities and line-widths) of the HCN(1–0) absorption presented in Fig. 10 (bottom panels) show no velocity gradient but a peak of the line-width distribution close to the center of the UCHii region. This is counter-intuitive for the outflow picture and suggests that the line-width differences are caused by the expanding UCHii region, possibly in a fashion comparable to that proposed above. Nevertheless, without knowing the optical depth of the HCN(1–0) line we cannot distinguish between the two scenarios.
3.2 NGC6334I(N)
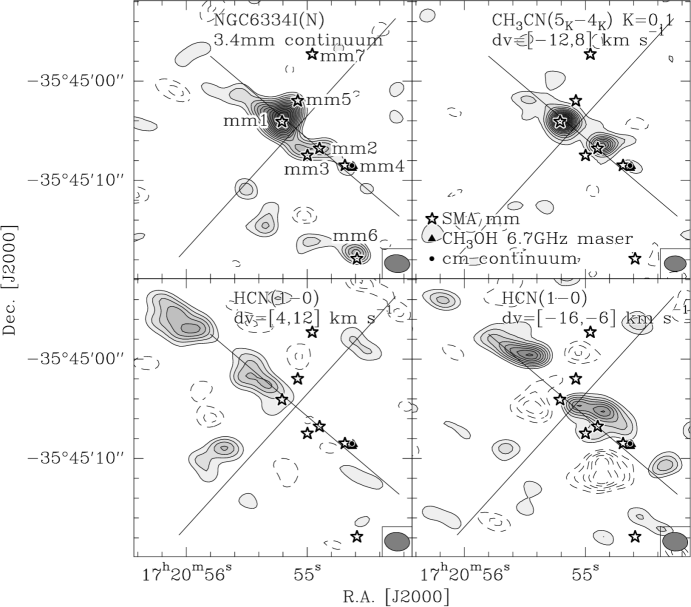
3.2.1 Millimeter continuum emission
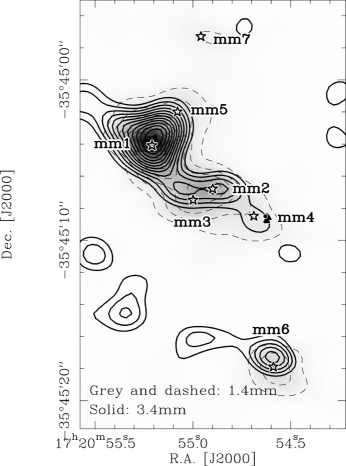
Figure 2 (top-left panel) presents the 3.4 mm continuum emission toward NGC6334I(N). In contrast to NGC6334I, where we only see the UCHii region in the 3.4 mm continuum, toward NGC6334I(N) we detect four out of seven previously identified protostellar 1.4 mm dust continuum condensations (Hunter et al. 2006) above a level of 13 mJy beam-1. The peak fluxes of the four sources, mm1 to mm3 and mm6, are listed in Table 5. Emission features below are not considered further. The 3.4 mm peak associated with mm1 is the strongest and shows an additional extension toward the north-western 1.4 mm source mm5. In contrast to that, the 1.4 mm peak mm4, which is associated with cm continuum and CH3OH class ii maser emission, is not detected in our data above the level.
For a better comparison of the 3.4 mm fluxes with the previously observed 1.4 mm observations, we re-imaged the 1.4 mm data with exactly the same synthesized beam of (position angle of 84 degrees from north). Figure 11 presents an overlay of the SMA 1.4 mm data with the ATCA 3.4 mm data at this same spatial resolution. While mm1 and mm6 are clearly separated in both wavelength bands, it is interesting to note that mm2 and mm3 merge in the 1.4 mm image at the reduced lower spatial resolution. The corresponding 1.4 mm peak fluxes are listed in Table 5. For the well separated sources mm1 and mm6 we can estimate the spectral indices between both bands now, the derived values are 3.7 and 3.1, respectively (Table 5).
Recently Rodríguez et al. (2007) showed that the cm emission from NGC6334I(N) is caused by free-free emission, whereas shortward of 7 mm wavelength the spectral energy distribution is dominated by dust continuum emission. In the Rayleigh-Jeans limit, the flux scales with where is the dust opacity index. With the measured spectral index , we have dust opacity indices of 1.7 and 1.1 for mm1 and mm6, respectively. While the value of mm1 is consistent with often observed values between 1.5 and 2, it is lower for mm6. Although the synthesized beams of both maps are the same, the uv-coverage was not during the observations. Furthermore, the continuum maps show a more peaked morphology toward mm1 than toward mm6. Thus, it is possible that mm6 has more extended structure and that this may be sampled better by the ATCA observations, possibly accounting for the observed lower values of and toward mm6. However, it is also feasible that physical reasons are responsible for this effect because a decreasing can be attributed to grain growth in circumstellar disks as well (e.g., Beckwith et al. 1990). Nevertheless, in this scenario, it appears surprising that mm1, which likely drives an outflow and hence probably contains an accretion disk, has a value of close to the interstellar medium values, whereas the source mm6, that does not exhibit clear signs of ongoing star formation, shows a lower value. Low values could in principle also be caused by high optical depth or an early high-frequency turnover of the Planck-function caused by the low temperatures. However, the Planck-turnover of even a cold core starts changing the slope of the Rayleigh-Jeans part of the spectral energy distribution usually only above 350 GHz (e.g., Beuther et al. 2007a), and high optical depth compared to mm1 appears unlikely as well. Therefore, spatial filtering as well as physical effects could produce the low toward mm6, but we cannot set better constraints here.
It should be noted that the spectral indices we find between 3.4 and 1.3 mm are larger than those derived previously by Rodríguez et al. (2007) based on VLA 7 mm data and the 1.3 mm data by Hunter et al. (2006). They find of 2.4 for both sources mm1 and mm6. A potential explanation for this discrepancy can arise from different dust components traced by the various arrays. While the VLA 7 mm observations could be dominated by a compact dusty disk-component that remains optically thick at shorter wavelengths, the 3.4 and 1.4 mm data are likely dominated by the larger-scale optically thin envelope. This envelope with spectral indices between 3.1 and 3.7 (for mm1 and mm6) is weak and below the detection limit at 7 mm, which can cause the non-detection of any large-scale emission in the VLA data. A general word of caution should be added that comparing fluxes from different interferometers may be unreliable because spatial filtering usually affects the fluxes of most measurements. Reducing datasets with similar uv-coverage and the same synthesized beam, as we have done here for the 3.4 and 1.4 mm data, helps to minimize this problem.
| Source | |||
|---|---|---|---|
| [mJy/beam] | [mJy/beam] | ||
| mm1 | 36.6 | 1077 | 3.7 |
| mm2 | 14.2 | 524a | |
| mm3 | 14.2 | 524a | |
| mm6 | 17.1 | 285 | 3.1 |
a The sources mm2 and mm3 are merged in the 1.4 mm dataset.
3.2.2 Dense gas traced by CH3CN
The dense gas traced via the CH3CN -ladder exhibits two prominent peaks associated with the two main mm continuum sources mm1 and mm2 (Fig. 2). There is an additional tentative CH3CN peak toward the mm peak mm4 associated with the cm and CH3OH maser position, however, we refrain from further interpretation of this because the map shows negative features due to the incomplete uv-sampling and hence poor deconvolution on a comparable level. The other 1.4 and 3.4 mm continuum sources are not detected in the CH3CN emission. This indicates that the average densities and/or abundances at those other mm positions are likely lower than the critical densities of the CH3CN lines of a few times cm-3 (Table 1). Based on this, one can speculate that except for the sources mm1, mm2 and mm4, all other mm continuum peaks may still be in a pre-stellar phase prior to active star formation.
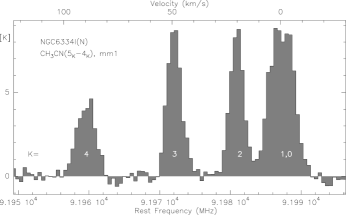
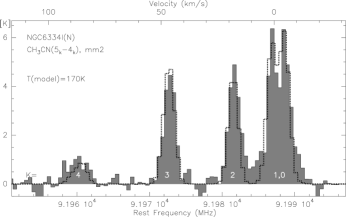
Figure 12 presents the whole CH3CN -ladder spectrum extracted from the data-cube toward the two peak positions, and we again detect all -components in both sources. The spectrum toward mm1 suffers from very high opacity problems as already outlined for NGC6334I (§3.1.2), prohibiting any temperature estimate. However, for mm2 the situation is slightly different and temperature estimates become feasible. Again using the XCLASS software, we produced model spectra, and the CH3CN spectrum can be fitted with temperatures in the regime of K. Such high temperatures additionally confirm the hot core-like nature of these sub-sources within the overall still relatively cold region NGC6334I(N) (e.g., Gezari 1982).
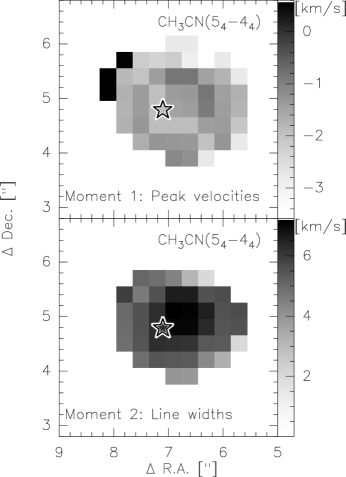
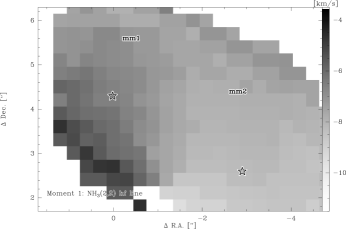
Since previous NH3(6,6) observations showed a double-horn spectral profile toward mm1 (Beuther et al. 2007b), which could potentially be produced by an underlying accretion disk, we searched the high- CH3CN lines for rotation signatures as well. Figure 13 presents the 1st and 2nd moment maps of the CH3CN line toward mm1. While we see a line-width increase toward the center, which is indicative of more activity in the central region (e.g., rotation, outflow, infall), we cannot identify any obvious velocity gradient. Therefore, the data do not allow a more detailed analysis of the previously proposed underlying disk.
3.2.3 A precessing outflow?
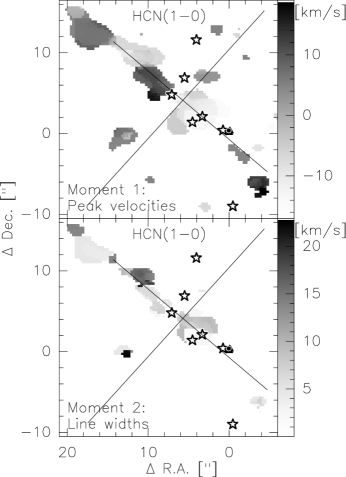
The HCN(1–0) emission suffers strongly from the missing short spacings as indicated by all the negative features seen in Figure 2. The morphology of the remaining HCN emission structures nevertheless indicates that most of it is associated with the north-east south-west molecular outflow than with the perpendicular one. Figure 14 shows the 1st and 2nd moment maps of the HCN emission, and the peak velocity and line-width distributions are a bit peculiar. The most red- and blue-shifted emission is centered around mm1 indicating that this is likely the driver of the north-east/south-west outflow. However, going further to the north-east along the major outflow axis we find an inversion of the outflow velocities from red-shifted close to the protostar to blue-shifted at offsets around () from the phase center and then again red-shifted emission further outward at offsets around (). Regarding the line-width distribution, the 2nd moment map in Figure 14 shows that the red-shifted parts of the north-eastern outflow wing have systematically less broad lines than the blue-shifted part. This whole behavior is less pronounced in the south-western outflow direction.
While the line-width differences are hard to explain, the change between blue-and red-shifted outflow emission is consistent with a picture in which a mean molecular outflow axis is close to the plane of the sky, and where the outflow precesses around that axis, producing in some region the receding red-shifted and in other regions the approaching blue-shifted emission. This precession picture is further supported by the spatial distribution of the HCN emission which resembles a reverse S-shaped morphology in the 1st moment map (Fig. 14).
The 2nd south-east north-west outflow is so far only observed at lower spatial resolution by Megeath & Tieftrunk (1999), who did not identify a driving source for it. While it could emanate from any other source, e.g. mm2, it is also possible that it originates from the vicinity of mm1. In the framework of precessing jets, a likely reason to cause the precession is the existence of multiple embedded objects (e.g., Fendt & Zinnecker 1998) which hence could also produce the quadrupolar outflow morphology (e.g., Gueth et al. 2001).
4 Conclusions and Summary
Our 3.4 mm continuum and CH3CN/HCN spectral line study of the massive twin cores NGC6334I and I(N) reveals many new insights into that intriguing pair of massive star-forming regions. Both sets of spectral lines as well as the continuum emission are clearly detected toward both targets. While the continuum emission in NGC6334I mainly follows the UCHii regions and the strongest protostellar 1.4 mm peak is detected only at a level, in NGC6334I(N), the 3.4 mm continuum emission traces four of the previously identified protostellar or pre-stellar condensations.
In both regions, the whole CH3CN -ladder from to 4 is detected toward the strongest protostellar condensations. While the emission is in most cases so optically thick that temperature estimates are prohibited, toward the secondary mm peak in NGC6334I(N) we can estimate a temperature of K. Toward all four detected CH3CN emission sources, we find a correlation between increasing line-width and increasing excitation temperature of the components. Since increasing excitation temperatures are expected closer to the protostars, this implies more internal motions, e.g., outflow, infall or rotation, the closer one gets to the central protostar. Similar signatures are observed in the CH3CN 2nd moment maps.
To investigate potential rotation, we produced 1st moment maps toward all CH3CN peaks, and fitted the channel peak positions toward mm1 in NGC6334I to effectively increase the spatial resolution. We identify a velocity gradient toward mm1 in NGC6334I that is oriented approximately perpendicular to the known large-scale outflow. This may be interpreted as a signature of a rotating structure, maybe associated with a massive accretion disk. While early rotation-disk claims for that region were on scales of the molecular outflow (Jackson et al. 1988), we are now reaching spatial scales of the order a few hundred AU, much more reasonable for accretion disks (e.g., Yorke & Sonnhalter 2002; Krumholz et al. 2007). However, we have to stress that the rotation signatures are not conclusive yet because, e.g., an unresolved double-source could produce similar signatures. Further investigation at higher angular resolution are required to resolve this issue. While higher angular resolution images with the ATCA at 3 mm wavelengths are difficult because of decreasing phase stability with increasing baseline length, one may tackle that problem in some highly excited NH3 lines in the 12 mm band. Furthermore, ALMA will allow the investigation of this source in much greater depth. Toward the previously suggested disk candidate in NGC6334I(N) we cannot identify a similar velocity gradient.
In contrast to conventional wisdom that HCN traces the dense gas cores, we find it most prominently in the molecular outflows of both massive star-forming regions. The velocity structure of the outflow in NGC6334I is relatively normal and follows the well-known Hubble-law for molecular outflows. In addition to that, we find the broadest HCN line-width toward the main mm continuum peak mm1. In contrast to the previously found elongation of NH3(6,6) maser emission indicating that mm2 could drive the molecular outflow, these data suggest that mm1 harbors the outflow driving source. However, it is also possible that there are two molecular outflows with different properties that are preferentially detected in different tracers (HCN in this work and CO for the previous larger-scale outflow detection at a slightly different position-angle). The velocity structure of the NGC6334I(N) outflow is more peculiar. There we find a change between blue- and red-shifted outflow emission on one side of the outflow. Taking into account the additionally bended morphology of that outflow, a possible explanation for this velocity structure is a precessing outflow close to the plane of the sky.
Furthermore, HCN exhibits a broad absorption feature with a line-width of km s-1 toward the UCHii region in NGC6334I. Comparing the line-width of the previously observed absorption features of NH3 and CH3OH, which are of the order 2 km s-1, with the HCN line-width as well as the line-width observed in the ionized gas of 32 km s-1, two explanations are possible to explain the different line-widths. The velocity gradient identified in the ionized gas indicates that it may be influenced by the molecular outflow close by. If the opacity of HCN were very large it traced only the outer gas layers around the UCHii region and could also be influenced by the outflow. On the other hand, NH3 is optically thin based on the absent absorption in the hyperfine satellite lines. If HCN were optically thin as well, another possible explanation would be based on the different critical densities of the various molecules: In the picture of an expanding UCHii region, the densities close to the UCHii region surface should be higher than those further outside. Hence HCN may trace the gas closer to the expanding UCHii region and is then much stronger affected by the expansion process that the lower-density regions further out that are traced by NH3 and CH3OH. To differentiate between both models, observations of a rarer HCN isotopologues are required to derive its optical depth.
Acknowledgements.
We like to thank Peter Schilke for providing the XCLASS software to model the CH3CN spectra. Furthermore, we appreciate the careful referee’s report which helped improving the paper. H.B. acknowledges financial support by the Emmy-Noether-Program of the Deutsche Forschungsgemeinschaft (DFG, grant BE2578).References
- Bachiller & Cernicharo (1990) Bachiller, R. & Cernicharo, J. 1990, A&A, 239, 276
- Beckwith et al. (1990) Beckwith, S. V. W., Sargent, A. I., Chini, R. S., & Guesten, R. 1990, AJ, 99, 924
- Beuther et al. (2007a) Beuther, H., Leurini, S., Schilke, P., et al. 2007a, A&A, 466, 1065
- Beuther et al. (2005) Beuther, H., Thorwirth, S., Zhang, Q., et al. 2005, ApJ, 627, 834
- Beuther et al. (2007b) Beuther, H., Walsh, A. J., Thorwirth, S., et al. 2007b, A&A, 466, 989
- Brogan et al. (2007) Brogan, C. L., Chandler, C. J., Hunter, T. R., Shirley, Y. L., & Sarma, A. P. 2007, ApJ, 660, L133
- Brooks & Whiteoak (2001) Brooks, K. J. & Whiteoak, J. B. 2001, MNRAS, 320, 465
- Carral et al. (2002) Carral, P., Kurtz, S. E., Rodríguez, L. F., et al. 2002, AJ, 123, 2574
- Caswell (1997) Caswell, J. L. 1997, MNRAS, 289, 203
- Comito et al. (2005) Comito, C., Schilke, P., Phillips, T. G., et al. 2005, ApJS, 156, 127
- De Buizer et al. (2002) De Buizer, J. M., Radomski, J. T., Piña, R. K., & Telesco, C. M. 2002, ApJ, 580, 305
- de Pree et al. (1995) de Pree, C. G., Rodriguez, L. F., Dickel, H. R., & Goss, W. M. 1995, ApJ, 447, 220
- Downes & Ray (1999) Downes, T. P. & Ray, T. P. 1999, A&A, 345, 977
- Fendt & Zinnecker (1998) Fendt, C. & Zinnecker, H. 1998, A&A, 334, 750
- Forster & Caswell (1989) Forster, J. R. & Caswell, J. L. 1989, A&A, 213, 339
- Gaume & Mutel (1987) Gaume, R. A. & Mutel, R. L. 1987, ApJS, 65, 193
- Gezari (1982) Gezari, D. Y. 1982, ApJ, 259, L29
- Gueth et al. (2001) Gueth, F., Schilke, P., & McCaughrean, M. J. 2001, A&A, 375, 1018
- Hunter et al. (2006) Hunter, T. R., Brogan, C. L., Megeath, S. T., et al. 2006, ApJ, 649, 888
- Jackson et al. (1988) Jackson, J. M., Ho, P. T. P., & Haschick, A. D. 1988, ApJ, 333, L73
- Kogan & Slysh (1998) Kogan, L. & Slysh, V. 1998, ApJ, 497, 800
- Kraemer & Jackson (1995) Kraemer, K. E. & Jackson, J. M. 1995, ApJ, 439, L9
- Kraemer & Jackson (1999) Kraemer, K. E. & Jackson, J. M. 1999, ApJS, 124, 439
- Kratter & Matzner (2006) Kratter, K. M. & Matzner, C. D. 2006, MNRAS, 373, 1563
- Krumholz et al. (2007) Krumholz, M. R., Klein, R. I., & McKee, C. F. 2007, ApJ, 656, 959
- Kurtz et al. (1994) Kurtz, S., Churchwell, E., & Wood, D. O. S. 1994, ApJS, 91, 659
- Lee et al. (2001) Lee, C., Stone, J. M., Ostriker, E. C., & Mundy, L. G. 2001, ApJ, 557, 429
- Leurini et al. (2006) Leurini, S., Schilke, P., Parise, B., et al. 2006, A&A, 454, L83
- Loren & Mundy (1984) Loren, R. B. & Mundy, L. G. 1984, ApJ, 286, 232
- Müller et al. (2001) Müller, H. S. P., Thorwirth, S., Roth, D. A., & Winnewisser, G. 2001, A&A, 370, L49
- McCutcheon et al. (2000) McCutcheon, W. H., Sandell, G., Matthews, H. E., et al. 2000, MNRAS, 316, 152
- Megeath & Tieftrunk (1999) Megeath, S. T. & Tieftrunk, A. R. 1999, ApJ, 526, L113
- Moran & Rodríguez (1980) Moran, J. M. & Rodríguez, L. F. 1980, ApJ, 236, L159
- Neckel (1978) Neckel, T. 1978, A&A, 69, 51
- Norris et al. (1993) Norris, R. P., Whiteoak, J. B., Caswell, J. L., Wieringa, M. H., & Gough, R. G. 1993, ApJ, 412, 222
- Olmi et al. (1993) Olmi, L., Cesaroni, R., & Walmsley, C. M. 1993, A&A, 276, 489
- Pei & Zeng (1995a) Pei, C. C. & Zeng, Q. 1995a, Acta Astronomica Sinica, 36, 215
- Pei & Zeng (1995b) Pei, C. C. & Zeng, Q. 1995b, Acta Astronomica Sinica, 36, 20
- Persi et al. (2005) Persi, P., Tapia, M., Roth, M., Gómez, M., & Marenzi, A. R. 2005, in IAU Symposium, ed. R. Cesaroni, M. Felli, E. Churchwell, & M. Walmsley, 291–296
- Poynter & Pickett (1985) Poynter, R. L. & Pickett, H. M. 1985, Appl. Opt., 24, 2235
- Reid et al. (1988) Reid, M. J., Schneps, M. H., Moran, J. M., et al. 1988, ApJ, 330, 809
- Rodríguez et al. (1982) Rodríguez, L. F., Canto, J., & Moran, J. M. 1982, ApJ, 255, 103
- Rodríguez et al. (2007) Rodríguez, L. F., Zapata, L. A., & Ho, P. T. P. 2007, ApJ, 654, L143
- Sandell (2000) Sandell, G. 2000, A&A, 358, 242
- Schilke et al. (2006) Schilke, P., Comito, C., Thorwirth, S., et al. 2006, A&A, 454, L41
- Schöier et al. (2005) Schöier, F. L., van der Tak, F. F. S., van Dishoeck, E. F., & Black, J. H. 2005, A&A, 432, 369
- Shu et al. (1991) Shu, F. H., Ruden, S. P., Lada, C. J., & Lizano, S. 1991, ApJ, 370, L31
- Smith et al. (1997) Smith, M. D., Suttner, G., & Yorke, H. W. 1997, A&A, 323, 223
- Sollins & Megeath (2004) Sollins, P. K. & Megeath, S. T. 2004, AJ, 128, 2374
- Straw & Hyland (1989) Straw, S. M. & Hyland, A. R. 1989, ApJ, 340, 318
- Tapia et al. (1996) Tapia, M., Persi, P., & Roth, M. 1996, A&A, 316, 102
- Thorwirth et al. (2003) Thorwirth, S., Winnewisser, G., Megeath, S. T., & Tieftrunk, A. R. 2003, in ASP Conf. Ser. 287: Galactic Star Formation Across the Stellar Mass Spectrum, 257–260
- Tielens (2005) Tielens, A. G. G. M. 2005, The Physics and Chemistry of the Interstellar Medium (The Physics and Chemistry of the Interstellar Medium, Cambridge University Press)
- Walsh et al. (1998) Walsh, A. J., Burton, M. G., Hyland, A. R., & Robinson, G. 1998, MNRAS, 301, 640
- Walsh et al. (2007) Walsh, A. J., Longmore, S. N., Thorwirth, S., Urquhart, J. S., & Purcell, C. R. 2007, MNRAS, 382, L35
- Yorke & Sonnhalter (2002) Yorke, H. W. & Sonnhalter, C. 2002, ApJ, 569, 846
- Zhang et al. (2007) Zhang, Q., Sridharan, T. K., Hunter, T. R., et al. 2007, A&A, 470, 269