11email: tomkam@ncac.torun.pl
Extended CO emission in the field of the light echo of V838 Monocerotis††thanks: Based on observations carried out with the IRAM 30-meter telescope. IRAM is supported by INSU/CNRS (France), MPG (Germany), and IGN (Spain).
Abstract
Context. V838 Mon erupted at the beginning of 2002 becoming an extremely luminous star with L=106 L☉. The outburst was followed by the most spectacular light echo that revealed that the star is immersed in a diffuse and dusty medium, plausibly interstellar in nature. Low angular resolution observations of the star and its closest vicinity in the lowest CO rotational transitions revealed a molecular emission from the direction of V838 Mon. The origin of this CO emission has not been established.
Aims. The main aim of this paper is to better constrain the nature of the CO emission. In particular, we investigate the idea that the molecular emission originates in the material responsible for the optical light echo.
Methods. We performed observations of 13 positions within the light echo in the two lowest rotational transitions of 12CO using the IRAM 30 m telescope.
Results. Emission in CO 1– 0 and 2–1 was detected in three positions. In three other positions only weak 10 lines were found. The lines appear at two different velocities 53.3 km s-1 and 48.5 km s-1, and both components are very narrow with FWHM1 km s-1.
Conclusions. The molecular emission from the direction of V838 Mon is extended and has a very complex distribution. We identify the emission as arising from diffuse interstellar clouds. A rough estimate of the mass of the molecular matter in those regions gives a few tens of solar masses. The radial velocity of the emission at 53.3 km s-1 suggest that the CO-bearing gas and the echoing dust are collocated in the same interstellar cloud.
Key Words.:
radio lines: ISM – ISM: clouds – ISM: molecules – stars: individual: V838 Mon – stars: peculiar1 Introduction
V838 Mon is a star that brightened significantly at the beginning of 2002 becoming a very luminous object with a luminosity of 106 L☉. The outburst lasted for 3 months and was characterized by a rather complex light curve with three distinct maxima seen in the optical. Several broad P-Cygni profiles observed during the brightening imply that the event was accompanied by an outflow with terminal velocities of several hundred km s-1 (e.g. Kipper et al. 2004). The end of the eruption was characterized by a very steep decline with a total drop in brightness in the V band of about 8 mag within one month. Unlike novae, the object evolved from a hot stage with an F-type spectrum to progressively lower and lower temperatures and eventually it turned into a supergiant cooler than M10 (Evans et al. 2003). Named the first L supergiant, the star has exhibited an extraordinary molecular spectrum studied extensively in optical (e.g. Pavlenko et al. 2006) and infrared (e.g. Lynch et al. 2004). Even five years after the eruption, the object continues to evolve - after four years of a relatively constant photometric brightness, an eclipse-like event has been observed in the B and V light curves (Munari et al. 2007a). Detailed descriptions of the spectral and photometric behavior of V838 Mon can be found in: Munari et al. (2002), Kimeswenger et al. (2002), Wisniewski et al. (2003), Crause et al. (2003, 2005), Kipper et al. (2004), and Tylenda (2005).
Although there is great interest in V838 Mon among astrophysicists and many efforts have been made to gain a deeper understanding of the object, its nature remains unclear. A wide range of mechanisms have been proposed to explain the outburst including (i) thermonuclear models: a nova-like (Munari et al. 2002) or a He-shell flash (Lawlor 2005; Munari & Henden 2005), and (ii) merging events: a stellar merger of stars with masses of 8 M☉ and 0.3 M☉ (Soker & Tylenda 2003, 2007), and a giant swallowing planets (Retter & Marom 2003; Retter et al. 2006). It seems that the most promising is the stellar merger scenario (Tylenda & Soker 2006; Soker & Tylenda 2007).
Since February 2002 a light echo of V838 Mon has been observed (Henden et al. 2002). Its spectacular evolution, especially well documented by the series of the Hubble Space Telescope (HST) images (Bond et al. 2003; Bond 2007), revealed that V838 Mon is immersed in a diffuse and dusty medium with a very complex spatial distribution. There is no agreement about the origin of this matter. An analysis of the light echo images performed by Tylenda (2004) shows that the dusty region has a rather complex distribution and, most probably, is of interstellar origin (see also Crause et al. 2005; Tylenda et al. 2005). On the other hand, there are suggestions that the matter might have been ejected by the object itself in the past (Bond et al. 2003; Bond 2007).
A light echo analogue was discovered in the infrared with the Spitzer Space Telescope (Banerjee et al. 2006). The analysis of the infrared emission gives a few tens to a few hundreds of solar masses as an order of magnitude estimate for the mass of the gas associated with the emitting dust. This result is a strong argument supporting the idea of an interstellar origin of the echoing matter.
Kamiński et al. (2007a, b) discovered emission in the 12CO (2–1) and (3–2) transitions at the position of V838 Mon. The emission was detected inside the large KOSMA-telescope beams with half power widths (HPBWs) of 130 and 82. The detected lines are very narrow and appear at LSR velocity of 53.3 km s-1. The data analysis performed in Kamiński et al. (2007b) suggest that the emission is extended, but on the basis of the low-resolution observations it was not certain. Moreover, in observations performed in three epochs Kamiński et al. found small but possibly real variations in the intensity of the CO (2–1) line. Due to the unknown contribution to the intensity changes from antenna-pointing errors, the finding is also very uncertain.
Deguchi et al. (2007) observed the region around V838 Mon in the CO (1– 0) transition and detected a narrow emission line 30 north from the star position. This detection together with the observations reported in Kamiński et al. (2007b) show that some form of molecular matter must exist close to the direction of V838 Mon. Its nature has not been sufficiently established, but it is tempting to link the CO emitting gas with the dusty medium illuminated by the eruption of V838 Mon.
In the current paper, we present follow-up observations of the field around V838 Mon in the CO (1– 0) and (2–1) rotational transitions with a much better angular resolution than the observations reported in Kamiński et al. (2007a, b). The observational details are provided in Sect. 2, while the data are described in Sect. 3. In Sect. 4, we discuss the results, in particular, we investigate the possible origin of the CO emission found in the field around V838 Mon. Sect. 5 contains final conclusions and emphasizes the need for future observations of the echo region in molecular transitions.
2 Observations and data reduction
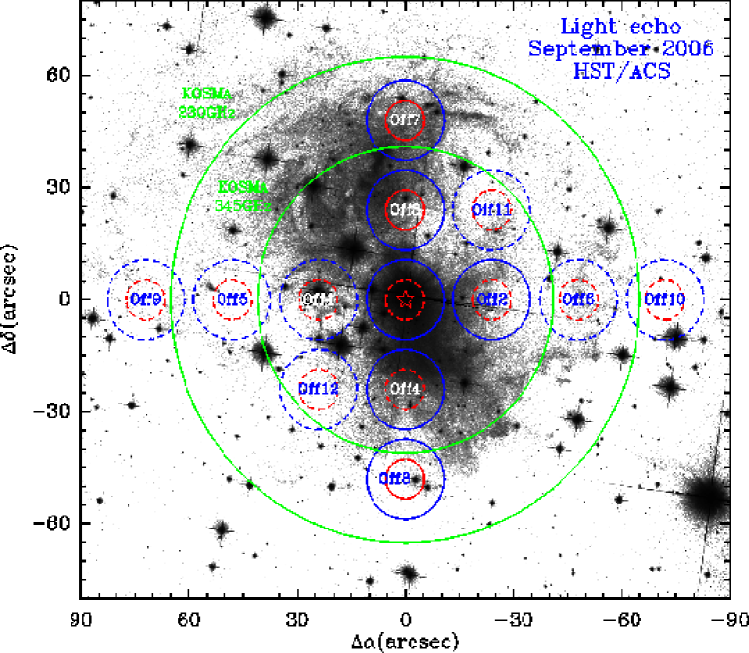
We observed 13 positions within the light echo of V838 Mon, including the star position. They are listed in Table 1 and marked on the optical light echo image in Fig. 1. Each of the positions was observed in the two lowest rotational transitions of 12CO, i.e. – at 2.6 mm (115.271 GHz) and –1 at 1.3 mm (230.538 GHz).
| position | int. time | (10) | (2–1) | ||
| [] | [] | [min] | [mK] | [mK] | |
| V838 Mon | 0 | 0 | 353.6 | 14.1 | 46.3 |
| Off1 | 24 | 0 | 66.3 | 27.3 | 82.1 |
| Off2 | –24 | 0 | 55.2 | 30.7 | 83.4 |
| Off3 | 0 | 24 | 55.2 | 33.4 | 95.8 |
| Off4 | 0 | –24 | 55.2 | 30.4 | 88.4 |
| Off5 | 48 | 0 | 55.2 | 41.2 | 154.0 |
| Off6 | –48 | 0 | 44.2 | 42.7 | 130.3 |
| Off7 | 0 | 48 | 55.3 | 33.9 | 106.1 |
| Off8 | 0 | –48 | 55.2 | 33.2 | 102.3 |
| Off9 | 72 | 0 | 22.1 | 46.9 | 149.2 |
| Off10 | –72 | 0 | 33.1 | 36.2 | 117.3 |
| Off11 | –24 | 24 | 33.2 | 51.4 | 143.9 |
| Off12 | 24 | –24 | 33.1 | 50.4 | 165.7 |
The observations were obtained with the IRAM 30 m telescope at Pico Veleta, Spain, on 27-28 September 2006. The half-power beam widths of the telescope are and at 115 GHz and 230 GHz, respectively. The spatial grid of the observations was arranged so that the distance between two neighboring positions is close to the twice the beam-width at 230 GHz, and the individual measurements obtained in the CO (2–1) transition can be considered as independent.
As frontends we used four (single pixel) heterodyne SIS receivers (A100, B100, A230, and B230) simultaneously. The observations were carried out in single sideband mode, with rejection factors of the image sideband set to 22 dB and 17 dB for the observations at 115 GHz and 230 GHz, respectively. As a backend we used the spectrometric array VESPA. All the spectra were acquired with a resolution of 78.1 kHz and with a bandwidth of 107 MHz. The frequency resolution corresponds to a resolution in velocity units of 0.20 km s-1 at 115 GHz, and 0.10 km s-1 at 230 GHz.
All the observations were performed using a frequency switching technique. The frequency switch throw was 15.6 MHz (i.e. frequency was switched by 7.8 MHz), which is equivalent to a velocity throw of 40.7 km s-1 at 115 GHz, and 20.3 km s-1 at 230 GHz. Pointing and focusing were carried out on the strong continuum source 0528+134 every 2 h. The resulting pointing accuracy of our observations is better than 4.
The data were calibrated using a chopper wheel method (Kutner & Ulich 1981) giving spectra in the antenna temperature, , i.e. corrected for atmospheric attenuation, ohmic losses, rearward spillover and scattering. The calibration at the IRAM 30 m is known to be very accurate and should be better than 10% for observations at 115 GHz.
The wavy baselines typical for frequency switching observations were reduced by subtracting sinusoidal functions; in a few cases subtraction of high order polynomials was necessary. All bad channels were removed, spectra from two receivers with orthogonal polarizations were coadded, and the resulting spectra were folded using the standard shift-and-add method. Finally, the observations were converted to the main beam temperature, , using forward and main beam efficiencies ( and respectively) of 0.95 and 0.74 at 115 GHz, and of 0.91 and 0.52 at 230 GHz. All the data reduction and analysis was performed using the GILDAS111See http://www.iram.fr/IRAMFR/GILDAS software package.
Although in this paper the scale is used, one can easily convert this intensity scale to ordinary flux density units using the conversion factor of 4.91 Jy K-1 for both the data sets obtained at 115 GHz and 230 GHz. All the velocities in this paper are given with respect to the local standard of rest (LSR).
Total integration times (a sum of the integration times from two orthogonally polarized receivers) and noise levels of the folded spectra are given in Table 1. The noise levels are given as a standard deviation (, in the main beam temperature) of a linear fit to the folded spectrum excluding all emission features and their aliases.
3 Results
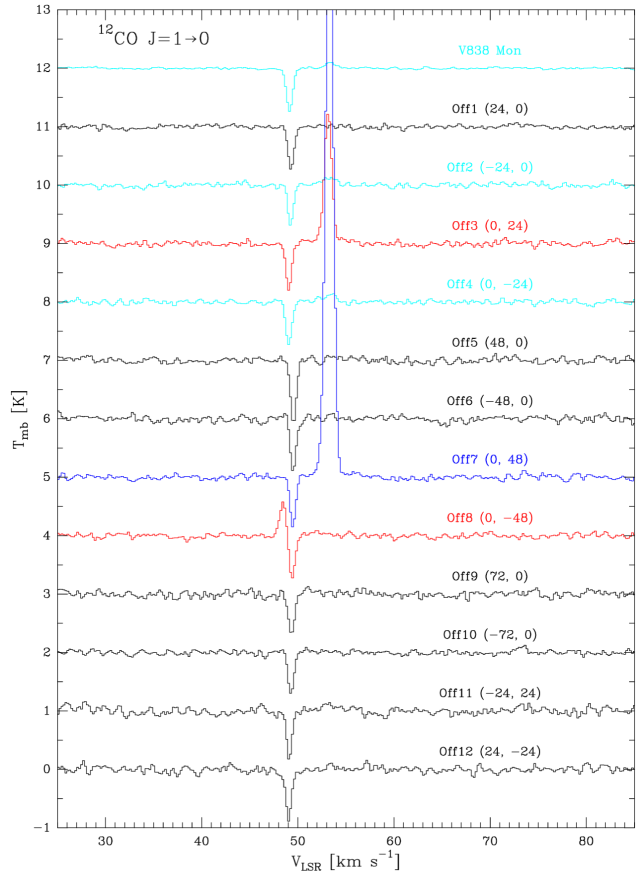
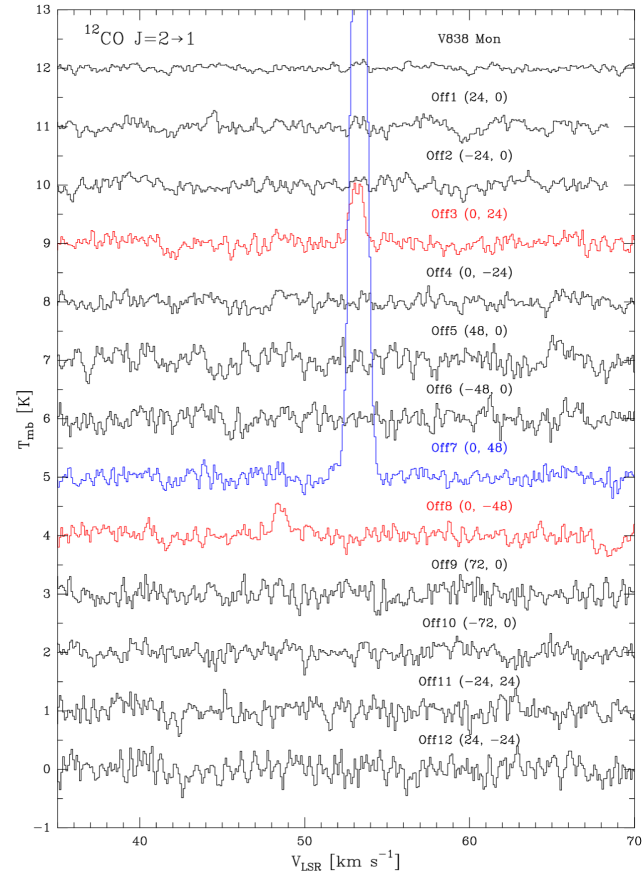
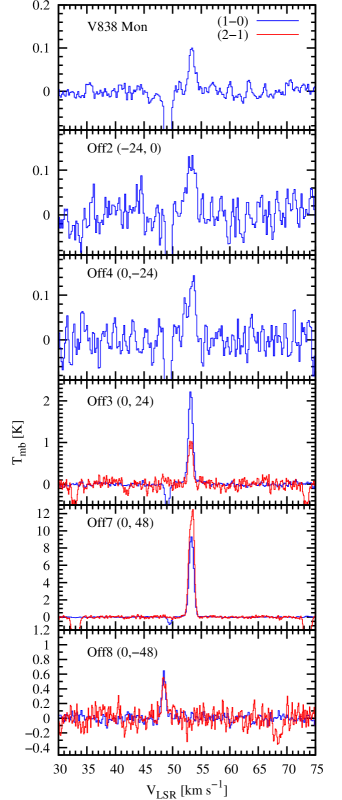
Emission in the CO (1– 0) transition was detected at 6 positions: Off2, Off3, Off4, Off7, Off8, and at the V838 Mon position; at three of those positions, namely at Off3, Off7, and Off8, also CO (2–1) emission is clearly present. The beams with a positive detection are shown with a solid line on Fig. 1. The spectra with the detections are shown on Fig. 2 and all the emission lines are characterized in Table 2 in terms of their central velocities, full widths at half maximum, intensities of the peak, and integrated intensities. The values given in Table 2 are results of a single Gaussians fit to the line profiles. All the reduced spectra are displayed in Figs. 3 and 4 in the online Appendix A.
| 12CO (10) | 12CO (2–1) | |||||||||
|---|---|---|---|---|---|---|---|---|---|---|
| position | VLSR | FWHM | peak | VLSR | FWHM | peak | ||||
| [] | [] | [km s-1] | [km s-1] | [K] | [K km s-1] | [km s-1] | [km s-1] | [K] | [K km s-1] | |
| V838Mon | 0 | 0 | 53.4 | 1.1 | 0.10 | 0.13 | ||||
| Off2 | –24 | 0 | 53.2 | 1.8 | 0.12 | 0.24 | ||||
| Off3 | 0 | 24 | 53.2 | 0.9 | 2.22 | 2.17 | 53.2 | 0.9 | 1.03 | 0.97 |
| Off4 | 0 | –24 | 53.3 | 1.7 | 0.12 | 0.22 | ||||
| Off7 | 0 | 48 | 53.3 | 1.0 | 9.47 | 9.77 | 53.3222the profile is clearly not a single Gaussian | 1.1a | 12.70a | 14.23a |
| Off8 | 0 | –48 | 48.5333measurements obtained at the unfolded spectrum | 0.8b | 0.61b | 0.54b | 48.5 | 0.8 | 0.50 | 0.41 |
The spectra displayed in Fig. 2 require a technical comment. Since frequency switching was employed as the observing method, the telluric (mesospheric) emission of CO was not removed from the spectra (see Thum et al. 1995, for more detailes about telluric CO emission in frequency switching observations). The telluric emission appears at the LSR velocity of the mesosphere in the time of the observations, which in our case was typically 8.8 km s-1. After folding procedure the telluric CO affects the spectra by the emission and its two aliases, i.e. absorption-like features shifted by 7.8 MHz with respect to the emission feature. Unfortunately, at the Off8 position celestial emission appears at (unexpected) velocity of 48.45 km s-1, which closely coincides with the position of the absorption alias of the CO (1– 0) telluric emission at 49.34 km s-1. Luckily, the emission line at 48.45 km s-1 is not affected by the mesosphecic alias on the spectrum before the folding procedure. Therefore on Fig. 2 we present the spectrum before folding and all the measurements given in Table 2 for the CO (1– 0) line at 48.45 km s-1 were performed on the unfolded spectrum, which has however a poorer noise characteristics than the unfolded one by a factor of .
In the following, we consider the detected CO (1– 0) emission in two groups, namely weak ( 0.15 K at the peak) and strong features (with peak much greater than 0.15 K). Weak emission is found at Off2, Off4, and at the star position. The emission at all of these positions appears at a velocity of 53.3 km s-1 and does not have any detectable counterpart in the corresponding CO (2–1) spectra. Emission in CO (2–1) is not seen, most probably due to higher noise in the 230 GHz data.
The strong emission of CO (1– 0) is found at the three positions along the north-south direction: Off3, Off7, and Off8. Especially prominent is the emission at Off3 and Off7. The lines both appear at radial velocity of 53.2 km s-1. The emission found at the Off8 position, as has already been noted, appears at the unexpected radial velocity 48.45 km s-1. All the three strong CO (1– 0) features have counterparts in the (2–1) spectra. Ratios of those lines are discussed in Sect. 4.2.
As can be seen in Table 2, all the detected lines are very narrow. The weakest CO (1– 0) features appear somewhat broader than the strong lines. Note that the feature found at the star position, where the integration time was much longer than at Off2 and Off4, is only slightly broader that the strong lines, hence one can state that the broadening of the weak features is an effect of a lower signal to noise ratio of the spectra. In general, the profiles of the detected lines are very well described by a Gaussian shape, except the most prominent line in our data, i.e. the CO (2–1) feature at Off7, which has a slightly asymmetric peak.
4 Discussion
The IRAM observations reported here confirm the suggestion made in Kamiński et al. (2007b) that the CO emission discovered in the direction of V838 Mon in the low angular resolution KOSMA data, is extended and not directly related to the object that erupted in 2002. Indeed, the measurements indicate that the CO emission has a very complex spatial distribution and is not only limited to the position of V838 Mon. In the following discussion we put some constraints on the origin of the molecular emission. In particular, we investigate the possibility of a physical connection of the CO emitting matter with the dusty environment revealed by the light echo.
4.1 Origin of the emission: circumstellar vs. interstellar
The strongest argument against circumstellar origin of the CO-bearing gas is the narrowness of the emission lines. If the extended molecular region originates as a result of a stellar mass loss before 2002, it would produce emission features certainly broader and more complex than the ones we see in the two CO transitions (e.g. Teyssier et al. 2006). Similarly, the emission found at the star position cannot be identified with the matter lost during and after the 2002 eruption. Indeed, numerous P-Cygni profiles observed during the outburst revealed matter expelled with velocities of several hundred km s-1 (e.g. Kipper et al. 2004) and the continuous outflow observed in V838 Mon since the outburst has a terminal velocity of about 150 km s-1 (Munari et al. 2007b). If any of this lost matter radiates in the CO rotational transitions, the emission should appear as a very broad feature with FWHM150 km s-1.
The narrowness of the detected CO lines indicates that the molecular emission arises in an interstellar medium. According to the classification in van Dishoek et al. (1993) and on the basis of line-width measurements (Table 2) we can classify the molecular regions we see in the CO emission as diffuse clouds. In light of the finding of Afşar & Bond (2007), namely that V838 Mon is a member of a B-stars association, the narrow CO emission can be attributed to an interstellar medium within the cluster. It may be the matter remaining after the dissipation of most of the parent molecular material from which the cluster had formed, much like the matter seen in the Pleiades cluster. We cannot rule out, however, the possibility that we see foreground and/or background clouds with respect to the location of the cluster or the star itself. The radial location of the clouds is discussed in more detail in Sect. 4.3.
Using the well known XCO-factor method we can estimate the mass of molecular matter inside the cloud. As found in Liszt (2007), the method gives satisfactory results even for very diffuse clouds, i.e. those with very small column densities of CO. The mass of molecular hydrogen can be expressed as:
| (1) |
where XCO is the conversion factor for the column density of H2 to integrated intensity of the CO (1– 0) emission, is the solid angle of the emitting region, is the distance to the cloud, and is the main beam integrated intensity. Here we take =2.8 (in units of 10cm-2 K-1 km-1 s, Bloemen et al. 1986) although values as high as 6 can be found in literature for clouds in the outer Galaxy (e.g. Kamiński et al. (2007b) found =5.4 for the dark clouds identified in the vicinity of V838 Mon). We can rewrite Eq. (1) as:
| (2) |
where is expressed in arcmin2, in kpc, and in K km s-1. The solid angle of a single beam at 115 GHz is approximately 0.144 arcmin2. We are interested in the total mass of the molecular matter radiating in CO (1– 0) in the six positions. With the sum of all the integrated intensities of 13.1 K km s-1 (see Table 2) and the distance to the star of 6.1 kpc (Sparks et al. 2007) we get a total mass of about 28 . The CO emission can be more extended than it appears in our spatially limited measurements, so the total mass of molecular matter is probably even higher. Moreover, the above value does not account for a mass of atomic gas, which can contribute considerably to the total mass of a diffuse cloud. This rough estimate shows, however, that the mass of the sampled regions is already quite high and cannot be interpreted as matter expelled by the star.
4.2 Spatial complexity of the molecular gas
The CO (2–1) emission found in our data exhibit various intensities with respect to the strength of the corresponding CO (1– 0) emission detected at the same position. The ratios of the integrated intensities of the CO (10) to (2–1) lines, , are 2.22, 0.69, and 1.31 for the positions Off3, Off7, and Off8, respectively. For a homogenous distribution of interstellar gas one would expect the CO (10) line to be stronger, since it was observed with the larger beam. The wide variety in the values of in our data can be interpreted as a result of a highly complex distribution of the emitting gas. In other words, that can be an effect of different beam filling factors for observations at 115 GHz and 230 GHz. Sharp inhomogeneities must then occur on the plane of the sky at angular scales at least comparable to our beam-size at 230 GHz, i.e. at ranges of order 10. This corresponds to spatial scales of 0.3 pc at a distance of 6 kpc. Such a small scale structure is commonly observed in CO maps of diffuse molecular clouds (see Sect. 4.1). Alternatively, the variety of values can be explained by somewhat unusual population of CO levels in the molecular medium, but this seems to be unlikely.
4.3 The two velocity components
The kinematical characteristics of the CO emission (see Table 2) indicates that the strong emission found in Off3 and Off7, together with the weak emission appearing in Off2, Off4, and in the star position, are all physically related. The emission features found at these positions appear at nearly the same velocity of 53.30.1 km s-1 (1). Moreover, the emission sampled in the CO (1– 0) data, is spatially continuous and forms one region elongated in the north-south direction. Thus, the emission lines can be interpreted as emerging from the same diffuse cloud. The central velocity of this molecular region is very close to the velocity of the SiO maser emission observed from the direction of V838 Mon (54 km s-1, Deguchi et al. 2005), which is often considered as the radial velocity of the star itself. If so, the emitting molecular matter seen in our data should reside very close to the star (see also Sect. 4.4).
The emission detected in the Off8 position is the only one centered at 48.5 km s-1. None of the spectra contains an emission component at intermediate velocities between 48.5 km s-1 and 53 km s-1, hence there is no transition zone between those two kinematic regions in the area of our measurements. This further indicates that the portions of gas emitting at the two distinct velocities are not physically connected and they form separate molecular complexes. Assuming standard rotation law of the Galaxy in the direction of V838 Mon, the gas at lower radial velocity should reside 1 kpc closer to the observer. The emission that appears at 48.5 km s-1 may be considered as emerging from a foreground molecular cloud with respect to the SiO maser, if one trusts in the kinematical distances.
4.4 Association with the light echo material?
The CO emission is located in the field of the light echo. The question that naturally arises is whether the molecular emission is physically connected with the light echo material. The issue is worthwhile to consider, especially in the context of discussion about the origin of the echoing dust (see Sect. 1).
To answer to the above question the relative location of the dust and the radiating molecules along the line of sight must be known. The distance to the echo material has been established by a geometric analysis of the echo evolution. As can be found in Bond (2007, see Fig. 3 therein), the reflecting regions seen in the echo should be located within several pc from the star, so their heliocentric distance should be about 6 kpc (Sparks et al. 2007). The distance to the CO-bearing gas can be only poorly constrained. Kinematical distance to the component at 53 km s-1, well correlated spatially with the echo on the plane of the sky, is 7 kpc, but due to streaming motions the real distance can be 1 kpc higher or lower. Thus, the association of the molecular gas with the dust cannot be ruled out.
The current understanding of V838 Mon seems to favor scenarios where the star is considered as a very young object. If so, it should exhibit systemic velocity very close to the velocity of the local interstellar medium. If the star has the same velocity as the SiO maser, then the local interstellar medium, including the light echo material, would have a velocity of 54 km s-1. As already noted in the preceding section, this value agrees very well with the velocity of most of the CO emission. It suggests that the dust and molecular gas are located in the same cloud. However, this suggestion should be treaded cautiously, since, in the case of V838 Mon, the maser can have different nature than in other SiO stellar sources (Deguchi et al. 2007), and consequently its radial velocity can be different than the real velocity of the star.
Furthermore, in the case of common origin of the dust and CO-bearing gas, one might expect that there is some overall correlation between the dust and CO distribution. Our data have still too low angular resolution and too poor coverage of the field to look for any meaningful correlations in the both distributions, but some general remarks can be made. As can be seen in Fig. 1, the CO emitting region extends basically along the north-south direction, similarly to the most prominent reflections seen in the light echo in the epoch close to the radio observations. The optical echo is however more extended in the east-west direction. One should remember that the echo on a single epoch image shows only a thin part of the whole dusty environment (e.g. Tylenda 2004), while the CO emission probes the total column density of the cloud along the line of sight. More appropriate would be, though, to compare the map of molecular emission with the optical pictures summed over the time of the observable evolution of the echo.
In summary, the current data do not allow us to conclusively verify whether the CO emission is associated with the light echo material, but they make such a possibility very probable. To verify the idea further, a direct measurement of the radial velocity of the echoing gas or more reliable constraints on the systemic velocity of V838 Mon are needed. A CO map with a good sampling and covering a region larger than the size of the light echo would be very helpful as well.
5 Concluding remarks
We present observations towards 13 positions in the field of the light echo of V838 Mon in the CO (1– 0) and (2–1) transitions. The measurements reveal an extended molecular region around the star at two distinct radial velocities. The CO emitting region is elongated in the north-south direction and exhibits a very complex distribution on the plane of the sky. We identify the CO lines as emerging from diffuse interstellar clouds. No molecular emission that can be associated with the star itself was detected.
The possible association of the molecular emission with the light echo material has been investigated. Although the CO emission appears in the field of the light echo, its detailed spatial distribution correlates only weakly with the light echo image. On the other hand, the velocity of the CO emission agrees very well with the velocity of the SiO maser discovered from the direction of V838 Mon, making the collocation of the dust and CO-bearing gas probable.
To more deeply investigate the origin of the molecular emission in the field of the echo, more extended map of the region in different molecular transitions is needed. A fully sampled map of the echoing region would be helpful to draw more conclusive statements about the suggested connection with the light echo material.
Acknowledgements.
The author thanks R. Tylenda and the anonymous referee for their useful comments and suggestions towards improving the paper. The author is also grateful to M. Pułecka for her help in obtaining the observations at the IRAM 30 m telescope. The research reported in this paper was supported from a grant no. N203 004 32/0448 financed by the Polish Ministry of Science and Higher Education.References
- Afşar & Bond (2007) Afşar, M., & Bond, H. E. 2007, AJ, 133, 387
- Banerjee et al. (2006) Banerjee, D. P. K., Su, K. Y. L., Misselt, K. A., & Ashok , N. M. 2006, ApJ, 644, L57
- Bloemen et al. (1986) Bloemen, J. B. G. M., Strong, A. W., Mayer-Hasselwander, H. A., et al. 1986, A&A, 154, 25
- Bond et al. (2003) Bond, H. E., Henden, A., Levay, Z. G., et al. 2003, Nature, 422, 405
- Bond (2007) Bond, H. E. 2007, in The Nature of V838 Mon and Its Light Echo, eds. R. L. M. Corradi & U. Munari, ASP Conf. Ser., 363, 130
- Crause et al. (2003) Crause, L. A., Lawson, W. A., Kilkenny, D., et al. 2003, MNRAS, 341, 785
- Crause et al. (2005) Crause, L. A., Lawson, W. A., Menzies, J. W., & Marang, F. 2005, MNRAS, 358, 1352
- Deguchi et al. (2005) Deguchi, S., Matsunaga, N., & Fukushi, H. 2005, PASJ, 57, 933
- Deguchi et al. (2007) Deguchi, S., Matsunaga, N., & Fukushi, H. 2007, in The Nature of V838 Mon and its Light Echo, eds. R. L. M. Corradi & U. Munari, ASP Conf. Ser., 363, 81
- van Dishoek et al. (1993) van Dishoek, E. F., Blake, G. A., Draine, B. T., & Lunine, J. I. 1993, in Protostars and Planets III, 163
- Evans et al. (2003) Evans, A., Geballe, T. R., Rushton, M. T., et al. 2003, MNRAS, 343, 1054
- Henden et al. (2002) Henden, A., Munari, U., & Schwartz, M. 2002, IAU Circ. 7859
- Kamiński et al. (2007a) Kamiński, T., Miller, M., Szczerba, R., & Tylenda, R. 2007, in The Nature of V838 Mon and its Light Echo, eds. R. L. M. Corradi & U. Munari, ASP Conf. Ser. 363, 103
- Kamiński et al. (2007b) Kamiński, T., Miller, M., Tylenda, R. 2007, A&A, 475, 569
- Kimeswenger et al. (2002) Kimeswenger, S., Lederle, C., Schmeja, S., & Armsdorfer, B. 2002, MNRAS, 336, L43
- Kipper et al. (2004) Kipper, T., Klochkova, V. G., Annuk, K., et al. 2004, A&A, 416, 1107
- Kutner & Ulich (1981) Kutner, M. L., Ulich, B. L. 1981, ApJ, 250, 341
- Lawlor (2005) Lawlor, T. M. 2005, MNRAS, 361, 695
- Liszt (2007) Liszt, H. S. 2007, A&A, 476, 291
- Lynch et al. (2004) Lynch, D. K., Rudy, R. J., Russel, R. W., et al. 2004, ApJ, 607, 460
- Munari et al. (2002) Munari, U., Henden, A., Kiyota, S., et al. 2002, A&A, 389, L51
- Munari & Henden (2005) Munari, U., & Henden, A. 2005, in Interacting Binaries: Accretion, Evolution, and Outcomes, AIP Conf. Proceedings, 797, 331
- Munari et al. (2007a) Munari, U., Corradi, R. L. M., Henden, A., et al. 2007, A&A, 474, 585
- Munari et al. (2007b) Munari, U., Navasardyan, H., & Villanova, S. 2007, in The Nature of V838 Mon and its Light Echo, eds. R. L. M. Corradi & U. Munari, ASP Conf. Ser., 363, 13
- Pavlenko et al. (2006) Pavlenko, Y. V., van Loon, J. Th., Evans, A., et al. 2006, A&A, 460, 245
- Retter & Marom (2003) Retter, A., & Marom, A. 2003, MNRAS, 345, L25
- Retter et al. (2006) Retter, A., Zhang, B., Siess, L., & Levinson, A. 2006, MNRAS, 370, 1573
- Soker & Tylenda (2003) Soker, N., & Tylenda, R. 2003, ApJ, 582, L105
- Soker & Tylenda (2007) Soker, N., & Tylenda, R. 2007, in The Nature of V838 Mon and its Light Echo, eds. R. L. M. Corradi & U. Munari, ASP Conf. Ser., 363, 280
- Sparks et al. (2007) Sparks, W. B., Bond, H. E., Cracraft, M., et al. 2007, ArXiv e-prints, 711, arXiv:0711.1495
- Teyssier et al. (2006) Teyssier, D., Hernandez, R., Bujarrabal, V., Yoshida, H., & Phillips, T. G. 2006, A&A, 450, 167
- Thum et al. (1995) Thum, C, Sievers, A., Navarro, S., Brunswig, W., Peñalver, J. 1995, IRAM Tech. Report 228/95.
- Tylenda (2004) Tylenda, R. 2004, A&A, 414, 223
- Tylenda (2005) Tylenda, R. 2005, A&A, 436, 1009
- Tylenda & Soker (2006) Tylenda, R., & Soker, N. 2006, A&A, 451, 223
- Tylenda et al. (2005) Tylenda, R., Soker, N., & Szczerba, R. 2005, A&A, 441, 1099
- Wisniewski et al. (2003) Wisniewski, J. P., Morrison, N. D., Bjorkman, K. S., et al. 2003, ApJ, 588, 486
Appendix A Presentation of all the spectra