Dynamical Mass of GJ 802B: a brown dwarf in a triple system
Abstract
We report a dynamical measurement of the mass of the brown dwarf GJ 802B using aperture-masking interferometry and astrometry. In addition, we report the discovery that GJ 802A is itself a close spectroscopic non-eclipsing binary with a 19 hour period. We find the mass of GJ 802 B to be M☉. GJ 802 has kinematics inconsistent with a young star and more consistent with the thick disk population, implying a system age of 10 GYr. However, model evolutionary tracks for GJ 802B predict system ages of 2 GYr, suggesting that brown dwarf evolutionary models may be underestimating luminosity for old brown dwarfs.
Subject headings:
stars: low-mass, brown dwarfs1. Introduction
The boundary between stars and brown dwarfs is defined as the mass at which the luminosity of old objects is just dominated by hydrogen burning. This boundary is predicted to occur at a mass between 0.07-0.072 at [Fe/H]=0 and 0.092 at [Fe/H]=-3 (Chabrier et al., 2000; Burrows et al., 2001).
However, this boundary, and the theoretical relationships that predict effective temperature and luminosity as a function of mass and age, are largely untested by observations. The observations that are required to test these models are dynamical mass measurements of binary and multiple-star systems, combined with accurate photometry and distance determinations, preferably at known age. Many stars between 0.1 and 0.2 now have accurate dynamical masses (Ségransan et al., 2000), but objects with masses between the hydrogen burning limit and 0.1 so far do not have accurate (%) mass and luminosity determinations.
Dependence on theoretical models has led to controversy about the mass of brown dwarfs, particularly when objects are plausibly near the canonical planetary-mass boundary of 13 Mjup (e.g. Luhman et al., 2007). In the few cases where the dynamical mass of a brown dwarf has been measured (Zapatero Osorio et al., 2004; Stassun et al., 2006), precision is either inadequate to truly constrain models, or the model fits have to make unusual assumptions such as non-coeval systems (Stassun et al., 2007).
GJ 802 is a M5 field dwarf system at 16 pc that was discovered to have a brown dwarf component through astrometry (Pravdo et al., 2005). The subsequent detection of the companion, GJ 802B, with aperture-masking interferometry (Lloyd et al., 2006) made this an ideal target for dynamical mass determination, due to the system’s 3 year period. The high contrast (100:1) and small separation ( mas) of GJ 802AB make this system too difficult for direct imaging observations, but is in an ideal range for interferometric detection.
This paper reports aperture-masking interferometry detections of GJ 802B at six epochs in three colors, enough to make good measurements of the orbit, and the discovery that GJ 802A is itself a close spectroscopic M dwarf binary. Section 2 describes the astrometric, interferometric, spectroscopic and photometric observations that go into the orbit determinations. Section 3 describes the orbit of the close binary GJ 802Aab and Section 4 describes the constraint on the dynamical mass of GJ 802B from the orbit of GJ 802AB. In Section 5 we compare our results to theoretical predictions and Section 6 has a summary and discussion.
2. Observations
The observations on which this paper is based consist of seeing-limited astrometry, aperture-masking interferometry, infrared and visible spectroscopy and photometry. The astrometry observations, in addition to parallax and proper motion, provide the orbit of the GJ 802Aab pair about the GJ 802AB center of mass. The aperture-masking interferometry constrains the wide binary orbit by resolving GJ 802B. The spectroscopy, in the infrared and visible, provides the spectroscopic GJ 802Aab orbit, and the photometry is used to search for eclipses of this inner pair. Each observation set will be discussed in turn.
2.1. Astrometry Observations
The astrometry observations in this paper come directly from Pravdo et al. (2005). These observations were part of the Stellar Planet Survey (STEPS) program, with observations made using a custom visible camera mounted at the unfolded Cassegrain focus of the Palomar 200 inch telescope. As the raw astrometry was not published in that paper and have not been made available to us, we extracted the astrometric data from the figures in the paper, and then added the motion due to the proper motion and parallax given in the paper’s table. These extracted values are presented in Table 1, and include all epochs where there are at least 2 measurements given in Pravdo et al. (2005). We give all of these epochs equal weight. The error estimated from the scatter within individual epochs is 1.6 mas, however we assume errors of 1.7 mas, to give a final fitted of 1.0 (see Section 4).
| Date (UT) | JD-2450000 | RA (mas) | Dec (mas) |
|---|---|---|---|
| 1998-07-06 | 1000.75 | 0.00 | 0.00 |
| 1999-07-20 | 1379.75 | 901.50 | 1806.99 |
| 1999-09-23 | 1444.75 | 1002.89 | 2092.99 |
| 2000-07-13 | 1738.75 | 1780.05 | 3510.93 |
| 2001-07-02 | 2092.75 | 2631.23 | 5150.19 |
| 2002-07-07 | 2462.75 | 3513.06 | 6908.15 |
| 2003-09-09 | 2891.75 | 4496.65 | 8932.57 |
| 2004-07-12 | 3198.75 | 5276.92 | 10367.24 |
| 2004-09-15 | 3263.75 | 5371.75 | 10654.40 |
2.2. Aperture-masking interferometry
The technique of non-redundant aperture masking has been well-established as a means of achieving the full diffraction limit of a single telescope (e.g. Michelson, 1920; Baldwin et al., 1986; Tuthill et al., 2000). It involves placing a mask with an array of holes of non-redundant spacing in the pupil-plane of a telescope, and analyzing the recorded images as interference fringes on a number of discrete baselines. Recently, our group has used this technique behind adaptive optics at the Palomar 200 inch and Keck telescopes to increase the magnitude limit of the technique beyond that achievable in a seeing-limited speckle mode. The reason for the technique’s success over direct adaptive-optics imaging is that the calibration is independent of structure of the wavefront over scales larger than a single sub-aperture, but it still preserves the angular resolution of the full aperture.
Aperture-masking observations of GJ 802 were made using both the PHARO camera of the Palomar 200 inch telescope (Hayward et al., 2001) and the NIRC2 camera of the Keck II telescope. The Palomar aperture-masking mode of the PHARO camera is described in Lloyd et al. (2006). The NIRC2 aperture-masking mode is similar, although the masks are placed in the filter wheels of the NIRC2 camera rather than a designated pupil wheel as is the case with PHARO. The masks create fringe patterns in the image-plane of each detector. Our primary observable, closure-phase, is extracted from these fringe patterns and models are fit to the closure phases. A summary of all aperture-masking observations, along with the detected binary properties, are given in Table 2.
For the NIRC2 and PHARO aperture-masking experiments, both 9 and 18 hole masks are available. The 9 hole mask results in 36 simultaneous baselines and 28 independent closure-phases. The 18 hole mask results in 153 simultaneous baselines and 136 independent closure-phases, but has half the throughput of the 9 hole mask and spreads the light over 4 times as many pixels as the 9 hole mask.
All observations were done with a 9 hole mask in H and K bands, except the June 2007 Jcont observation for which a 18 hole mask was used. In the absence of sky rotation, the field-of-view of the aperture-masking experiment is given by , where is the shortest baseline in the mask. Outside this field-of-view, the position angle and separation become ambiguous without multiple exposures at different sky rotations. Although the 9 hole mask was well suited to H and K observations at both Keck and Palomar, the 73 mas separation of GJ 802B would have been outside the nominal 9 hole mask field of view in J band.
In a similar manner, the aperture masking inner working angle is given by /2BL, where BL is the longest baseline (near to the full aperture size). At this separation, the maximum closure phase signal is equal to the contrast ratio of the binary (i.e. 0.01 radians or 0.6 degrees for a 100:1 binary). In the case of the PHARO observations of June 2004 and October 2006, these nominal inner detection limits are 43 and 57 mas respectively. Near this inner edge, the contrast ratio and separation for model-fitting are degenerate. Despite their large errors on separation, these detections are therefore reliable. We explicitly list the correlations between separation and contrast in Table 2.
We have made several improvements to the analysis pipeline and observing procedure since the original detection published in Lloyd et al. (2006). The most important improvement has been in the observations themselves: we have generally been much more careful in using calibrators of similar brightness, colors and position in the sky. This procedure was not used carefully for the discovery epoch of September 2004, and we find that the astrometry depends on which of several unsuitable calibrators are used in the analysis. Therefore, we choose not to use this epoch in our analysis here, and it is not presented in Table 2.
We have windowed the data prior to Fourier-transforming with a tighter function than previous publications to minimize residual chip-based effects (e.g. of bad pixels). The window size is of the form exp with a full-width half-maximum of , where is our aperture-mask hole diameter projected onto the primary mirror. This tighter window also has the effect of spatially-filtering the interferometric data. The raw frames from the PHARO camera are taken in a mode where all (non-destructive) reads are saved. This allows us to split the data in post-processing into a variety of integration times, where smaller integration times have less atmospheric and AO system noise but more readout noise. We now carefully choose an optimal number of sub-reads to analyze data of a given brightness: for GJ 802 we split the data into sub-frames spaced by 2 reads, which have integration times of 862 ms each.
| Date (UT) | JD-2450000 | Instrument | Filter | Separation | Position Angle | ContrastaaDifference in apparent H-band magnitudes as derived from the fit of two shifted GJ 777B spectra. See text. | Sep./Contrast |
|---|---|---|---|---|---|---|---|
| (mas) | (degrees) | (B/A) | correlation | ||||
| 2004-06-06 | 53163.0 | PHARO | H | 55.1 21.4 | 16.4 6.8 | 0.0130.006 | 0.87 |
| 2006-06-23 | 53910.0 | NIRC2 | Ks | 85.8 3.5 | 200.9 2.2 | 0.0150.003 | 0.09 |
| 2006-10-10 | 54018.7 | PHARO | H | 94.6 9.7 | 207.6 7.4 | 0.0090.003 | -0.13 |
| 2006-10-10 | 54018.7 | PHARO | Ks | 81.1 24.5 | 196.7 4.9 | 0.0110.003 | 0.75 |
| 2007-05-31 | 54252.0 | PHARO | CH4S | 77.4 10.3 | 24.1 5.2 | 0.0090.002 | -0.26 |
| 2007-06-05 | 54257.0 | NIRC2 | Jcont | 73.3 2.9 | 21.5 2.1 | 0.0080.002 | 0.04 |
| 2007-06-06 | 54258.0 | NIRC2 | Kp | 72.6 1.7 | 19.2 1.2 | 0.0100.001 | 0.01 |
| 2007-07-31 | 54312.9 | PHARO | H | 86.2 5.8 | 24.0 3.5 | 0.0100.002 | -0.40 |
| 2007-08-29 | 54341.8 | PHARO | H | 85.4 6.0 | 20.2 3.2 | 0.0110.002 | -0.44 |
2.3. Infrared Spectroscopy
The NIRC2 camera at the Keck II telescope was used on UT 2006-08-10 in a spectroscopic mode for the purpose of attempting to detect the spectrum of GJ 802B directly. The observations were made in the H-band with a bandpass from 1.52 to 1.62 microns. We used a grism with a resolving power of 17580 per pixel and a 4 pixel wide slit, giving a spectral resolution of 4000. These observations did not succeed in their primary purpose, mainly because poor seeing forced us to use H instead of J-band, where the spectral differences between a mid-L and mid-M dwarf were not large enough to give a clearly detectable GJ 802 B signal in the data.
It was noticed, however, that lines in the spectra of GJ 802 were double. To calibrate the spectra, we first used Xe and Ar lamps to calibrate the wavelength scale, which was fitted with a second-order polynomial. We calculated the model atmospheric and grism transmission by taking spectra of the F8V star HD 136118 and dividing by a template spectrum of HR 4375 (a G0V star) from Meyer et al. (1998). In reducing these spectra to their two components, GJ 777B was used as the spectral-type standard and the radial velocity standard, as its wide companion GJ 777A has a precise radial velocity of -45.3500.004 km s-1 (Naef et al., 2003), and should be within 1 km s-1 from GJ 777B’s radial velocity due to potential orbital motion. As a check of our calibration procedure, we used Xe and Ar lamp calibration of the NIRC2 grism wavelength scale to measure the radial velocity of GJ 777B based on two Al I and one Ca I lines to be km s-1, consistent with GJ 777A’s radial velocity.
Least square fits were made to the continuum subtracted spectra of GJ 802, based on a model made up of the sum of two shifted GJ 777B spectra. We chose this technique rather than a cross-correlation because the two spectra were not separated well enough to give clearly separate peaks in the cross-correlation. The errors in the velocity difference come straight from the least-squares fitting process, where the uncertainty in the GJ 802 spectrum was set to 1.3% of the mean flux so that the model fit had a reduced of 1. An uncertainty on the velocity difference based on deviations from a linear fit to the measured velocities would be 2.5 km s-1. The results of this fitting process are given in Table 3. The magnitude difference in -band derived from the fit is zero within errors, which suggests that the components have nearly equal masses.
It is difficult to estimate the uncertainties on the absolute velocity calibration (not the primary purpose of our observations), so we assign an error of 5 km s-1 based on the absolute calibration of GJ 777B’s radial velocity against the Xe and Ar lamps. There is good reason to expect that the absolute calibration of these observations is significantly worse than the relative calibration between the Aa and Ab spectra, because the point spread function delivered by the AO system was not guaranteed to be well-centered on the slit. However, as both stars had the same point spread function, with their maximum possible spatial separation of 0.7 mas corresponding to 1 km s-1, the relative calibration between Aa and Ab spectra should be good compared with the 2 km s-1 statistical error in the velocity difference.
| JD- 2450000 | RVAb | RVAa | RV | HAa-HAbaaDifference in apparent H-band magnitudes as derived from the fit of two shifted GJ 777B spectra. See text. |
|---|---|---|---|---|
| 3956.9219 | -6.95.0 | -93.55.0 | -86.62.0 | 0.150.06 |
| 3956.9336 | -13.25.0 | -86.15.0 | -72.92.0 | 0.190.06 |
| 3956.9375 | -12.95.0 | -83.75.0 | -70.92.0 | 0.240.06 |
| 3956.9453 | -16.35.0 | -83.65.0 | -67.32.0 | -0.030.07 |
2.4. High-Resolution Optical Spectroscopy
We obtained multi-epoch spectra of GJ 802 using the East-Arm Echelle (EAE) on the Palomar Hale 5m telescope. The EAE is a high-resolution spectrograph, capable of achieving spectral resolution of . Most of our observations span a wavelength range of 4000-10000 , but the observations taken in December 2006 (before official commissioning) span a significantly bluer range (3500-8000 ). Most of our spectra were binned in the spectral direction in order to reduce read noise, so the effective resolution for our observations was 20000. Since GJ 802 is very red, none of our spectra have any useable signal short-ward of 5500 .
We observed GJ 802 at four epochs on 2006 December 15 and six more epochs spanning 2007 May 06-08. We also observed the late-type stars GJ 51 (in December) and GJ 581, GJ 686, and GJ 699 (in May) as spectral type standards. All observations of GJ 802 used integration times of 300-900s, while our standard star observations used a wider range of integration times since some were significantly brighter.
We bias-subtracted, flat-fielded, and extracted our spectra using standard IRAF tasks. Wavelength calibration was achieved with respect to a Thorium-Argon lamp that was observed at the beginning of each night; preliminary tests suggest that telescope flexure results in wavelength calibration variations of no more than 0.015 (0.5 km s-1) in the vicinity of the H emission line at 6563 A. In Figure 1, we show a representative segments of several spectra for GJ 802 around the wavelength range. These spectra demonstrate the double-lined nature of GJ 802; this plot also shows that the H emission line strengths are not constant, but vary on a time-scale of days.
All of our science spectra exhibit H emission, so we have directly determined the component radial velocities from the line centroids. For epochs where the lines were not clearly resolved, we fit the spectra with a pair of Gaussian emission lines with the same FWHM as the resolved measurements. We list all of these radial velocities, including heliocentric corrections, in Table 4; we also list our observed radial velocity standards in Table 5. The mean radial velocity of the standards was km s-1 higher than the radial velocities derived from the Thorium-Argon lamp calibration, with a dispersion of 1.7 km s-1 (standard error on the mean 0.5 km s-1). We have subtracted this offset from all radial velocities reported in Table 5 and Table 4.
We did not use any cross-correlation techniques to determine overall RV fits because we are still attempting to characterize the wavelength and flux calibrations of the instrument, including limits on potential variability; given the long time baseline of our dataset, any improvement in the precision would yield only very minor improvements in the orbital ephemerides.
| JD - 2450000 | RVAb | RVAa | RV |
|---|---|---|---|
| 4084.57847 | -107.7 5.0 | 10.2 5.0 | -117.9 2.8 |
| 4084.59097 | -111.8 5.0 | 15.7 5.0 | -127.5 2.8 |
| 4084.60347 | -118.2 5.0 | 18.0 5.0 | -136.2 2.8 |
| 4084.70625 | -116.9 6.0 | 19.4 6.0 | -136.3 4.2 |
| 4084.71389 | -118.7 6.0 | 18.5 6.0 | -137.2 4.2 |
| 4084.72014 | -113.2 7.0 | 16.6 7.0 | -129.8 7.1 |
| 4226.94971 | -102.3 2.0 | 23.2 2.0 | -125.5 2.8 |
| 4227.90039 | -99.3 2.0 | 17.9 2.0 | -117.2 2.8 |
| 4228.84473 | -21.4 2.0 | -59.8 2.0 | 38.4 2.8 |
| 4228.90332 | 9.7 2.0 | -86.7 2.0 | 96.4 2.8 |
| Star | JD - 2450000 | RV | Literature RV |
|---|---|---|---|
| GJ 51 | 4084.66134 | -10.93 | -7.7aaGizis et al. (2002) |
| GJ 393 | 4226.70127 | +4.63 | +8.3bbNidever et al. (2002) |
| GJ 476 | 4226.75556 | +29.63 | +31.6aaGizis et al. (2002) |
| GJ 686 | 4226.83443 | -11.43 | -9.5bbNidever et al. (2002) |
| GJ 476 | 4227.73785 | +30.63 | +31.6aaGizis et al. (2002) |
| GJ 514 | 4227.74175 | +11.23 | 14.6bbNidever et al. (2002) |
| GJ 526 | 4227.74530 | +13.03 | 16.0aaGizis et al. (2002) |
| GJ 581 | 4227.74907 | -13.83 | -9.4bbNidever et al. (2002) |
| GJ 393 | 4228.63097 | +4.93 | +8.3bbNidever et al. (2002) |
| GJ 387.2 | 4228.64279 | -16.83 | -16.5aaGizis et al. (2002) |
| GJ 699 | 4228.82439 | -116.93 | -110.5bbNidever et al. (2002) |

2.5. Photometry
Given that the GJ 802Aab binary had such a short period, and preliminary analysis of the orbit suggested that inclination was possibly high, we used the Palomar 60-inch robotic telescope to search for eclipses. The Palomar 60-inch telescope has a single instrument, a CCD imager with an 1111 arc-minute field-of view and a selection of broad and narrow-band filters. We took series of images in , and H- filters around the predicted times of eclipses based on the radial-velocity orbit (when the velocity difference was zero). The H- filter was used to search for an eclipse of the chromospheric emission.
The observations in and filters spanned 30 minutes on either side of a predicted eclipse at Julian day 2454311.889, and the observations in H- spanned 30 minutes on either side of a predicted eclipse at Julian day 2454315.870. These eclipse times were based on a preliminary orbital fit (see Section 3). As the radial velocity amplitudes of Aa and Ab were roughly equal (see the velocities in Table 4), we can assume that the masses are roughly equal and that the primary and secondary eclipses would have roughly equal depths.
We computed aperture photometry for GJ 802 on the calibrated images, using the median photometric variation of 10 nearby field stars to compute the sky transmission in each frame. No eclipses were found in any filters. For the and filters, the RMS photometry scatter was 0.01 and 0.003 mag respectively with sampling at 1.5 minute intervals. For the H- filter, the scatter was 0.01 mag, and the sampling at 1 minute intervals. The excess in our filter due to the H- emission was 22.7% of the continuum, calculated by comparison with photometry from an off-line narrow-band filter and consistent with our spectroscopic observations. From these data we can place 2 upper limits for a continuum eclipse depth of 0.005 mag and for a H- eclipse depth of 0.01 mag.
3. Orbit of the close pair GJ 802A
We chose to fit the radial velocities of GJ 802Aab with a circular orbit only, because the 19 hour period of the system is 10 times shorter than the canonical cutoff of 7 days for tidal circularization in low-mass main-sequence stars (Zahn & Bouchet, 1989). Figure 2 shows the best fit equal-mass circular orbit with the measured radial velocities, and Figure 3 shows the best fit circular orbit with the measured radial velocity differences. We made this fit by first examining by eye the 2007 May radial velocities, concluding that the orbital semi amplitude was between 135 and 155 km s-1, with a period of approximately 0.8 days. We then fit to the absolute value of the velocity difference by using a grid search. We searched the range of 0.7 to 0.9 days with days spacing for period, the full range of epoch (modulo half a period) with days spacing, and total velocity amplitudes of the two components , between 135 and 155 km s-1 with 4 km s-1 spacing. The reduced for the final fit is 0.70 with 11 degrees of freedom. No other (aliased) minima have reduced values less than 6. We assigned signs to the radial velocity differences only after finding this fit, as GJ 802Aab is so close to equal brightness that it was difficult to tell which spectrum was GJ 802Aa and which was GJ 802Ab.
Best fit orbital parameters are given in Table 6. It is not clear from these observations which component is the more massive, as the mass ratio is . This ambiguity is seen in Figure 2. The mass ratio and center of mass radial velocity are constrained best by the May 2007 observations, which are best calibrated and where the two spectra swap their positions, and the absolute calibration of the radial velocities is most certain. These data have significantly smaller errors in Figure 2 and are at phase 0.03, 0.1, 0.65 and 0.85. Including a 3 km s-1 uncertainty for the orbital motion of GJ 802Aab with respect to the GJ 802AB center of mass, we obtain a radial velocity for the system of -424 km s-1.
| Parameter | Value |
|---|---|
| Epoch (HJD) | 2454140.5300.001 |
| Period (d) | 0.7953400.000003 |
| K1 + K2 | 149.11.5 km s-1 |
| K1 | 73.81.4 km s-1 |
| K2 | 75.41.4 km s-1 |
| (MAa+MAb)sin3i | 0.2730.008 M☉ |
| a sin(i) | 2.3430.024 R☉ |
| Inclination | 77i83 |


The inclination limit in Table 6 comes from the following analysis of both the lack of eclipses and a model-dependent mass estimate for the system. Based on a stellar radius of 0.16 , predicted by the models of Baraffe et al. (1998) for components of mass 0.14 M☉ (applicable to an edge-on system with equal-mass components and (MAa+MAb)sin3i from Table 6), the eclipse would have lasted a maximum of 50 minutes. For a grazing eclipse with 5.8% of one star eclipsed, the eclipse would have lasted 25 minutes: well within our 60 minute observing window (Section 2.5). A grazing eclipse occurs at a projected separation of twice the stellar radius, or 0.32 . As no eclipse occulting even 1% of the surface of one of the stars was found in any filter (Section 2.5), the inclination of GJ 802Aab is limited to degrees. Given that (MAa+MAb)sin3i = 0.2730.008, this in turn limits the total mass of GJ 802A to .
The models of Baraffe et al. (1998) have been verified to predict the K-band mass-luminosity relationship for field dwarfs correctly to within 5% in mass for dwarfs of mass greater than 0.1 (Delfosse et al., 2004). For stars of mass 0.11-0.18 , this relationship is independent of age at the 1% level for ages between 0.5 and 10 Gyr. This age range is applicable to the likely GJ 802 age of 6 Gyr, based on its activity (Pravdo et al., 2005) and kinematics (Section 5). This relationship is also relatively steep: at a mass of 0.13 M, a 6% error in K-band flux from the distance of Pravdo et al. (2005) translates to only a 2.5% error in mass. Therefore, the uncertainty in the mass is likely dominated by the K-band mass-luminosity relationship (at least until the models are tested at higher precision), and we assign a standard deviation of 5% to the model-predicted mass. These models predict masses for GJ 802Aa and GJ 802Ab of 0.134 , using a parallax of 63 mas Pravdo et al. (2005) and 2MASS photometry. In turn, this places a maximum-mass constraint on GJ 802Aab at of 0.295 M☉, limiting the inclination of GJ 802Aab to between 77 and 83 degrees. Note that the -band luminosity - mass relationship is little affected by metallicity, changing by % if we were to use the models of Montalbán et al. (2000) at [Fe/H]=-1.
4. Dynamical mass of GJ 802B
The full solution for the GJ 802AB orbit requires 16 parameters: 5 for parallax and proper motion, 7 for the orbital solution of B with respect to Aab, 1 for the photo-center semi-major axis, and 3 for the contrast of B with respect to Aab in J, H and K bands. The reason that contrast had to be added in to the orbital solution was that many of the parameters in Table 2 had strong degeneracies. To fully explore this large parameters space around the best-fit solution, we used a Markov Chain Monte Carlo technique (e.g. Brémaud, 1999), a method that has often been used in astronomy for cosmological parameter estimation (e.g. Knox et al., 2001). Key advantages of this technique are the ability to easily include the covariance matrix of the data (in our case the aperture-masking fits), and the ability to easily calculate the posterior probability function of derived parameters, such as the mass of GJ 802B.
The probability that a particular set of parameters is contained in the final chain is proportional to the likelihood function, which is proportional to . Due to the correlations between derived parameters from aperture-masking, is not just the sum of normalized deviates, but makes use of the covariance matrix of the data:
| (1) |
Here is the vector of data values, is the model for these data based on parameters , is the data covariance matrix and t represents a transpose. Covariances between different epochs were assumed to be zero: only the derived separation, position angle and contrast for a single epoch of aperture-masking data had non-zero covariances.
We used a Markov Chain of length , with a burn-in time. The best orbital solution had a reduced of 1.0 because we chose the error in the STEPS data to be 1.7 mas in each axis. As in Pravdo et al. (2005), we used a mas conversion from relative to absolute parallax.
We first conducted an exploratory unconstrained fit to the data, but found that the errors on parallax and orbital semi-major axis were too large to give a useful total mass. This fit with single parameter 1 confidence limits is given in the first column of Table 7, and has a mass for GJ 802Aab that is too high by 1.1 from the mass derived from the absolute magnitude of GJ 802Aab. Therefore, we fixed fixed the masses of GJ 802Aa and GJ 802Ab to be 0.134 , based on their absolute -magnitudes and the models of Baraffe et al. (1998) (see Section 3). Note that the same value of parallax of 63 mas was used in both Section 3 and here in calculating the K-band absolute magnitude. This fit is given in the central column of Table 7.
Finally, we note that we can not really “fix” the mass of GJ 802A as it has an uncertainty. We therefore calculated an apriori constraint on the mass of GJ 802Aab using the following: the mass-K magnitude relationship with its assumed 5% RMS error (see Section 3); the value of sin from Table 6; and an orbital orientation assumed random with degrees. Together, these constraints give a mass of for the mass of GJ 802Aab. The assumed likelihood curve resulting from these two constraints is given in Figure 4: it can be seen that a Gaussian likelihood curve is a good approximation for our prior knowledge of . The knowledge of this mass was added to the Markov-Chain Monte Carlo as an apriori constraint to give our preferred values in the final column of Table 8. The final GJ 802B mass of 0.0630.005 is the most accurate mid-late L-dwarf mass reported in the literature so far.
Although the Markov-Chain Monte Carlo technique is an excellent technique for accurately calculating posterior probability distributions of derived parameters, it can be difficult to intuitively understand the magnitude of derived uncertainties from the chain output. Therefore, we will examine the origin of the 8% uncertainty on the GJ 802B mass individually. The mass of the component directly relates to the mass of the components by the ratio of astrometric and orbital semi-major axes and (e.g McCarthy et al., 1988):
| (2) |
Therefore, a 4% uncertainty on the mass , a 6% uncertainty on and a 2% uncertainty on combine to give a 8% uncertainty on . Although in the constrained fit, the value and uncertainty for is influenced by the constraint, this argument for the value and uncertainty of changes little if the values for and from the unconstrained fit are used.

The apparent photometry corresponding to this preferred fit is given in Table 8. The apparent photometry for the system’s combined light comes from Simbad and 2MASS (Cutri et al., 2003). The derived absolute photometry corresponding to individual components of the system (apportioning equal flux to the two components Aa and Ab) is also given in this table. This photometry corresponds to a spectral-type of L5-L7 for GJ 802B (Knapp et al., 2004).
| Parameter | Unconstrained Fit | Fixed MA | Constrained MA |
|---|---|---|---|
| Proper Motion (RA) | 877.71.0 mas yr-1 | 877.71.0 mas yr-1 | 877.71.0 mas yr-1 |
| Proper Motion (Dec) | 1722.110.34 mas yr-1 | 1722.21.0 mas yr-1 | 1722.11.0 mas yr-1 |
| Parallax | 62.21.8 mas | 63.91.3 mas | 63.51.3 mas |
| Orbital semi-major axis () | 97.55.0 mas | 92.42.0 mas | 92.92.1 mas |
| Photocenter semi-major axis () | 17.41.2 mas | 17.20.9 mas | 17.21.0 mas |
| Epoch (JD) | 245304014 | 245302815 | 245303113 |
| Period | 1105 9 d | 1105 9 d | 1104 9 d |
| Eccentricity | 0.400.08 | 0.350.05 | 0.350.05 |
| Argument of periapse | 90.4 4.3 | 89.0 5.5 | 89.6 4.8 |
| Longitude of ascending node | 21.8 1.4 | 22.7 1.4 | 22.0 1.3 |
| Inclination | 83.7 3.0 | 81.1 3.1 | 82.7 3.0 |
| Total Mass | 0.4260.078M☉ | 0.3290.004M☉ | 0.3430.012M☉ |
| Mass of GJ 802Aab | 0.3510.066M☉ | 0.268aaFixed from a mass - K magnitude relationship (see text). | 0.280bbMass with error-bars included as apriori information in the Monte-Carlo fits.0.010M☉ |
| Mass of GJ 802B | 0.0760.013M☉ | 0.0610.004M☉ | 0.0630.005M☉ |
| Band | mA | mB | MAa(=MAb) | MB |
|---|---|---|---|---|
| Vaa GJ 802B is assumed to have negligible contribution to V-band. | 14.67 | - | 14.47 | - |
| J | 9.570.02 | 14.750.27 | 9.340.05 | 13.740.28 |
| H | 9.070.02 | 14.130.09 | 8.830.05 | 13.140.10 |
| K | 8.760.01 | 13.610.08 | 8.530.05 | 12.620.08 |
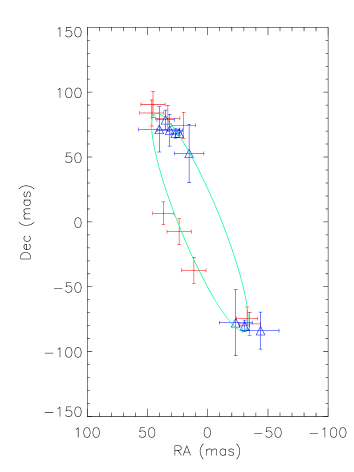
The orbital fit for GJ 802AB is shown in Figure 5, with the photo-center astrometry measurements scaled by the ratio of total mass to GJ 802B mass, and with parallax and proper motion removed so that all points can be plotted at the same scale. This plot also aids in developing an intuitive feel for our quoted mass error. The error in the ratio between the mass of GJ 802B and the total mass is the ratio of the photo-center and orbital semi-major axes (similar to Equation 2): which we claim has a 7% error.
5. Comparison with models
As discussed in (Pravdo et al., 2005), the activity of GJ 802 (e.g. Figure 1), imply that the system is 6 Gyr old. The kinematics of GJ 802 also imply that the system is old. The total proper motion of nearly 2 arcseconds per year is 30 times the parallax, meaning that the tangential velocity of GJ 802 is 30 AU per year, which is 140 km s-1. Based on the astrometric fit reported in Table 7 and the mean radial velocity from Tables 3 and 4, we have calculated the space motion of GJ 802 using the gal_uvw routine from the IDL Astronomy User’s Library111http://idlastro.gsfc.nasa.gov/. This routine is in turn based on the mathematics in Johnson & Soderblom (1987). The space motion calculated to be km s-1, which is km s-1 with respect to the local standard of rest. The lag in and very high space velocity is quite inconsistent with the thin-disk population. For example, the HIPPARCOS sample of nearby early M stars has a dispersion of 32 km/s, and the sample earlier than spectral-type F5, representative of a 1 GYr old population, has a dispersion of only 22 km s-1 (Mignard, 2000). The 39 km s-1 lag of GJ 802 is unusually small for a Population II halo star, but is consistent with the thick disk (Casertano et al., 1990). GJ 802 is very unlikely to be a runaway star that is confused with the thick disk population, because any dynamical interaction capable of giving it a km s-1 peculiar velocity would also break the wide binary GJ 802AB apart. Therefore, these kinematic properties place GJ 802 at an age of 10 GYr, and almost certainly older than 3 GYr (Bensby et al., 2003).
We can compare these ages to the ages derived from the modelling of GJ 802B. Figure 6 shows the absolute magnitudes of GJ 802B compared to the DUSTY models of Baraffe et al. (2002). The colors of these models are clearly too red, a well known property of these models for objects that are of mid-L or later spectral type (Baraffe et al., 2003). The predicted age is between 1 and 5 GYr in age in all bands. We chose not to plot the results from the COND models from the same group (Baraffe et al., 2003) because these models are much too blue and really only applicable to T dwarfs.

Although these models clearly do not represent GJ 802B, mostly due to difficulties in opacity treatment and dust in brown dwarf atmospheres, it is expected that luminosity and effective temperature are a much more certain prediction of brown dwarf evolutionary models than fluxes in specific bands (Burrows & Liebert, 1993; Chabrier et al., 2000). A better comparison for the GJ 802B photometry is therefore possible with the models of Burrows et al. (2006) that correctly model the basic colors of L dwarfs and the L to T transition.
At log()=5.2 (appropriate for a 0.06 brown dwarf), the best fitting model from Burrows et al. (2006) has absolute magnitudes , and . This model has K with a total luminosity of L☉. This model Luminosity and temperature can now be compared with evolutionary models, placing a 0.063 GJ 802B at 1.9 GYr according to the Burrows et al. (1997) track. GJ 802B would only be consistent with an old (i.e. 5 GYr) object if its mass were 0.07 , which is inconsistent with our dynamical mass at .
6. Conclusions and Discussion
GJ 802 is a triple system with component masses of 0.14, 0.14 and 0.063 . The inner pair of equal-mass stars, GJ 802Aab, has an orbital period of 0.795 days and an inclination between 74 and 83 degrees. The outer component, GJ 802B, has a 3 year orbit and a mass of M☉. The inclination of the GJ 802B orbit, 83 degrees, is consistent with co-planarity. The most promising way to decrease the mass uncertainty would be to obtain an accurate radial velocity curve of the 3 year orbit, with an expected amplitude of 3 km/s.
The brown dwarf “desert” is generally defined as a lack of low-mass companions around solar-type stars, but a similar lack of very unequal mass-ratio companions has been found around very low-mass stars (Close et al., 2003). However, as a triple system, GJ 802 no longer fits in this category. In fact, there are a large number of brown dwarfs known in triple or higher order multiple systems. This entirely consistent with dynamical star-formation simulations (Delgado-Donate et al., 2004), but may also relate to the details of the fragmentation process as a cloud with relatively high angular momentum collapses. Measuring the mutual inclination (i.e. degree of co-planarity) of this and other low-mass triples with long-baseline interferometry could help to determine the mechanism responsible for producing triples like GJ 802.
The kinematics of GJ 802B place it in the thick disk, at an age of 10 GYr, while the model-derived age for GJ 802B is 2 GYr. Although this discrepancy is only significant at the 93% confidence level so far (1.5), we will list several possibilities for reconciling the discrepancy: 1) GJ 802Aab could actually have a total mass of 0.30 , consistent with the astrometry, but be underluminous by % in K-band compared to field stars. GJ 802B would then be placed right on the substellar boundary at 0.07 , a naively unlikely position given the very small sample of astrometric STEPS binaries from which GJ 802 was taken (Pravdo et al., 2005). 2) GJ 802Aab could have an apparent total mass of 0.30 because of an additional low-mass component in a day, just stable orbit. This could also increase our dynamical mass of GJ 802B to 0.07 . 3) GJ 802 could actually be 2 GYr old but have experienced a unique dynamical past that gave it a high space velocity without tearing the wide binary apart. Or, 4) models for old brown dwarfs are systematically under-predicting luminosities. These model errors could relate to, e.g. the effects of magnetic fields that can hinder heat flow in brown dwarfs (Chabrier et al., 2007). Given that GJ 802B is currently the only Gyr or older brown dwarf with an accurate dynamical mass, we find this fourth possibility most likely: a hypothesis that will be testable within the next few years as more field brown dwarfs have accurate mass determinations.
References
- Baldwin et al. (1986) Baldwin, J. E., Haniff, C. A., Mackay, C. D., & Warner, P. J. 1986, Nature, 320, 595
- Baraffe et al. (1998) Baraffe, I., Chabrier, G., Allard, F., & Hauschildt, P. H. 1998, A&A, 337, 403
- Baraffe et al. (2002) —. 2002, A&A, 382, 563
- Baraffe et al. (2003) Baraffe, I., Chabrier, G., Barman, T. S., Allard, F., & Hauschildt, P. H. 2003, A&A, 402, 701
- Bensby et al. (2003) Bensby, T., Feltzing, S., & Lundström, I. 2003, A&A, 410, 527
- Brémaud (1999) Brémaud, P. 1999, Markov Chains: Gibbs Fields, Monte Carlo Simulation, and Queues (Springer Science+Buisiness Media, Inc.), 290–332
- Burrows et al. (2001) Burrows, A., Hubbard, W. B., Lunine, J. I., & Liebert, J. 2001, Reviews of Modern Physics, 73, 719
- Burrows & Liebert (1993) Burrows, A., & Liebert, J. 1993, Reviews of Modern Physics, 65, 301
- Burrows et al. (1997) Burrows, A. et al, 1997, ApJ, 491, 856
- Burrows et al. (2006) Burrows, A., Sudarsky, D., & Hubeny, I. 2006, ApJ, 640, 1063
- Casertano et al. (1990) Casertano, S., Ratnatunga, K. U., & Bahcall, J. N. 1990, ApJ, 357, 435
- Chabrier et al. (2000) Chabrier, G., Baraffe, I., Allard, F., & Hauschildt, P. 2000, ApJ, 542, 464
- Chabrier et al. (2007) Chabrier, G., Gallardo, J., & Baraffe, I. 2007, A&A, 472, L17
- Close et al. (2003) Close, L. M., Siegler, N., Freed, M., & Biller, B. 2003, ApJ, 587, 407
- Cutri et al. (2003) Cutri, R. M. et al, 2003, 2MASS All Sky Catalog of point sources. (The IRSA 2MASS All-Sky Point Source Catalog, NASA/IPAC Infrared Science Archive. http://irsa.ipac.caltech.edu/applications/Gator/)
- Delfosse et al. (2004) Delfosse, X., 2004, in Astronomical Society of the Pacific Conference Series, Vol. 318, Spectroscopically and Spatially Resolving the Components of the Close Binary Stars, ed. R. W. Hilditch, H. Hensberge, & K. Pavlovski, 166–174
- Delgado-Donate et al. (2004) Delgado-Donate, E. J., Clarke, C. J., Bate, M. R., & Hodgkin, S. T. 2004, MNRAS, 351, 617
- Gizis et al. (2002) Gizis, J. E., Reid, I. N., & Hawley, S. L. 2002, AJ, 123, 3356
- Hayward et al. (2001) Hayward, T. L., Brandl, B., Pirger, B., Blacken, C., Gull, G. E., Schoenwald, J., & Houck, J. R. 2001, PASP, 113, 105
- Johnson & Soderblom (1987) Johnson, D. R. H., & Soderblom, D. R. 1987, AJ, 93, 864
- Knapp et al. (2004) Knapp, G. R. et al, 2004, AJ, 127, 3553
- Knox et al. (2001) Knox, L., Christensen, N., & Skordis, C. 2001, ApJ, 563, L95
- Lloyd et al. (2006) Lloyd, J. P., Martinache, F., Ireland, M. J., Monnier, J. D., Pravdo, S. H., Shaklan, S. B., & Tuthill, P. G. 2006, ApJ, 650, L131
- Luhman et al. (2007) Luhman, K. L., Allers, K. N., Jaffe, D. T., Cushing, M. C., Williams, K. A., Slesnick, C. L., & Vacca, W. D. 2007, ApJ, 659, 1629
- McCarthy et al. (1988) McCarthy, Jr., D. W., Henry, T. J., Fleming, T. A., Saffer, R. A., Liebert, J., & Christou, J. C. 1988, ApJ, 333, 943
- Meyer et al. (1998) Meyer, M. R., Edwards, S., Hinkle, K. H., & Strom, S. E. 1998, ApJ, 508, 397
- Michelson (1920) Michelson, A. A. 1920, ApJ, 51, 257
- Mignard (2000) Mignard, F. 2000, A&A, 354, 522
- Montalbán et al. (2000) Montalbán, J., D’Antona, F., & Mazzitelli, I. 2000, A&A, 360, 935
- Naef et al. (2003) Naef, D. et al, 2003, A&A, 410, 1051
- Nidever et al. (2002) Nidever, D. L., Marcy, G. W., Butler, R. P., Fischer, D. A., & Vogt, S. S. 2002, ApJS, 141, 503
- Pravdo et al. (2005) Pravdo, S. H., Shaklan, S. B., & Lloyd, J. 2005, ApJ, 630, 528
- Ségransan et al. (2000) Ségransan, D., Delfosse, X., Forveille, T., Beuzit, J.-L., Udry, S., Perrier, C., & Mayor, M. 2000, A&A, 364, 665
- Stassun et al. (2006) Stassun, K. G., Mathieu, R. D., & Valenti, J. A. 2006, Nature, 440, 311
- Stassun et al. (2007) —. 2007, ApJ, 664, 1154
- Tuthill et al. (2000) Tuthill, P. G., Monnier, J. D., Danchi, W. C., Wishnow, E. H., & Haniff, C. A. 2000, PASP, 112, 555
- Zahn & Bouchet (1989) Zahn, J.-P., & Bouchet, L. 1989, A&A, 223, 112
- Zapatero Osorio et al. (2004) Zapatero Osorio, M. R., Lane, B. F., Pavlenko, Y., Martín, E. L., Britton, M., & Kulkarni, S. R. 2004, ApJ, 615, 958