A new twist to an old story: HE 0450-2958, and the ULIRG(optically bright QSO) transition hypothesis
Abstract
We report on interferometric imaging of the CO J=1–0 and J=3–2 line emission from the controversial QSO/galaxy pair HE 0450–2958. The detected CO J=1–0 line emission is found associated with the disturbed companion galaxy not the luminous QSO, and implies , which is of the dynamical mass in its CO-luminous region. Fueled by this large gas reservoir this galaxy is the site of an intense starburst with , placing it firmly on the upper gas-rich/star-forming end of Ultra Luminous Infrared Galaxies (ULIRGs, ). This makes HE 0450–2958 the first case of extreme starburst and powerful QSO activity, intimately linked (triggered by a strong interaction) but not coincident. The lack of CO emission towards the QSO itself renews the controversy regarding its host galaxy by making a gas-rich spiral (the typical host of Narrow Line Seyfert 1 AGNs) less likely. Finally, given that HE 0450–2958 and similar IR-warm QSOs are considered typical ULIRG(optically bright QSO) transition candidates, our results raise the possibility that some may simply be gas-rich/gas-poor (e.g. spiral/elliptical) galaxy interactions which “activate” an optically bright unobscured QSO in the gas-poor galaxy, and a starburst in the gas-rich one. We argue that such interactions may have gone largely unnoticed even in the local Universe because the combination of tools necessary to disentagle the progenitors (high resolution and S/N optical and CO imaging) became available only recently.
1 Introduction
HE 0450-2958 is an optically bright () IR-selected QSO at a redshift of z=0.286 (Low et al. 1988), and one of the few in the local Universe whose position in the (60m, 25m) versus (100m, 60m) far-IR color-color diagram lies in the area between Ultra Luminous Infrared Galaxies (ULIRGs) and optically bright QSOs defined by and (Canalizo & Stockton 2001). Its complex environment, marked by tidal interactions, was identified early with ground-based (Hutchings, & Neff 1988) and HST imaging (Boyce et al. 1996). These efforts revealed a strongly interacting system consisting of the QSO and a disturbed galaxy away, setting this QSO/galaxy pair on par with typical ULIRGs in terms of morphology, and IR luminosity ().
The scarcity of such IR and optically luminous QSOs made HE 0450-2958 an early favorite candidate for undergoing a ULIRG(optically bright QSO) transition (Hutchings, & Neff 1988; Canalizo & Stockton 2001) in a scenario first outlined by Sanders et al. (1988). The latter was proposed after FIR color-color diagrams have identified a population of dust-enshrouded QSOs via their AGN-heated dust component (de Grijp, Miley, & Lub 1987), and it was motivated by the similar bolometric luminosities and space densities of optically powerful QSOs and ULIRGs in the local Universe. It involves two gas-rich galaxies whose strong dynamical interaction induces a starburst and fuels an AGN within heavily dust-obscured environments. Then, as star formation uses and disperses their large molecular gas reservoirs, their initially cool Spectral Energy Distribution (SED) of dust emission changes towards one dominated by warm AGN-heated dust with much warmer IR colors. Eventually an unobscured optically bright QSO emerges out of the original ULIRG. The large dust and molecular gas reservoirs found in optically selected QSOs where they fuel intense starbursts (e.g. Alloin et al. 1992; Haas et al. 2000; Evans et al. 2001) certainly support an AGN-starburst link, with dynamical interactions/mergers as the likely trigger for both activities, suggested also by optical studies (e.g. Canalizo & Stockton 2001). In this context the pivotal role of the ULIRGQSO transition objects can then be understood as the “markers” of a special evolutionary stage during which the QSO emerges from a still ongoing dusty starburst, and lasting only a fraction of already short molecular gas consumption timescales ().
HE 0450-2958 acquired further singular significance when Magain et al. (2005), after carefully subtracting the AGN emission from an ACS/HST image, failed to find the QSO host galaxy expected from well-established and tight correlations of (host galaxy)-quasar properties (e.g. McLure & Dunlop 2002; Floyd et al. 2004). This potentially pivotal result has been upheld by independent analysis (Kim et al. 2007), and follow-up VLT spectroscopic observations weakened the hypothesis for a significantly dust-enshrouded QSO host galaxy (Letawe et al. 2007). The possibility of an ejected (black-hole)+(fuel) system as responsible for a “naked” QSO, its serious consequences and observable signatures have been discussed in several papers. Summarizing their results here, such a configuration can be produced either by a Newtonian three-body “kick” exerted on a lighter black hole by a black hole binary residing in a gas-poor elliptical (Haehnelt, Davies, & Rees 2005; Hoffman & Loeb 2006), or by the recoil of a coalesced binary of spinning black holes due to an asymmetric gravitational wave emission (Haehnelt et al. 2005; Loeb 2007). The stage for both scenaria demands a strong galaxy interaction, and both have important consequences for gravitational wave detections by future detectors such as LISA, and the hierarchical build-up of supermassive black holes in galaxy centers (Haehnelt et al. 2005 and references therein).
In the present work we report on the observations of CO J=1–0, the prime molecular line used to trace metal-rich H2 gas in galaxies, using the Australian Telescope Compact Array (ATCA), and the J=3–2 line with the Smithsonian Submillimeter Array (SMA). The paper is organized as follows: a) we present the observations and their analysis (section 2), b) estimate the molecular gas and dust mass of the system and discuss the properties of the companion galaxy (Section 3), c) present the implications regarding the AGN and its host (section 4), and d) discuss possible ramifications for the ULIRGQSO evolutionary scheme (section 5). Throughout this work we adopt a cosmology with , and , for which the luminosity distance of HE 0450-2958 at z=0.286 is and .
2 Observations, data reduction, and imaging
2.1 The ATCA observations
We used the ATCA to image the CO J=1–0 line emission () towards the QSO/galaxy system HE 0450-2958 during four periods in April, August 2006 and May, August 2007 utilizing the hybrid H 214 and H 168 configurations which combine antennas on both the east-west track and north track with maximum baselines of 168 m and 214 m respectively. These special configurations provide good brightness sensitivity while achieving good u-v coverage within short (6 hrs) observing sessions. This is important for mm observations at the ATCA site where atmospheric conditions usually limit useful observing (i.e. with low system temperatures and good phase stability) to time intervals significantly shorter than typical full synthesis sessions (12 hrs). For the mean redshift of the pair (Canalizo & Stockton 2001), this CO transition is redshifted to , well within the tuning range of ATCA’s 3 mm receivers (available in 5 of the 6 antennas). The correlator setup consisted of two IF modules of channels each, and frequency resolution of . The effective velocity coverage was , after flagging bad edge channels and channel overlap (=7 channels) between the two IF modules. Pointing was checked hourly, and typical offsets were (rms), while the field of view of ATCA antennas at this frequency is 32′′ (HPBW). The array phase center was placed at the AGN’s position, marked by its radio core at 8.6 GHz (the C1 component in Feain et al. 2007).
Dedicated wideband mm continuum observations were conducted during periods in May, August 2006, and August 2007 using the two IFs tuned in series around a center frequency (well away from the CO line), and the same array configurations (two tracks with H 214, three tracks with H 168). For these observations the phase center was placed away from the QSO as to avoid any (highly unlikely) small correlator DC offsets masking as a weak continuum source at the phase center. Typical system temperatures during line and continuum observations were (including atmospheric absorption), estimated with hourly vane calibration performed per antenna.
Amplitude/phase calibration was obtained with 0454-234 observations interleaved with HE 0450-2958 in 1min/(3-5)mins calibrator/source intervals, and passband calibration was achieved by observing 1921-293 or 2223-052. The absolute flux density scale was set by bootstrapping that of 0454-234 from Uranus and/or Mars observations in each track. These yielded , where the error represents the flux scale uncertainty of the data, obtained as the dispersion of over the 2006, 2007 observing periods (and thus is an upper limit since it contains also any real source variability).
2.2 The SMA observations
A search for the redshifted CO J=3–2 line emission () was conducted using the 8-element SMA111The Submillimeter Array is a joint project between the Smithsonian Astrophysical Observatory and the Academia Sinica Institute of Astronomy and Astrophysics and is funded by the Smithsonian Institution and the Academia Sinica. interferometer on 9th of December 2006 with a median atmospheric opacity at 225 GHz of . This transition is redshifted to 269.102 GHz, covered by the lower sideband (LSB) of the 345 GHz receivers placed at 268.892 GHz, while the upper sideband was offset by 10 GHz from this center frequency. The bandwidth covered by each is 2 GHz while the spectral resolution was 3.25 MHz for a total of 768 channels. This was smoothed so that a single CO J=3-2 map was created, averaged over a velocity range of 570 centered at the redshift of the CO J=1-0 line emission.
The SMA extended configuration was used, yielding a beam of , PA=16.9∘ at the observed frequency and the u-v coverage attained. The mean system temperature was (DSB), and the total on-source integration time hrs. Calibration of the antenna gain variations was done by observing the calibrators 0522-364 and 0455-462, at regular 10 minute intervals. Saturn and 3C454.3 were used to calibrate the bandpass, while Uranus was observed for flux calibration, with an expected uncertainty of 20%. The MIR package was then used for the calibration of the visibility data. A search for 275 GHz continuum yielded an upper limit of (), over a bandwidth (both sidebands), while the noise in the line map was .
2.3 Data reduction and imaging
We used the in-situ ATCA phase monitor operating on a 230 m east-west baseline (Middelberg, Sault, & Kesteven 2006) to identify the periods when atmospheric phase noise at 90 GHz over this baseline (comparable to the longest present in our datasets) exceeded (rms) and rejected the data taken during those periods. The remaining visibilities were then edited for any remaining large temporal amplitude/phase jumps. The final visibility dataset has a residual phase rms of , in accordance with a mean coherence factor , estimated from imaging the visibilities of the calibrator with an input flux density S (and antenna amplitude/phase solutions smoothed to intervals). The u-v range of the final dataset is for both line and continuum.
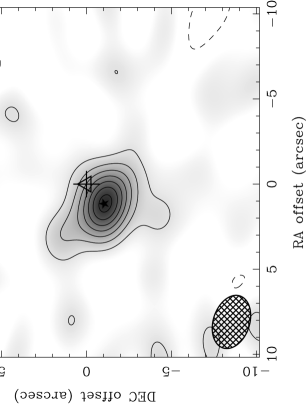
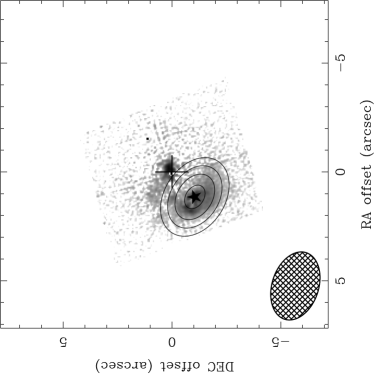
Imaging was done using MIRIAD’s task INVERT with natural weight used for maximum point-source sensitivity in our line and continuum maps. CO J=1–0 emission was detected independently in both the H 214 and H 168 array datasets, with peak flux densities differing by , consistent with the calibration uncertainties. An image of the CO J=1–0 emission was produced by multi-frequency synthesis222Fourier transform of the visibilities per channel, then averaging the resulting channel maps over the whole band, and combining both configurations. Deconvolution using the Clark algorithm was then performed. The resulting CO map and mm continuum image of the same region are shown in Figure 1, and the spectrum corresponding to the peak CO emission is shown in Figure 2.
2.3.1 Source characteristics
The velocity-averaged CO J=1–0 image yields the highest S/N possible from our data (15, Figure 1), and thus allows optimum determination of the position of the peak emission and the source size. A gaussian source model yields an excellent fit (i.e. after subtraction of the model, the noise in the residual image over the source area is , as in the rest of the map area) where the peak CO brightness is located at relative to the AGN’s radio core at the phase center. The small positional errors are those expected from the high S/N ( relative to the phase center). The angular proximity of the amplitude/phase calibrator to HE 0450–2958 ( away) allows also for excellent absolute astrometry by limiting (the uncertainty due to the phase error ) to (for typical calibration errors of the baseline length of ). Thus we are confident that the peak CO emission is not located at the QSO position but away.
The total flux density of emerges for a source for which the gaussian fit gives: and (PA=). Deconvolving the restoring beam (, PA=) yields an intrinsic size of (PA=), larger than any expected “seeing” disk. The latter, deduced from images of the amplitude/phase calibrator, is (consistent with the expected , for a residual and ).
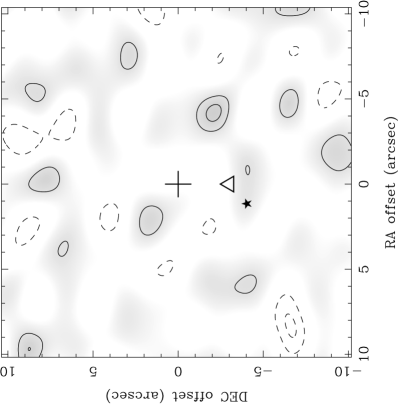
No continuum emission is detected at 94.5 GHz in either the starburst or the QSO position ( (3), Figure 1). All relevant data, and the characteristics of the CO and dust emission in HE 0450–2958 are summarized in Table 1.
3 The molecular gas in HE 0450–2958
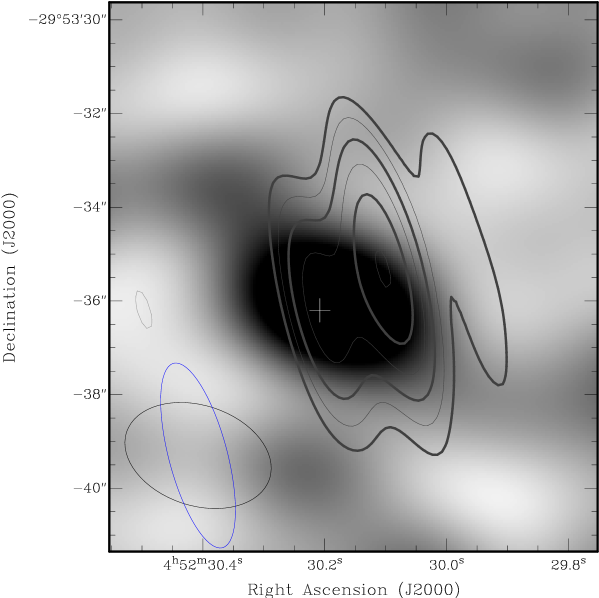
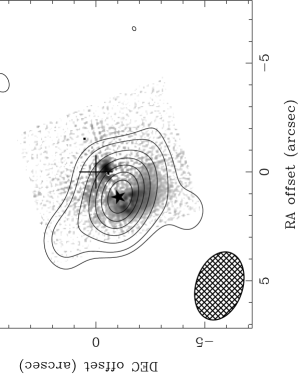
The CO J=1–0 emission overlaid with the 8.4 GHz radio continuum is shown in Figure 2 where a good correspondence with the region C 2 associated with the companion galaxy (Feain et al. 2007) is evident. Regriding the observed CO emission and its deconvolved model, and then overlaying them onto the HST/ACS optical frame of HE 0450–2958 further underlines its association with the companion galaxy rather than the QSO (Figure 4).
The corresponding H2 mass is given by , where is the velocity/area-integrated line brightness temperature at the source reference frame, and (in units) is the CO-H2 luminosity-mass conversion factor. Using standard derivations (e.g. Solomon et al. 1997) we have
| (1) |
For the observed (Table 1), and (the line rest-frame frequency), the latter gives . This is close to the maximum CO luminosity observed for starbursts, beyond which it remains constant across redshift (Frayer et al. 1999; Evans, Surace, & Mazzarella 2000), a possible indication of a self-regulating process occuring in extreme (maximal?) starbursts. Using (deduced for local ULIRGs, Downes & Solomon 1998), we obtain , which places the companion galaxy in this galaxy/QSO pair firmly in the ULIRG category, at its most gas-rich upper end, and similar to starbursts found at high redshifts (e.g. Greve et al. 2005).
A lower limit in the H2 gas mass can be obtained by assuming that the 12CO J=1–0 emission is optically thin. Using the derivation in Bryant & Scoville (1996) and assuming LTE, the new conversion factor becomes
| (2) |
where , , (CMB temperature at z=0.286), (degeneracy factor of n=1 level), (partition function), and (for solar metallicity). For typical star forming gas where , the last equation yields , and thus .
3.1 Constraints on the molecular gas excitation
The CO J=3–2 observations yield a limit of , where is the noise of the CO J=3–2 map, is the number of SMA beams corresponding to the CO J=1–0 emitting region and . This gives , and , which corresponds to a (3–2)/(1–0) brightness temperature ratio of . This is rather low for molecular gas in starbursts where (e.g. Devereux et a. 1994), though within the range found in such galaxies (e.g. Yao et al. 2003). We examined an extensive grid of models with our Large Velocity Gradient (LVG) code (based on work by Richardson 1985), restricted by the upper limit on , and the condition (since the gas cools less efficiently than the dust, and turbulent/photoelectric heating heats the gas more). Most conditions reproducing this ratio have (volume-averaged H2 gas density), rather low for star forming H2 gas. This may in turn signify that not all of the CO(1-0)-emitting gas is involved in star formation (and thus some of it is not CO(3-2)-bright). Given the minimum found in ULIRGs (Yao et al. 2003), deeper SMA observations of CO J=3–2 at a lower resolution (better matching the CO J=1–0 source size) should detect this line in HE 0450–2958 and shed light on its star-forming molecular gas phase.
3.2 The companion galaxy: a typical ULIRG
The mm/IR dust continuum SED of HE 0450–2958 from IRAS and our mm/sub-mm data (Figure 5) is typical for warm ULIRGs and IR-selected QSOs, where the presence of warm dust was the prime reason they were considered as transition objects in the evolutionary scenario linking these two classes. A cool/warm dust emission SED fit yields and (for emissivities of ). Adopting as our working value yields , , and (the luminosity of the cool dust component). A starburst in the gas-rich companion galaxy is a natural source of this large far-IR luminosity of HE 0450-2958, with a star formation rate of , and a star formation efficiency of , typical values for ULIRGs (e.g. Solomon et al. 1997). Moreover assuming most of the cool dust mass in this system residing in the companion galaxy, we obtain . These values are well within the range found in IR-luminous galaxies (e.g. Sanders Scoville, & Soifer 1991, for the adopted here), adding confidence to the estimated as a good measure of the bulk molecular gas mass present in HE 0450–2958.
The results above are certainly in good accord with evidence of significant star formation and reddening in the companion galaxy, and no such activity or dust obscuration evident in a putative QSO host galaxy (Magain et al. 2005; Letawe, Magain, & Courbin 2007). They contradict the recent view of Kim et al. 2007 regarding the nature of the companion galaxy, but also set HE 0450-2958 apart from typical ULIRGs with double nuclei. The latter have molecular gas mass ratios of (Sanders & Ishida 2004; Evans, Surace, & Mazzarela 2000), and their AGNs (when present) reside in the most gas-rich member of the interacting/merger pair (e.g. Evans et al. 1999, 2002). Subtraction of the CO emission model leaves no residual such emission in the location of the QSO with (), which corresponds to (for a common velocity range and value). A different (higher) factor for the molecular gas in the QSO host could reduce the aforementioned asymmetry in H2 gas mass distribution, while some CO emission at the QSO’s location at velocities outside our velocity coverage of could be missed. However the relatively small velocity range traced by the ULIRG, the QSO, and the highly excitated ionized gas around it (Merritt et al. 2006) make the latter possibility rather small. Sensitive wideband observations of e.g. CO J=3–2 with good brightness sensitivity would nevertheless be very valuable in the search for any QSO-related molecular gas.
3.3 The dynamical mass of the companion galaxy
The line profile towards the peak CO emission shows signs of a rotating disk (Figure 3), though the lower S/N per channel across the band makes this far from certain. The CO source model shows good overall agreement with the galaxy’s optical image (Figure 4), and at where , its dimensions are comparable to the H2-rich parts of typical spiral disks (Regan et al. 2001; Helfer et al. 2003), including the Milky Way, but with times more H2 gas mass.
For an underlying disk geometry the source angular dimensions correspond to an inclination angle . The enclosed dynamical mass then would be
| (3) |
For , (see Figure 2), it is . Thus the galaxy’s molecular gas mass amounts to of the dynamical mass enclosed in its CO-emitting region, making this ULIRG a very gas-rich system.
Inadequate resolution and/or low S/N makes it notoriously difficult to discern a gaseous disk from other possible configurations, and this has led to ambiguities regarding the presence of large gas-rich spirals, especially in the distant Universe (e.g. Genzel et al. 2003; Tacconi et al. 2006). In our case the resolution is inadequate to discern velocity/position patterns within the source and the underlying dynamical configuration could certainly be different (e.g. two orbiting compact gas reservoirs). Nevertheless for the intrinsic size and velocity width of our source most dynamical configurations would produce similar or even smaller values (e.g. Bryant & Scoville 1996; Genzel et al. 2003), and thus the ULIRG in HE 0450-2958 would remain a very gas-rich object in terms of its ratio.
4 Implications for the QSO’s host galaxy and its AGN
A suggestion for a Narrow Line Seyfert 1 (hereafter NLSy1) AGN (which have lower mass black holes), made by Merrit et al. (2006), could reconcile the lack of a massive spheroid host galaxy reported by Magain et al. (2005). However this rests on the weak premise of a good analogy between luminous QSOs and the much less luminous Seyfert galaxies, unsupported by the fact that NLSy1 AGNs are typically hosted by gas-rich spirals with luminous starbursts, while optically luminous QSOs with reside mostly in gas-poor massive elliptical hosts (Floyd et al. 2004). For example in I Zw 1 (the closest QSO and a prototypical NLSy1), a spiral disk hosts a massive cirumnuclear starburst at a radius of (Schinnerer, Eckart, & Tacconi 1998; Staguhn et al. 2004) fueled by a large molecular gas reservoir. None of that is evident in the vicinity of the AGN in the HE 0450-2958 system whose bulk of the molecular gas and starburst activity are found in the companion galaxy instead. Indicatively, at z our CO 1–0 observations could detect the molecular gas mass of the times less far-IR luminous I Zw 1 at a S/N. Finally, well-established empirical AGN-(host galaxy) correlations also predict a hitherto absent prominent elliptical (Magain et al. 2005), and thus this important issue remains open.
4.1 The AGN-related molecular gas: could it be ejected?
The two-component dust continuum SED fit (section 3.2) yields , and (the luminosity of the corresponding dust component), but unlike the typical scenario this AGN-heated dust reservoir now lies outside the ULIRG where the bulk of the dust and molecular gas mass resides. Using the same gas/dust ratio as in the companion galaxy gives . This amounts to the mass of a few GMCs, and such molecular gas quantities are found within of AGNs in the local Universe (e.g. in the Sy2 galaxy NGC 1068, Planesas, Scoville, & Myers 1991; Schinnerer, Eckart, & Tacconi 1999).
The disturbed nature of the HE 0450-2958 system and the extreme starburst in the gas-rich companion galaxy kpc away from the QSO argues in favor of a strong dynamical interaction. Could then a black hole, along with the aforementioned gas mass, have been ejected out of its host galaxy during such an event? In order to answer this and check the consistency of such proposals against the gas mass associated with this particular AGN, an estimate of its black hole mass is first needed. A lower limit can be derived from the fact that the dust within an AGN-bound gas reservoir will partly obscure it (giving rise to the distinct warm IR colors), and thus
| (4) |
where is the fraction of the AGN’s intrinsic luminosity intercepted by the dust and re-radiated at IR wavelengths, ( is the Eddington luminosity limit), is the Thomson cross section, and the black hole mass. Since , the last relation yields,
| (5) |
For (typical for , Floyd et al. 2004), and (where , Canalizo & Stockton 2001), it is . This is consistent with the low values advocated by Merritt et al. (2006), but given that ours is only a lower limit, it does not settle the issue of the black hole mass (and thus of the expected host galaxy) raised by Magain et al. (2005).
If such a black hole is the recoiling remnant of a coalesced black hole binary then, following Loeb 2007, it can carry a gas disk with a mass of
| (6) |
where is the disk viscosity parameter, , and is the ejection velocity of the recoiled merged BH product. For high ejection velocities of (e.g Hoffman & Loeb 2006) Equation 6 yields the maximum that can be carried out by the recoiling black hole of . Given that , the latter comfortably encompasses the molecular gas associated with the AGN in HE 0450-2958.
4.1.1 How long could the AGN remain luminous?
Apart from partly obscuring the AGN in HE 0450-2958 via its dust content, the molecular gas mass in its vicinity can in principle “fuel” it for
| (7) |
where is the black hole fuelling efficiency. For a typical and the estimated the latter yields . The shortness of this timescale, and the difficulty of fueling a black hole once it is outside its host galaxy, may point to fundamental limitations in the observability of such events, a plausible reason for their hitherto scarcity.
4.2 The origin of the radio continuum
The system’s radio continuum contains low-luminosity jets emerging from a radio-quiet core located at the QSO position (Feain et al. 2007). An important question arising from that study is how could the location of HE 0450-2958 near the FIR/radio correlation be explained if the starburst occurs in the companion galaxy while most of the radio emission is of AGN origin. Clues for a possible answer may be offered by the case of 1821+643, another radio-quiet but IR and optically luminous QSO (, ) residing in a giant elliptical. This was the first radio-quiet QSO discovered to have classic FR I radio structure with low brightness diffuse jets (Papadopoulos et al. 1995), and a high brightness temperature compact core (Blundell et al. 1996), indicative of a black hole–based central engine. Despite the obvious AGN contribution in its radio continuum it did not deviate decisively from the far-IR/radio correlation until the discovery of a much larger, 300 kpc-sized, low-brightness FR I radio structure (Blundell & Rawlings 2001). A similar scenario may apply for HE 0450-2958, and the discovery of such a jet morphology in this system could also offer independent clues regarding the black hole.
Interestingly, FR I-type radio structures may originate from a precessing jet axis due to binary black holes that have yet to coalesce (Blundell & Rawlings 2001). Such binaries, residing in gas-poor ellipticals (which allows for their long survival against gas-dynamical friction), are a fundamental prerequisite in the scenario of ejected AGNs as the outcome of a three-body kick during gas-rich/gas-poor galaxy interactions (Hoffman & Loeb 2006).
5 HE 0450-2958: not an ULIRGQSO transition object, implications
The hereby discovery of HE 0450-2958, considered an archetypal ULIRGQSO transition object, as a strongly interacting pair of a gas/dust-poor galaxy (marked by a residing unobscured and optically powerful QSO) and a gas-rich extreme starburst raises the prospect of such interactions being misclassified in the context of the popular ULIRGQSO evolution scenario. More such cases would then signify an important variation in the standard evolutionary picture in which starburst and QSO activity, while triggered by a common cause (a strong galaxy interaction/merger), do not necessarily involve two gas-rich progenitors with comparable amounts of molecular gas (Sanders & Ishida 2004). Such gas-poor/gas-rich galaxy interactions would not conform to the standard ULIRGQSO emergence scenario, though they can still ignite a starburst in the gas-rich progenitor (Di Mateo et al. 2007). They may also be the observational answer to the expectations of current galaxy-formation theories that predict the so called “wet-dry” mergers between gas-rich and gas-poor progenitors to be the most common in the Universe (e.g. Springel et al. 2005).
The demanding combination of observational tools it took to reveal these intriguing aspects of HE 0450-2958 may come to exemplify why such interactions have been missed until now. Moreover, it could also resolve the conflicting views regarding the host galaxies of the more powerful optical QSOs () in the local Universe. Unlike the low luminosity AGNs such as Seyferts where a consistent picture of AGNs in centers of gas-rich vigorously star-forming spirals has emerged (e.g. Schinnerer et al. 1998; Staghun et al. 2004), detailed HST studies by Dunlop et al. 2003 (see also Floyd et al. 2004) conclude that the more powerful AGNs reside in typical massive ellipticals ( light profiles, old stellar populations). On the other hand Scoville et al. 2003 (see also Bertram et al. 2007) found large amounts of molecular gas in such systems and concluded otherwise.
It is now clear that the latter conclusions are premature. Indeed all current studies of the hosts of luminous AGN lack the combination of: a) high resolution optical imaging along with specialized deconvolution techniques (allowing sensitive probing of the host galaxy properties against the bright QSO), and b) interferometric CO maps with good resolution, high S/N, and the excellent astrometry that helped identify the type of merger in the HE 0450-2958 system. Indicative of those limitations is PDS 456, the most luminous QSO in the local Universe (also a ULIRG/QSO composite in terms of its SED), where despite sensitive high resolution optical and CO imaging observations, the QSO host galaxy type and the location of the molecular gas with respect to its AGN remain unclear (Yun et al. 2004).
The short gas consumption timescales by a starburst, which are shorter still for optically powerful AGNs residing in gas-poor hosts, suggest that these twin “beacons” of gas-rich/gas-poor galaxy interactions may always be in close proximity. The advent of sensitive mm/sub-mm arrays, along with the already available high resolution optical imaging capabilities now allows their study, and the ULIRGQSO transition objects are excellent candidates.
6 Conclusions
We performed CO line emission imaging observations of the enigmatic QSO/galaxy pair HE 0450-2958 using the ATCA (CO J=1–0) and the SMA (CO J=3–2), detecting the J=1–0 line and placing an upper limit on the J=3–2 line, our conclusions are as follows
1. The CO J=1–0 line emission is associated with the companion galaxy not the QSO, it corresponds to and amounts to of the enclosed dynamical mass within kpc. This large gas reservoir fuels extreme star formation at a rate of , efficiencies of , and places the companion galaxy on the upper gas-rich and star forming end of ULIRGs. This property, along with the disturbed nature of the system, solidifies the strongly interacting status of this controversial galaxy/QSO pair.
2. No molecular gas is detected towards the QSO itself with , consistent with the little dust extinction or star formation activity deduced for its putative host galaxy. This weakens the case for a host galaxy typical for Narrow Line Seyfert 1 AGNs since these are gas-rich spirals with luminous circumnuclear starbursts. HE 0450-2958 is thus the first known case of a gas-rich extreme starburst and a powerful QSO, intimately linked (via a strong interaction), but not coincident.
3. Most of the radio continuum in this system is due to low-brightness AGN-driven jets rather than star formation activity. Deeper radio continuum observations are needed to reveal their morphology and extent, which in turn can yield more clues regarding its AGN.
4. The early prominence of HE 0450-2958 as an IR-selected QSO that exemplifies the ULIRG(optically luminous QSO) transition in a popular evolutionary scenario, and its hereby revealed nature as a strong interaction between a gas-rich and a gas-poor, possibly elliptical, galaxy opens up the possibility that some of these so-called transition objects are such interacting pairs instead. Such gas-poor/gas-rich galaxy interactions can activate a starburst in the gas-rich progenitor, and an optically luminous AGN in the gas-poor one. Their composite dust continuum would then be typical of IR-warm ULIRGQSO transition objects. Sensitive optical and CO imaging at high resolution can now reveal and study such dynamical interactions, and these transition objects are excellent candidates.
7 Acknowledgments
Jeff Wagg is grateful for support from the Max-Planck Society and the Alexander von Humboldt Foundation. The anonymous referee is gratefully acknowledged for numerous suggestions that greatly clarified the original document. We also thank all the people that operate and maintain ATCA and in particular its 3 mm receivers for their dedicated support. Padelis Papadopoulos thanks Karl Jesienowski aboard the Undersea Explorer for great conversations, and Marcella Carollo for bringing this controversial object to his attention. Last but not least he would like to thank Margarita Zakalkas for inspiration during his time in Zurich. The Australia Telescope is funded by the Commonwealth of Australia for operation as a National Facility managed by CSIRO.
References
- (1) Aalto S., Booth R. S., Black J. M.,& Johansson L. E. B. 1995, A&A, 300, 369
- (2) Alloin D., Barvainis R., Gordon M. A., & Antonucci R. R. J. 1992, A&A, 265, 429
- (3) Bahcall J. N., Kirhakos S., & Schneider D. P. 1994, ApJ, 425, L11
- (4) Barnes J. E., & Hernquist L. 1992, ARA&A, 30, 705
- (5) Bertram T., Eckart A., Fischer S., Zuther J., Straubmeier C., Wisotzki L., & Krips M. 2007, A&A, 470, 571
- (6) Blitz, L. 1997, in CO: Twenty-Five Years of Millimeter-Wave Spectroscopy, IAU Symposium No. 170, pg. 11
- (7) Blundell K. M., Beasley A. J., Lacy M., & Garrington S. T. 1996, ApJ, 468, L91
- (8) Blundell K. M., Rawlings S. 2001, ApJ, 562, L5
- (9) Bonning E. W., Shields G. A., & Salviander S. 2007, ApJ, 666, L13
- (10) Boyce P. J., Disney M. J., Blades J. C., Boksenberg A., Crane P., Deharveng J. M., Macchetto F. D., Mackay C. D., & Sparks W. B. 1996, ApJ, 473, 760
- (11) Bryant P. M., & Scoville N. Z. 1996, ApJ, 457, 678
- (12) Bryant P. M., & Scoville N. Z. 1999, AJ, 117, 2632
- (13) de Grijp M. H. K., Lub J., & Miley G. K. 1987, A&AS, 70, 95
- (14) Canalizo G., & Stockton A. 2001, ApJ, 555, 719
- (15) Devereux N., Taniguchi Y., Sanders D. B., Nakai N., Young J. S. 1994, AJ, vol. 107, no. 6, p. 2006-2016
- (16) Di Matteo P., Combes F., Melchior A.-L., & Semelin B. 2007, A&A, 468, 61
- (17) Downes D., Solomon, P. M. 1998, ApJ, 507, 615
- (18) Dunlop J. S., McLure R. J., Kukula M. J., Baum S. A., O’Dea C. P., & Hughes D. H. 2003, MNRAS, 340, 1095
- (19) Evans A. S., Kim D. C., Mazzarella J. M., Scoville N. Z., & Sanders D. B. 1999, ApJ, 521, L107
- (20) Evans A. S., Surace J. A., & Mazzarella J. M. 2000, ApJ, 529, L85
- (21) Evans A. S., Frayer D. T., Surace J. A., & Sanders D. B. 2001, AJ, 121, 3286
- (22) Evans A. S., Mazzarella J. M., Surace J. A. & Sanders D. B. 2002, ApJ, 580, 749
- (23) Evans A. S., Solomon P. M., Tacconi L. J., Vavilkin T., & Downes D. 2006, AJ, 132, 2398
- (24) Floyd D. J. E., Kukula M. J., Dunlop J. S., McLure R. J., Miller L., Percival W. J., Baum S., & O’Dea C. P. 2004, MNRAS, 355, 196
- (25) Frayer D. T. et al. 1999, ApJ, 514, L13
- (26) Genzel R., Baker A. J., Tacconi, L. J., Lutz D., Cox P., Guilloteau S., & Omont A. 2003, ApJ, 584, 633
- (27) Haas M., Müller S. A. H., Chini R., Meisenheimer K., Klaas U., Lemke D., Kreysa E., & Camenzind M. 2000, A&A, 354, 453
- (28) Haehnelt M. G., Davies M. B., & Rees M. J. 2005, MNRAS, 366, L22
- (29) Helfer T. T., et al. 2003, ApJS, 145, 259
- (30) Hoffman L., & Loeb A. 2006, ApJ, 638, L75
- (31) Hutchings J. B., & Neff S. G. 1988, AJ, 96, 1575
- (32) Feain I. J., Papadopoulos P. P., Ekers R., & Middelberg E. 2007, ApJ, 662, 872
- (33) Floyd D. J. E., Kukula M. J., Dunlop J. S., McLure R. J., Miller L., Percival W. J., Baum S. A., O’Dea C. P. 2004, MNRAS, 355, 196
- (34) Greve T. R., et al. 2005, MNRAS, 359, 1165
- (35) Kim M., Ho L. C., Peng C. Y., Im M. 2007, ApJ, 658, 107
- (36) Letawe G., Magain P., & Courbin F. 2007, A&A (in press), arXiv:0709.3743v1
- (37) Loeb A. 2007, Physical Review Letters, 0031-9007/07/99(4)/041103(4)
- (38) Low F. J., Cutri R. M., Huchra J. P., & Kleinman S. G. 1988, ApJ, 327, L41
- (39) McLure R. J., & Dunlop J. S. 2002, MNRAS, 331, 795
- (40) Magain P., Letawe G., Courbin F., Jablonka P., Jahnke K., Meylan G., & Wisotzki L. 2005, Nature, Vol. 437, 318
- (41) Merritt D., Storchi-Bergmann T., Robinson A., Batcheldor D., Axon D., & Cid Fernandes R. 2006, MNRAS, 367, 1746
- (42) Middelberg E., Sault R. J., & Kesteven M. J. 2006, Publications of the Astronomical Society of Australia, Vol. 23, Issue 4, p. 147
- (43) Moshir M. et al. 1990, Bulletin of the American Astronomical Society, Vol. 22, p.1325
- (44) Papadopoulos P. P., Seaquist E. R., Wrobel J. M., & Binette L. 1995, ApJ, 446, 150
- (45) Planesas P., Scoville N. Z., & Myers S. T. 1991, ApJ, 369, 364
- (46) Regan W. M., et al. 2001, ApJ, 561, 218
- (47) Richardson K. J. 1985, PhD Thesis, Queen Mary College, University of London
- (48) Sanders D. B., et. al. 1988, ApJ, 328, L35
- (49) Sanders D. B., Scoville N. Z., & Soifer B. T. 1991, ApJ, 370, 158
- (50) Sanders D. B., & Ishida C. M. 2004, in The Neutral ISM in Starburst Galaxies, ASP Conference Series, Vol. 320, pg. 230
- (51) Schinnerer E., Eckart A., & Tacconi L. J. 1998, ApJ, 500, 147
- (52) Schinnerer E., Eckart A., & Tacconi L. J. 1999, ApJ, 524, L5
- (53) Scoville N. Z., Frayer D. T., Schinnerer E., & Christopher M. 2003, ApJ, 585, L105
- (54) Scoville N. Z. 2004, in The Neutral ISM in Starburst Galaxies, ASP Conference Series, Vol. 320, pg. 253
- (55) Solomon P. M., Downes D., Radford S. J. E., & Barrett J. W. 1997, ApJ, 478, 144
- (56) Springel V., et al. 2005, Nature, 435, 629
- (57) Staguhn J. G., Schinnerer E., Eckart A., & Scharwächter J. 2004, ApJ, 609, 85
- (58) Tacconi L. J., Genzel R., Blietz M., Cameron M., Harris A. I., & Madden S. 1994 ApJ, 426, L77
- (59) Tacconi L. J., Neri R., Chapman S. C., Genzel R., Smail I., Ivison R. J., Bertoldi F., Blain A., Cox P., Greve T., & Omont, A. 2006, ApJ, 640, 228
- (60) Yao L., Seaquist E. R., Kuno N., & Dunne L. 2003, ApJ, 588, 771
- (61) Yun M. S., Reddy N. A., Scoville N. Z., Frayer D. T., Robson E. I., & Tilanus R. P. J. 2004, ApJ, 601, 723


| Property | AGN | Companion galaxy |
|---|---|---|
| 04h 52m 30s.1 |
aaPosition of the peak CO J=1–0 emission with respect to the
AGN (see 2.3.1) |
|
| –29∘ 53′ 35.0′′ |
aaPosition of the peak CO J=1–0 emission with respect to the
AGN (see 2.3.1) |
|
| bbCanalizo & Stockton 2001 | 0.2863 | 0.2865 |
| (1–0) (mJy/beam)ccAll limits are , point source assumed for AGN-related limits | ||
| (3–2) (mJy/beam)ccAll limits are , point source assumed for AGN-related limits | ||
| (Jy km s-1)ccAll limits are , point source assumed for AGN-related limits | ||
| (Jy km s-1)ccAll limits are , point source assumed for AGN-related limits | ||
| Intrinsic CO(1-0) source size | ||
| ddSee section 3 | ||
| (mJy)ccAll limits are , point source assumed for AGN-related limits | ||
| (mJy)ccAll limits are , point source assumed for AGN-related limits | ||
| eefrom the dust continuum SED fit in Figure 6 | 2.6 | 2.1 |