The Spitzer spectroscopy survey of ices around low-mass young stellar objects, III: CH4
Abstract
CH4 is proposed to be the starting point of a rich organic chemistry. Solid CH4 abundances have previously been determined mostly toward high mass star forming regions. Spitzer/IRS now provides a unique opportunity to probe solid CH4 toward low mass star forming regions as well. Infrared spectra from the Spitzer Space Telescope are presented to determine the solid CH4 abundance toward a large sample of low mass young stellar objects. 25 out of 52 ice sources in the (cores to disks) legacy have an absorption feature at 7.7 m, attributed to the bending mode of solid CH4. The solid CH4 / H2O abundances are 2-8%, except for three sources with abundances as high as 11–13%. These latter sources have relatively large uncertainties due to small total ice column densities. Toward sources with H2O column densities above 2 cm-2, the CH4 abundances (20 out of 25) are nearly constant at 4.71.6%. Correlation plots with solid H2O, CH3OH, CO2 and CO column densities and abundances relative to H2O reveal a closer relationship of solid CH4 with CO2 and H2O than with solid CO and CH3OH. The inferred solid CH4 abundances are consistent with models where CH4 is formed through sequential hydrogenation of C on grain surfaces. Finally the equal or higher abundances toward low mass young stellar objects compared with high mass objects and the correlation studies support this formation pathway as well, but not the two competing theories: formation from CH3OH and formation in gas phase with subsequent freeze-out.
1 Introduction
The presence and origin of complex organic molecules in protostellar regions and their possible incorporation in protoplanetary disks is an active topic of research. CH4 is proposed to be a starting point of a rich chemistry, especially when UV photons are present (Dartois et al., 2005). In particular CH4 is believed to play a key role in the formation process of prebiotic molecules (Markwick et al., 2000).
CH4 is less well studied in interstellar and circumstellar media compared to other small organic molecules because CH4 has no permanent dipole moment and therefore cannot be observed by pure rotational transitions at radio wavelengths. Solid CH4 was first detected through its bending mode at 7.67 m from the ground by Lacy et al. (1991), and with the Infrared Space Observatory Short Wavelength Spectrometer (ISO-SWS) by Boogert et al. (1996) toward a few high-mass sources. Tentative claims have been made toward some other objects including low-mass protostars, but are inconclusive because of the low S/N ratio of these data (Cernicharo et al., 2000; Gürtler et al., 2002; Alexander et al., 2003). Solid CH4 has also been detected from the ground through its stretching mode at 3.3 m, but only toward the brightest high mass sources due to problems in removing the many atmospheric lines in this spectral region (Boogert et al., 2004a).
Models predict CH4 to form rapidly on cool grains through successive hydrogenation of atomic C; similarly H2O is formed through hydrogenation of atomic O (van de Hulst, 1946; Allen & Robinson, 1977; Tielens & Hagen, 1982; Brown et al., 1988; Hasegawa et al., 1992; Aikawa et al., 2005). Observations of CH4 hence provide insight into the basic principles of grain surface chemistry. Compared to H2O the observed gas- and solid-state CH4 abundances are low; reported CH4 abundances are typically a few percent with respect to H2O (Lacy et al., 1991; Boogert et al., 1998). This points to relatively low atomic C abundances at the time of CH4 formation, with most C already locked up in CO as H readily reacts with C on surfaces (Hiraoka et al., 1998). This is in agreement with the high CH3OH abundances in several lines of sight, formed by hydrogenation of CO (Dartois et al., 1999; Pontoppidan et al., 2003), and large CO2 abundances, formed through oxidation of CO or hydrogenated CO. That these molecules are all formed through a similar process is corroborated by the profiles of solid CO2 absorption bands, which usually show an intimate mixture of CO2, CH3OH and H2O in interstellar ices (Gerakines et al., 1999; Boogert et al., 2000; Knez et al., 2005).
If CH4 is formed efficiently through grain surface reactions as well, CH4 should be similarly mixed with H2O. Observations of solid CH4 toward a few high mass young stellar objects (YSOs) show that the CH4 absorption band profiles are broad and agree better with CH4 in a hydrogen bonding ice, H2O or CH3OH, than with a pure CH4 ice or CH4 mixed with CO (Boogert et al., 1997). This profile analysis does not, however, exclude CH4 formation from photoprocessing of CH3OH (Allamandola et al., 1988; Gerakines et al., 1996). In addition, because of the small sample in previous studies, it is unclear if these broad profiles are a universal feature. Hence it cannot be excluded that CH4 in some environments may form in the gas phase and subsequently freeze out.
Because formation pathway efficiency depends on environment, another method for testing formation routes is through exploring the distribution of CH4 toward a large sample of objects of different ages, luminosities and ice column densities. In addition, correlations, or lack thereof, with other ice constituents may provide important clues to how the molecule is formed. If CH4 is formed through hydrogenation on grain surfaces in quiescent clouds, the CH4 abundance with respect to H2O should be fairly source independent since this mechanism mainly depends on the initial conditions of the cloud before the star forms, which seem to vary little between different star forming regions. Because of the generality of this mechanism, the CH4 and H2O, and possibly CO2, column densities should correlate over a large range of different environments. This is also the prediction of several models where the solid CH4/H2O and CH4/CO2 ratios in dark clouds vary little both as a function of time (Hasegawa et al., 1992) and distance into a cloud that has collapsed (Aikawa et al., 2005). In contrast, CO, which is formed in the gas phase and subsequently frozen out, is predicted to only correlate with CH4 during certain time intervals. If CH4 instead forms in the gas phase, solid CH4 should be better correlated with solid CO than with solid H2O and CO2, since pure CH4 freezes out and desorbs at similar temperatures to CO (Fraser et al. submitted to , Collings et al., 2004). Finally, if CH4 forms by UV photoprocessing of CH3OH more CH4 would also be expected to form toward sources with stronger UV-fields i.e. higher mass objects.
The objective of this study is to determine the CH4 abundances and distribution pattern toward a sample of low mass young stellar objects, varying in evolutionary stage and total ice column density. The distribution pattern and correlations with other ice constituents within the sample as well as comparison with high mass young stellar objects will be used to constrain the CH4 formation mechanism. This study is based on spectra acquired with the Spitzer Infrared Spectrometer (IRS) as part of our legacy program ‘From molecular cores to protoplanetary disks’ (), which provides a large sample (41 sources) of infrared spectra of low mass star formation regions (Evans et al., 2003). In addition 11 sources are added from the GTO program 2 for which ground based 3-5 m already exist (Pontoppidan et al., 2003). Overviews of the H2O, CO2, CH3OH and other ice species in these data are found in Boogert et al. (ApJ submitted, Paper I) and Pontoppidan et al. (ApJ submitted, Paper II). The detection of solid CH4 toward one of the sources, HH46 IRS, was published by Boogert et al. (2004b). We have detected an absorption feature, which is attributed to solid CH4, toward 25 out of 52 low mass ice sources found in this sample.
2 Source sample selection, observations and data reduction
The source sample consists of a combination of known low mass protostars and new protostars discovered by their Spitzer IRAC and MIPS broad-band SEDs. Spitzer/IRS spectra were obtained as part of the Legacy program (PIDs 172 and 179) as well as a dedicated open time program (PID 20604) and a few archival spectra observed as a part of the GTO programs of Houck et al. Among the targets observed with the IRS short-long (SL) module, 41 ice sources were identified from their spectra in the sample (Paper I). The GTO sources are all associated with the Ophiuchus cloud and were selected based on previous ice observations at 3-5m (Pontoppidan et al., 2003). The source sample of 25 low mass protostars presented here was selected from the 41 and 11 GTO ice sources based solely on the existence of an absorption feature at 7.7 m, identified with solid CH4 (Table 1). Due to the high sensitivity of the Spitzer/IRS, a large range of star formation stages are represented in the sample from very young YSOs at the interface of the Class 0/I stages (e.g. B1-c) to objects like RNO 91, identified as an inclined disk with a remnant envelope. It also includes VEry Low Luminosity Objects (VELLOs) such as L1014 IRS (Young et al., 2004). More information about the evolutionary stages of the objects are reported in Paper I.
The Spitzer/IRS spectra were reduced using the 2-dimensional Basic Calibrated Data (BCD) spectral images, produced by the Spitzer Science Center (SSC) pipeline version S13.2.0, as a starting point. The low resolution modules, which are the relevant ones for the solid CH4 feature, were reduced in a similar way to ground-based spectra. First, the spectral and spatial dimensions were orthogonalized, and then the 2-dimensional images of the two nodding positions were subtracted in order to remove the extended emission. A fixed width extraction was performed and then the 1-dimensional spectra were averaged. Subsequently the spectra were divided by spectra of the standard star HR 2194, reduced in the same way, to correct for wavelength dependent slit losses. Finally the spectra were multiplied along the flux scale in order to match Spitzer/IRAC photometry. One source, EC 92, was carefully extracted manually due to multiple other sources present in the slit. More details about the reduction and the complete mid-infrared spectra of the sources is presented in Paper I. The CH4 7.7 m absorption feature falls within the range of the IRS modules SL1 and SL2. At these wavelengths the resolving power of IRS is 65 or 0.12 m for SL1 and 125 or 0.06 m for SL2 (IRS Data Handbook). The plotted spectra are made up using data from the main orders of SL1 and SL2, while the SL1 bonus order was only used to confirm detections. SL2 stops around 7.6 m so the peak of the CH4 absorption feature is always in SL1. The part of the spectra from the SL2 module is hence mainly used to determine the continuum and in some cases the shape of a low wavelength wing. When comparing observations to laboratory spectra, the laboratory spectra are always convolved to the resolution of SL1 (0.12 m, sampled with two pixels per resolution element).
ISO-SWS spectra of four high mass YSOs are used for comparison between low mass and high mass protostars in this paper. The latest Standard Processed Data (SPD) pipeline version 10.1 products were taken from the ISO archive and the detector scans were cleaned from cosmic ray hits and averaged. The final spectra do not show significant differences with respect to the data published in Keane et al. (2001).
| Source | Alias | RA J2000 | Dec J2000 | Cloud | Type | Obs. ID |
|---|---|---|---|---|---|---|
| IRAS 03235+3004 | 03:26:37.5 | +30:15:27.9 | Perseus | low | 9835520 | |
| IRAS 03245+3002 | 03:27:39.0 | +30:12:59.3 | Perseus | low | 6368000 | |
| L1455 SMM1 | 03:27:43.3 | +30:12:28.8 | Perseus | low | 15917056 | |
| IRAS 03254+3050 | 03:28:34.2 | +31:00:51.2 | Perseus | low | 11827200 | |
| B1-c | 03:33:17.9 | +31:09:31:0 | Perseus | low | 13460480 | |
| B1-b | 03:33:20.3 | +31:07:21.4 | Perseus | low | 1596544 | |
| L1489 IRS | IRAS 04016+2610 | 04:04:43.1 | +26:18:56.4 | Taurus | low | 3528960 |
| IRAS 08242-5050 | HH46 IRS | 08:25:43.8 | -51:00:35.6 | HH46 | low | 5638912 |
| IRAS 12553-7651 | 12:59:06.6 | -77:07:40.0 | Cha | low | 9830912 | |
| IRAS 15398-3359 | 15:43:02.3 | -34:09:06.7 | B228 | low | 5828864 | |
| GSS 30 IRS1 | 16:26:21.4 | -24:23:04.1 | Ophiuchus | low | 12699392 | |
| IRS 42 | 16:27:21.5 | -24:41:43.1 | Ophiuchus | low | 12699648 | |
| IRS 43 | 16:27:27.0 | -24:40:52.0 | Ophiuchus | low | 12699648 | |
| IRS 44 | 16:27:28.1 | -24:39:35.0 | Ophiuchus | low | 12699648 | |
| IRS 63 | 16:31:35.7 | -24:01:29.5 | Ophiuchus | low | 12676608 | |
| VSSG 17 | IRS 47 | 16:27:30.2 | -24:27:43.4 | Ophiuchus | low | 12698624 |
| RNO 91 | IRAS 16316-1540 | 16:34:29.3 | -15:47:01.4 | L43 | low | 5650432 |
| B59 YSO5 | 17:11:22.2 | -27:26:02.3 | B59 | low | 14894336 | |
| 2MASSJ17112317-2724315 | 17:11:23.1 | -27:24:32.6 | B59 | low | 14894592 | |
| SVS 4-5 | EC 88 | 18:29:57.6 | +01:13:00.6 | Serpens | low | 9407232 |
| EC 92 | SVS 4-10 | 18:29:57.9 | +0.1:12:51.6 | Serpens | low | 9407232 |
| CrA IRS 5 | 19:01:48.0 | -36:57:21.6 | Corona Australis | low | 9835264 | |
| CrA IRS 7 B | 19:01:56.4 | -36:57:28.0 | Corona Australis | low | 9835008 | |
| CrA IRAS32 | 19:02:58.7 | -37:07:34.5 | Corona Australis | low | 9832192 | |
| L1014 IRS | 21:24:07.5 | +49:59:09.0 | L1014 | low | 12116736 | |
| W33A | 18:14:39.4 | -17:52:01.3 | high | 32900920 | ||
| NGC7538 IRS9 | 23:14:01.6 | +61:27:20.2 | high | 09801532 | ||
| GL989 | 06:41:10.1 | +0.9:29:35.8 | high | 71602619 | ||
| GL7009S | 18:34:20.9 | -05:59:42.2 | high | 15201140 |
| Source | FWHM | N(CH4) | N(CH4) | N(SO2)max | ||||
|---|---|---|---|---|---|---|---|---|
| m | m | cm-1 | cm-1 | 1017 cm-2 | / N(H2O)100 | |||
| IRAS 03235+3004 | 7.690.03 | 0.160.05 | 0.160.07 | 4.61.0 | 2.90.8 | 6.21.8 | 4.31.4 | 0.350.19 |
| IRAS 03245+3002 | 7.590.03 | 0.200.08 | 0.170.04 | 4.30.1 | 3.20.4 | 6.80.8 | 1.70.3 | 0.080.01 |
| L1455 SMM1 | 7.660.01 | 0.150.02 | 0.240.03 | 6.20.3 | 4.90.1 | 10.0.1 | 5.80.9 | 0.210.03 |
| IRAS 03254+3050 | 7.680.01 | 0.200.03 | 0.0400.008 | 1.40.2 | 0.70.1 | 1.60.3 | 4.00.9 | 0.450.14 |
| B1-c | 7.680.01 | 0.130.01 | 0.400.05 | 8.71.3 | 7.61.2 | 163 | 5.41.4 | 0.110.03 |
| B1-b | 7.700.01 | 0.100.01 | 0.160.01 | 2.70.1 | 2.80.1 | 5.90.2 | 3.30.6 | 0.000.01 |
| L1489 IRS | 7.680.01 | 0.130.01 | 0.0370.006 | 0.930.04 | 0.640.04 | 1.40.1 | 3.10.2 | 0.140.01 |
| IRAS 08242-5050 | 7.680.06 | 0.170.16 | 0.0980.063 | 2.91.8 | 1.90.8 | 3.91.8 | 5.02.4 | 0.400.68 |
| IRAS 12553-7651 | 7.660.02 | 0.180.04 | 0.0260.005 | 0.60.1 | 0.50.1 | 1.10.1 | 3.80.9 | 0.130.03 |
| IRAS 15398-3359 | 7.680.01 | 0.130.01 | 0.220.03 | 5.10.6 | 4.20.8 | 8.81.7 | 6.02.0 | 0.200.06 |
| IRS 42 | 7.720.01 | 0.120.03 | 0.0410.012 | 0.820.11 | 0.620.22 | 1.40.4 | 7.72.4 | 0.210.06 |
| IRS 43 | 7.700.01 | 0.210.04 | 0.0500.014 | 1.70.6 | 0.940.33 | 2.10.6 | 6.62.3 | 0.700.36 |
| IRS 44 | 7.710.01 | 0.190.01 | 0.0530.015 | 1.70.4 | 0.90.2 | 2.10.4 | 6.11.4 | 0.630.23 |
| IRS 63 | 7.700.14 | 0.140.13 | 0.0420.026 | 1.00.4 | 0.720.31 | 1.60.7 | 7.93.8 | 0.420.59 |
| GSS 30 | 7.720.16 | 0.140.13 | 0.0450.027 | 1.10.8 | 0.70.4 | 1.60.9 | 116.2 | 0.60 0.9 |
| VSSG17 | 7.680.01 | 0.260.04 | 0.0420.006 | 1.80.2 | 0.80.1 | 1.80.2 | 112.2 | 1.50.35 |
| RNO91 | 7.690.03 | 0.270.13 | 0.0380.009 | 1.60.7 | 0.680.17 | 1.60.5 | 4.81.6 | 0.760.44 |
| B59 YSO5 | 7.700.01 | 0.190.06 | 0.0960.050 | 3.23.4 | 1.80.9 | 3.82.0 | 2.71.6 | 0.310.37 |
| 2MASSJ17112317 | 7.690.01 | 0.170.06 | 0.130.052 | 3.92.0 | 2.51.0 | 5.42.2 | 2.81.2 | 0.200.23 |
| SVS4-5 | 7.670.01 | 0.160.02 | 0.0830.010 | 2.20.2 | 1.60.3 | 3.50.6 | 6.11.7 | 0.290.08 |
| EC92 | 7.710.01 | 0.070.10 | 0.0660.032 | 0.670.21 | 0.880.47 | 2.01.2 | 137.7 | 0.330.23 |
| CrA IRS5 | 7.680.01 | 0.190.02 | 0.0550.011 | 1.70.3 | 1.10.1 | 2.30.3 | 6.21.0 | 0.500.13 |
| CrA IRS7b | 7.690.02 | 0.160.05 | 0.0800.019 | 2.20.5 | 1.50.5 | 3.11.1 | 3.01.2 | 0.190.08 |
| CrA IRAS32 | 7.720.04 | 0.090.13 | 0.0930.018 | 1.40.4 | 1.60.2 | 3.50.4 | 6.62.5 | 0.120.05 |
| L1014 IRS | 7.680.01 | 0.190.06 | 0.110.022 | 3.71.2 | 2.40.7 | 5.11.5 | 7.12.3 | 0.530.25 |
| Average | 7.69 | 0.16 | 0.10 | 2.7 | 1.5 | 4.1 | 5.8 | 0.34 |
| Standard deviation | 0.03 | 0.05 | 0.09 | 2.0 | 1.4 | 3.5 | 2.7 | 0.35 |
3 Results
3.1 CH4 column densities
Figure 1 shows the flux calibrated spectra of the 25 low mass YSOs containing the CH4 7.7 m absorption feature. The spectra were converted to optical depth scale using a smooth spline continuum fitted to the 7-7.4 m and 8.0-8.3 m regions as shown in Fig. 1. A local continuum is necessary since the CH4 feature lies on the edge of other broader features such as the 9.7 m feature. Fitting the continuum is complicated by the presence of a weak HI recombination emission line at 7.5 m (Pfund ) toward several of the sources e.g. the CrA sources, IRAS 03235+3004, L1489 IRS, RNO 91 and SVS 4-5. Of these ground based spectra around 4m exist for CrA IRS5, CrA IRS7b, IRAS 03235+3004, L1489 IRS and SVS 4-5. In all of these spectra the 4.05 m HI Brackett is clearly visible corroborating the identification of the emission feature with hydrogen.
To estimate the uncertainties introduced by the choice of continuum, the spectra were also converted to optical depth scale by adopting a local, straight line continuum between 7.4 and 7.9 m. The differences in optical depth using the two different continua are less than 20% for most sources, but between 30 and 60% for a few cases: CrA IRS 7B, IRAS 03235+3004, IRAS 12553-7651 and RNO 91. The resulting optical depth spectra using the smooth spline continuum subtraction are shown in Fig. 2.
The peak position, full width half maximum (FWHM) and peak optical depth of the 7.7 m absorption feature along each line of sight were calculated from the best Gaussian fit between 7.5 and 7.9 m (Table 2). The reported error estimates include uncertainties in the fit and choice of continuum. The typical peak position is 7.69 m and the peak widths range from 0.07 to 0.27 m. The features hence range from unresolved to barely resolved as the resolution at the center peak position is 0.12 m. The large widths of the feature in the observed spectra, except for B1-b, suggest that CH4 is generally in an H2O or CH3OH dominated mixture, where laboratory data show that the CH4 feature has a width of up to 0.15 m (Boogert et al., 1997).
Figure 3 compares the source with the deepest absorption feature, B1-c, with different CH4 containing laboratory ice spectra, convolved to the resolution of IRS-SL1. In the three laboratory ice spectra used here – a H2O dominated ice, an ice mixture that contains equal parts of H2O, CH3OH and CO2 and pure CH4, all at 10 K – the CH4 absorption profile has both different widths and peak positions. Toward most sources, as for B1-c, H2O dominated ice spectra provide the best fit. Hence, comparisons with a H2O:CH4 3:1 ice spectrum were used to determine the amount of CH4 present in the observed spectra and also how much of the 7.7 m feature can be accounted for by solid CH4 (Fig. 2). Table 2 shows that CH4 can account for 45–100% of the absorption.
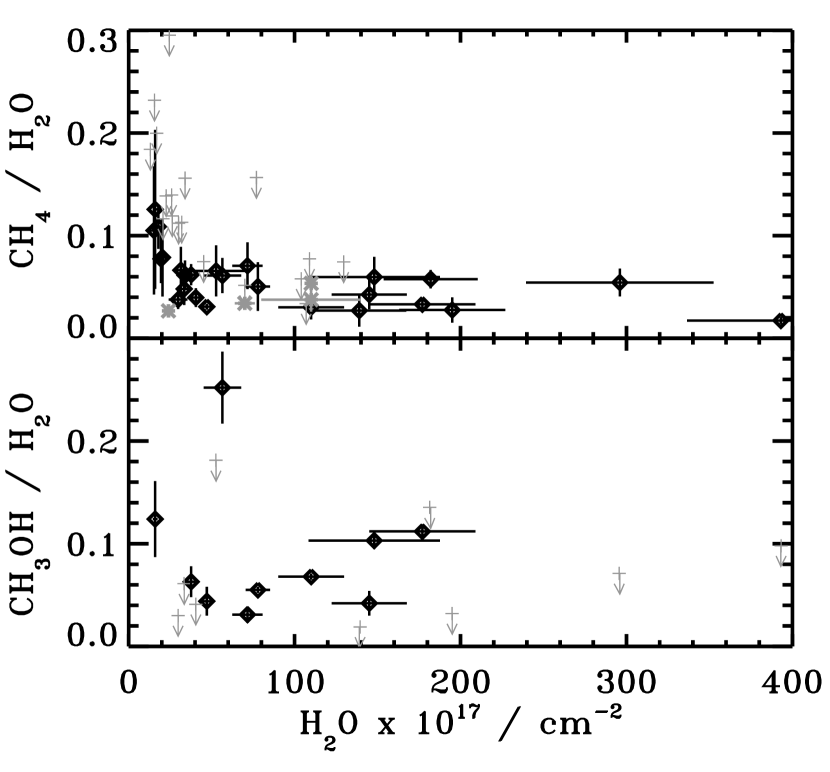
The CH4 column densities were calculated from the integrated optical depths of the laboratory spectra, scaled to the peak optical depths of the observations, and the band strength for the bending mode of solid CH4 in a H2O rich ice, cm molecule-1 (Boogert et al., 1997). The uncertainty in CH4 column densities stems from both the baseline subtraction and the uncertainty in ice mixture composition even after a H2O rich ice has been assumed. To obtain abundances with respect to solid H2O, the CH4 column densities were divided by the solid H2O column densities from Paper I. Figure 4 shows the CH4 abundances with respect to H2O as a function of H2O column density. The CH4 abundances in the entire sample vary between 2 and 13% and it is seen in the plot that the sample can be split into two parts: sources with H2O column densities around 2 cm-2 and sources with H2O column densities of 3–40 cm-2. In the former group the CH4 abundances with respect to H2O vary between 6 and 13% and in the latter group all CH4 abundances fall between 2 and 8%. Due to the low total column densities in the high abundance group, the uncertainties there tend to be larger. Below 3 cm-2 there also seem to be some negative correlation between column density and CH4 abundance. Figure 4 also shows the CH3OH abundances and upper limits towards the sources in this sample (Paper I) . CH3OH abundances span a larger interval than CH4 and show none of the column density dependences visible for CH4. The large variation for CH3OH abundances is similar to what was found previously for a different sample by Pontoppidan et al. (2003).
The excess absorption (0–55%) of the observed 7.7 m features in many of the astronomical objects is due to broader profiles than expected even for CH4 in a H2O rich ice. It is possible that an additional molecule is contributing to the optical depth of the 7.7 m feature, e.g. solid SO2. Solid SO2 was suggested by Boogert et al. (1997) to explain the blue wing of the 7.7 m feature in W33A. In contrast, another high mass source NGC7538 IRS9 displays no such wing. A comparison between these two sources and low mass sources from this sample shows that the same variation is present here (Fig. 5) – approximately 25% of the sources in this study have a clear blue wing, perhaps attributable to solid SO2. The maximum amounts of SO2 present in the observed ices is estimated by assuming that all excess absorption is due to SO2 and using its measured band strength of (Sandford & Allamandola, 1993) (Table 2). The solid SO2 abundances then vary between 0.1 and 1.5% with respect to H2O.
In cases where the excess is similar on both sides of the CH4 absorption, another source of the large widths of the features may be the choice of continuum; the spline continuum was difficult to fit because the CH4 feature is generally shallow and overlapping with other, larger, features. It is possible that the wings toward several sources are not intrinsic, but a product of this fit. This is highlighted by a comparison between Fig. 1 and Fig 2, which shows that the sources with clear continua also have thinner absorption features than the average.
3.2 Upper limits of solid CH4
Upper limits for solid CH4 were determined for the 27 sources without CH4 detections, in the sample of 52 low mass ice sources originally probed for CH4, by estimating the maximum amount of a H2O:CH4 3:1 ice that could hide under the noise. The average 3 upper limit is 15% solid CH4 with respect to solid H2O, which is in the upper range of CH4 abundances in the sources with solid CH4 detections. All abundance upper limits below 30% are shown in Figure 4. Only one CH4 upper limit, of 3%, falls below the average abundance of 4.8%. The lack of detection in these 27 sources is hence probably due to the spectral quality and low fluxes of the objects rather than a lower amount of solid CH4.
3.3 Molecular correlations
The objects in this sample may vary significantly in temperature structure as well as other environmental factors. Lack of correlations between molecular abundances may hence be due to either different formation pathways or differences in volatility. A lack of correlation between CH4 and molecules of different volatility does hence not exclude that they formed in a similar manner. In pure form CH4 has a similar volatility to CO (Collings et al., 2004). If CH4 is mixed with H2O significant amounts can be trapped inside of the H2O ice, however, and then CH4 has an effective volatility closer to that of H2O and CO2.
The column densities of solid H2O (26 detections) and CH3OH (10 detections) have been derived in Paper I and solid CO (13 ground based observations) and CO2 (25 detections) in Pontoppidan et al. (2003) and Paper II for many of the CH4 sources. The column densities and abundances for these molecules are plotted versus CH4 in Figs. 6 and 7. Where the plots reveal a linear relationship between molecules the best linear fit is also drawn. The Pearson product-moment correlation coefficient, , was calculated to measure the strength of the correlation – directly gives the fraction of variance of the second molecule that is due to changes in CH4, assuming a linear relationship between the two molecules.
Figure 6 shows the correlations between the column densities of solid CH4 and the four other ice components. Some correlation between column densities of ice species and with total column density is always expected, but Fig. 6 shows that the strength of this correlation is variable between CH4 and the different molecules. CH4 correlates strongly (=0.91) with CO2, which is believed to form on grain surfaces. The correlation with H2O, another species formed on surfaces, is weaker (=0.64), but this correlation coefficient is significantly increased if one outlier, IRAS 03245+3002, is removed. is then 0.82 for the CH4–H2O correlation. IRAS 03245+3002 could have been identified previous to the correlation studies as an outlier since it is the only source with no CO2 ice detection putting an upper limit on its CO2/H2O of 15%, compared to 309% for the entire sample. Even without removing the outlier the correlations are significant at the 99% level with 23 and 24 degrees of freedom (DF) respectively.
CH4 and CH3OH and CO are barely signficantly correlated (=0.48 with 8 DF and 0.49 with 11 DF respectively). The small number of CO abundances, which are only available for 11 of the targets in this study, complicates interpreting the low correlation plots between CO and CH4. If only the sources for which CO measurements exist are used to calculate the CH4–CO2 and CH4–H2O correlations these are reduced to =0.46 and 0.74 respectively.
The stronger correlation between CH4 and CO2 compared to CH4 and H2O is curious, but may be an artefact of the fact that the CO2 column densities are better known for this sample than the H2O column densities. For most sources in this sample the H2O column densities are determined by estimating the depth of the H2O libration feature, which is difficult due to the overlap with the silicate feature at 9.7 m. The uncertainties in these H2O column densities were estimated to 30% in Paper I after comparison between derived abundances from the 3 m mode and the libration mode for the sources with 3 m spectra. Furthermore the different amounts of CO2 toward the different sources may introduce further error in the derived H2O column densities as recently shown in Öberg et al. (2007).
Figures 7 show the correlations between solid CH4 and the other three ice species, with the abundances normalized to the solid H2O column density - the main ice constituent (Fig. 7). When normalizing to H2O there is no significant correlation at a 95% level between CH4 and CH3OH and CO ( below 0.1) and at best a weak correlation between CH4 and CO2 ( = 0.27). There is also no correlation between CH4 abundances and any of the three CO components as defined by Pontoppidan et al. (2003), with the different components corresponding to pure CO and CO in a H2O and CO2 rich ice respectively.
3.4 Spatial trends
The average CH4 abundance relative to H2O and its standard deviation is shown for all clouds with more than one detection and for the entire sample in Table 3. The averages for the individual clouds range from 2.8% to 9%, with Serpens and Ophiucuhs at 9 and 8% respectively. Whether the clouds are significantly different in their CH4 abundances was evaluated using Analysis of Variance with the Statistics101 resampling software. Resampling is more robust than traditional statistical tests since there is no need to assume an underlying distribution, which is especially useful when the sample size is small. The test procedure starts with calculating the sum of the absolute deviations of the cloud averages from the sample average. The CH4 abundances in the five clouds are then randomly resampled into five new groups with the same group size distribution as before and the absolute deviations of the group averages from the sample average is re-calculated. This is repeated 1000 times and the number of times the resampled sum of deviations exceeds the sum of deviations of the cloud averages is counted. The nul-hypothesis that the difference between the clouds is due to chance could then be rejected with 95% confidence. If Ophiuchus is removed from the sample there are no longer any significant differences between the clouds.
| Cloud | Number of sources | Average | St. dev. |
|---|---|---|---|
| Perseus | 6 | 0.040 | 0.014 |
| Ophiuchus | 6 | 0.083 | 0.019 |
| B59 | 2 | 0.027 | – |
| CrA | 3 | 0.052 | 0.019 |
| Serpens | 2 | 0.093 | – |
| All | 19 | 0.058 | 0.027 |
4 Discussion
4.1 Low vs. high mass YSOs
For comparison the solid CH4 abundances with respect to H2O for several high mass YSOs (Table 1) were re-derived and plotted relative to H2O abundances from Gibb et al. (2004) in Fig. 4. These sources have been previously investigated for solid CH4 by Boogert et al. (1996) and Gibb et al. (2004). The solid CH4 abundances derived here are 30 to 60% higher than those published by Gibb et al. (2004) mainly due to a difference in band strength (7.3 molecules cm-1 by Gibb et al. (2004) and 4.7 molecules cm-1 here). The plot shows that the high mass ISO CH4 sources fit in seamlessly with the low mass CH4 sources with H2O column densities above 2 cm-2. Figure 5 also shows that there is a similar variation in the 7.7 m feature profile between low and high mass objects. There is hence no reason to expect large systematic differences in CH4 abundances or formation pathways toward low and high mass YSOs.
4.2 Formation scenarios
The similar or higher abundance of CH4 with respect to H2O toward the low mass sources in this sample compared to what has been found previously toward high mass young stellar objects, suggests that the CH4 formation rate is not dependent on stellar UV irradiation. Of the three formation scenarios for CH4 suggested in the introduction, this study hence does not support a formation pathway connected to stellar UV processing of CH3OH. Furthermore, in the sources with 2–40 cm-2 H2O the CH4 abundance is nearly constant. In comparison the CH3OH abundances vary by a factor of 10 and it seems unlikely that this would be the outcome if the main formation pathway of CH4 is connected to CH3OH through e.g. cosmic-ray induced UV processing of CH3OH, which is also present under quiescent conditions.
Of the two remaining scenarios, formation in the gas phase with subsequent freeze-out and hydrogenation of C on grain surfaces, this study lends most support to the latter mechanism. First, under quiescent conditions, gas phase models predict steady state total CH4/H2 abundances of only around 10 (Woodall et al., 2007; Bergin et al., 1995), compared with our inferred CH4/H2 abundances of (assuming a standard H2O/H2 ratio of 10-4). In early times when C/CO1, the CH4/H2 can reach above 10-6 (Millar et al., 1991). Ices cannot form at extinctions lower than AV, however (Cuppen & Herbst, 2007). At extinctions higher than 2 AV, C/CO1 and hence freeze-out of the high CH4 abundances at early times cannot be used to explain the high ice abundances. In addition, pure CH4 has a similar volatility to CO, within a few degrees (Collings et al., 2004), and if both are formed in the gas phase and subsequently frozen out, the two molecules should correlate, both in absolute column densities and in abundances relative to the much less volatile H2O. This study clearly shows that this is not the case.
This weak correlation between CO and CH4 can be contrasted with the stronger correlations between CH4 and CO2 and H2O column densities. Furthermore the lack of significant correlation with any species once the correlation with H2O has been effectively divided out, by normalizing with the H2O column densities, shows that CH4 is not significantly better related to any other molecule than to H2O. Together this suggests a formation scenario of CH4 more related to H2O and CO2 formation, which both form on grains, rather than to CO. In theory the correlations could be single-handedly due to the fact that CH4 has a higher desorption temperature than in its pure form due to mixing with H2O. This, however, is only expected to occur if CH4 is formed together with H2O and hence CH4 formation on grain surfaces is still the most plausible outcome of this study.
The hydrogenation scenario is also supported by the broad profiles of the features which have only been found in laboratory spectra when CH4 is in a mixture with hydrogen bonding molecules, which are believed to form on grain surfaces. These conclusions are in agreement with studies of the solid CH4 profiles toward high mass YSOs, which show that solid CH4 is mixed with H2O or possibly CH3OH (Boogert et al., 1997) and also with the observed low gas/solid ratio of CH4 compared to CO (Boogert et al., 2004a).
4.3 Differences between clouds
Figure 4 and Table 3 shows that the CH4 abundances differ from cloud to cloud. In Fig 4, 4 of the 5 sources with high CH4 abundances and H2O column densities below 2 cm-2 are Ophiuchus sources (the fifth is in Serpens). The two Ophiuchus sources that have higher H2O ice abundances also have more ’normal’ CH4 abundances. This indicates that it is the low total column density towards four of the Ophiuchus sources rather than initial conditions in Ophiuchus as a whole that is responsible for the extreme CH4 abundances found there. This may be due to that towards sources with low total column densities the C/CO ratio may be larger allowing for more CH4 to form. The C/CO ratio is dependent on extinction for low extinctions, but not for high ones. This is consistent with our observation that CH4 abundances are only dependent on total column densities for low column densities. Sakai et al. (ApJ in press) have instead suggested that different CH4 abundances could be due to different collapse times. In clouds that collapse very fast, chemical equilibrium may not be reached favoring a C-based rather than CO-based chemistry. This question can only be settled if gas phase data for these sources become available.
4.4 Comparison with models
Solid CH4 abundances have been modelled previously for a variety of conditions (Hasegawa et al., 1992; Aikawa et al., 2005). The predicted CH4 ice abundances with respect to H2O usually vary between 1–10%, with the main formation path being sequential hydrogenation of C atoms on grains at a time when a large fraction of the gas phase C has already been converted to CO, i.e. C/CO1. The observed abundances in our sample fall mostly within this range and are hence in general agreement with the models.
Aikawa et al. (2005) model molecular abundances on grain surfaces and in the gas phase during the collapse of a spherical cloud. Regardless of initial conditions and the central density when the collapse is stopped, the CH4/H2O and CH4/CO2 ice ratios are fairly constant as a function of radius in the cloud. The value of CH4/H2O ratio varies with initial conditions between a few and 10%. In contrast the CH4/CO ratio is radius dependent. The model of Hasegawa et al. (1992) is more aimed at modelling interstellar clouds before collapse, but as they show the time evolution of the chemistry it may still be useful to compare with our observations. As in the collapse model, CH4, CO2 and H2O trace each other fairly well, while CO and CH4 are only correlated during some time intervals, regardless of initial conditions. Both these models are consistent with Fig. 6 where solid CH4 is better correlated with H2O and CO2 than with CO.
5 Conclusions
We present Spitzer-IRS spectra of the solid CH4 feature at 7.7 m toward a large sample of low mass young stellar objects. Our conclusions are as follows:
-
•
25 out of 52 low mass young stellar objects show a solid CH4 feature at 7.7 m.
-
•
The solid CH4 abundance with respect to H2O is centered at 5.8% with a standard deviation of 2.7% in the sources with CH4 detections. In the sources without detections the average upper limit is 15%, which is not significant compared with the detections.
-
•
The sources (two Ophiuchus and one Serpens) with more than 10% CH4 all have H2O column densities below 2 cm-2. Due to the low total column densities, two of these three sources have uncertainities larger than 50%. Above 2 cm-2 the sources (20 out of 25) have a fairly constant CH4 abundance of 4.71.6%.
-
•
The 7.7m feature profiles are signficantly broader for all but one object than expected for pure solid CH4 and toward most sources also broader than expected for CH4 in H2O dominated ices. Approximately 30% of the features have a blue wing, seen previously toward high mass YSOs and there attributed to solid SO2
-
•
The column densities of solid CH4 and H2O and CO2 are clearly correlated, while CH4 and CO and CH3OH are only weakly correlated.
-
•
There is also no correlation between the CH4 and CO abundances when both have been normalized to the H2O abundance.
-
•
The Ophiuchus cloud has significantly higher CH4 abundances compared to the rest of the sample, probably due to the low total column densities towards several of the sources. There are no significant differences between the remaining clouds.
-
•
The abundance variation is smaller for CH4 compared to solid CH3OH; CH4 seems to belong to the class of molecules, also including H2O and CO2 that appear ’quiescent’, i.e. their abundances are more or less constant, in contrast to highly variable ices like CH3OH and OCN-. If the Ophiuchus sources are included CH4 is somewhere between the two classes.
-
•
Sample statistics and comparison with model predictions support CH4 formation through hydrogenation of C on grain surfaces.
References
- Aikawa et al. (2005) Aikawa, Y., Herbst, E., Roberts, H., & Caselli, P. 2005, ApJ, 620, 330
- Alexander et al. (2003) Alexander, R. D., Casali, M. M., André, P., Persi, P., & Eiroa, C. 2003, A&A, 401, 613
- Allamandola et al. (1988) Allamandola, L. J., Sandford, S. A., & Valero, G. J. 1988, Icarus, 76, 225
- Allen & Robinson (1977) Allen, M. & Robinson, G. W. 1977, ApJ, 212, 396
- Bergin et al. (1995) Bergin, E. A., Langer, W. D., & Goldsmith, P. F. 1995, ApJ, 441, 222
- Boogert et al. (2004a) Boogert, A. C. A., Blake, G. A., & Öberg, K. 2004a, ApJ, 615, 344
- Boogert et al. (1998) Boogert, A. C. A., Helmich, F. P., van Dishoeck, E. F., Schutte, W. A., Tielens, A. G. G. M., & Whittet, D. C. B. 1998, A&A, 336, 352
- Boogert et al. (2004b) Boogert, A. C. A., Pontoppidan, K. M., Lahuis, F., Jørgensen, J. K., Augereau, J.-C., Blake, G. A., Brooke, T. Y., Brown, J., Dullemond, C. P., Evans, II, N. J., Geers, V., Hogerheijde, M. R., Kessler-Silacci, J., Knez, C., Morris, P., Noriega-Crespo, A., Schöier, F. L., van Dishoeck, E. F., Allen, L. E., Harvey, P. M., Koerner, D. W., Mundy, L. G., Myers, P. C., Padgett, D. L., Sargent, A. I., & Stapelfeldt, K. R. 2004b, ApJS, 154, 359
- Boogert et al. (1997) Boogert, A. C. A., Schutte, W. A., Helmich, F. P., Tielens, A. G. G. M., & Wooden, D. H. 1997, A&A, 317, 929
- Boogert et al. (1996) Boogert, A. C. A., Schutte, W. A., Tielens, A. G. G. M., Whittet, D. C. B., Helmich, F. P., Ehrenfreund, P., Wesselius, P. R., de Graauw, T., & Prusti, T. 1996, A&A, 315, L377
- Boogert et al. (2000) Boogert, A. C. A., Tielens, A. G. G. M., Ceccarelli, C., Boonman, A. M. S., van Dishoeck, E. F., Keane, J. V., Whittet, D. C. B., & de Graauw, T. 2000, A&A, 360, 683
- Brown et al. (1988) Brown, P. D., Charnley, S. B., & Millar, T. J. 1988, MNRAS, 231, 409
- Cernicharo et al. (2000) Cernicharo, J., Noriega-Crespo, A., Cesarsky, D., Lefloch, B., González-Alfonso, E., Najarro, F., Dartois, E., & Cabrit, S. 2000, Science, 288, 649
- Collings et al. (2004) Collings, M. P., Anderson, M. A., Chen, R., Dever, J. W., Viti, S., Williams, D. A., & McCoustra, M. R. S. 2004, MNRAS, 354, 1133
- Cuppen & Herbst (2007) Cuppen, H. M. & Herbst, E. 2007, ArXiv e-prints, 707
- Dartois et al. (2005) Dartois, E., Muñoz Caro, G. M., Deboffle, D., Montagnac, G., & D’Hendecourt, L. 2005, A&A, 432, 895
- Dartois et al. (1999) Dartois, E., Schutte, W., Geballe, T. R., Demyk, K., Ehrenfreund, P., & D’Hendecourt, L. 1999, A&A, 342, L32
- Evans et al. (2003) Evans, II, N. J., Allen, L. E., Blake, G. A., Boogert, A. C. A., Bourke, T., Harvey, P. M., Kessler, J. E., Koerner, D. W., Lee, C. W., Mundy, L. G., Myers, P. C., Padgett, D. L., Pontoppidan, K., Sargent, A. I., Stapelfeldt, K. R., van Dishoeck, E. F., Young, C. H., & Young, K. E. 2003, PASP, 115, 965
- Gerakines et al. (1996) Gerakines, P. A., Schutte, W. A., & Ehrenfreund, P. 1996, A&A, 312, 289
- Gerakines et al. (1999) Gerakines, P. A., Whittet, D. C. B., Ehrenfreund, P., Boogert, A. C. A., Tielens, A. G. G. M., Schutte, W. A., Chiar, J. E., van Dishoeck, E. F., Prusti, T., Helmich, F. P., & de Graauw, T. 1999, ApJ, 522, 357
- Gibb et al. (2004) Gibb, E. L., Whittet, D. C. B., Boogert, A. C. A., & Tielens, A. G. G. M. 2004, ApJS, 151, 35
- Gürtler et al. (2002) Gürtler, J., Klaas, U., Henning, T., Ábrahám, P., Lemke, D., Schreyer, K., & Lehmann, K. 2002, A&A, 390, 1075
- Hasegawa et al. (1992) Hasegawa, T. I., Herbst, E., & Leung, C. M. 1992, ApJS, 82, 167
- Hiraoka et al. (1998) Hiraoka, K., Miyagoshi, T., Takayama, T., Yamamoto, K., & Kihara, Y. 1998, ApJ, 498, 710
- Knez et al. (2005) Knez, C., Boogert, A. C. A., Pontoppidan, K. M., Kessler-Silacci, J., van Dishoeck, E. F., Evans, II, N. J., Augereau, J.-C., Blake, G. A., & Lahuis, F. 2005, ApJ, 635, L145
- Lacy et al. (1991) Lacy, J. H., Carr, J. S., Evans, II, N. J., Baas, F., Achtermann, J. M., & Arens, J. F. 1991, ApJ, 376, 556
- Markwick et al. (2000) Markwick, A. J., Millar, T. J., & Charnley, S. B. 2000, ApJ, 535, 256
- Millar et al. (1991) Millar, T. J., Bennett, A., Rawlings, J. M. C., Brown, P. D., & Charnley, S. B. 1991, A&AS, 87, 585
- Öberg et al. (2007) Öberg, K. I., Fraser, H. J., Boogert, A. C. A., Bisschop, S. E., Fuchs, G. W., van Dishoeck, E. F., & Linnartz, H. 2007, A&A, 462, 1187
- Pontoppidan et al. (2003) Pontoppidan, K. M., Dartois, E., van Dishoeck, E. F., Thi, W.-F., & d’Hendecourt, L. 2003, A&A, 404, L17
- Sandford & Allamandola (1993) Sandford, S. A. & Allamandola, L. J. 1993, Icarus, 106, 478
- Tielens & Hagen (1982) Tielens, A. G. G. M. & Hagen, W. 1982, A&A, 114, 245
- van de Hulst (1946) van de Hulst, H. C. 1946, Recherches Astronomiques de l’Observatoire d’Utrecht, 11, 2
- Woodall et al. (2007) Woodall, J., Agúndez, M., Markwick-Kemper, A. J., & Millar, T. J. 2007, A&A, 466, 1197
- Young et al. (2004) Young, C. H., Jørgensen, J. K., Shirley, Y. L., Kauffmann, J., Huard, T., Lai, S.-P., Lee, C. W., Crapsi, A., Bourke, T. L., Dullemond, C. P., Brooke, T. Y., Porras, A., Spiesman, W., Allen, L. E., Blake, G. A., Evans, II, N. J., Harvey, P. M., Koerner, D. W., Mundy, L. G., Myers, P. C., Padgett, D. L., Sargent, A. I., Stapelfeldt, K. R., van Dishoeck, E. F., Bertoldi, F., Chapman, N., Cieza, L., DeVries, C. H., Ridge, N. A., & Wahhaj, Z. 2004, ApJS, 154, 396