11email: halliday@arcetri.astro.it 22institutetext: Laboratoire AIM, CEA/DSM - CNRS - Universitè Paris Diderot, DAPNIA/SAp, Orme des Merisiers, 91191 Gif-sur-Yvette, France 33institutetext: Dipartimento di Astronomia, Alma Mater Studiorum, Universitá di Bologna, Via Ranzani 1, I-40127 Bologna, Italy 44institutetext: Max-Planck-Institut für Astronomie, Königstuhl 17, D-69117 Heidelberg, Germany 55institutetext: Osservatorio Astronomico di Padova, vicolo dell’Osservatorio 5, I-35122 Padova, Italy 66institutetext: National Optical Astronomy Observatory, 950 North Cherry Avenue, Tuscon, AZ 85719, USA 77institutetext: Dipartimento di Astronomia, Universitá di Padova, vicolo dell’Osservatorio 3, I-35122 Padova, Italy 88institutetext: Laboratoire d’Astrophysique de Marseille (UMR 6110), CNRS, Universitè de Provence, BP 8, 13376 Marseille Cedex 12, France 99institutetext: European Southern Observatory, Karl-Schwarschild-Str. 2, D-85748 Garching, Germany
GMASS Ultradeep Spectroscopy of Galaxies at z2. I. The stellar metallicity ††thanks: Based on observations obtained at the ESO Very Large Telescope (VLT) as part of the Large Programme 173.A–0687 (the Galaxy Mass Assembly ultradeep Spectroscopic Survey).
Abstract
Context. Galaxy metallicities have been measured to redshift z2 by gas-phase oxygen abundances of the interstellar medium using the R23 and N2 methods. Galaxy stellar metallicities provide crucial data for chemical evolution models but have not been assessed reliably much outside the local Universe.
Aims. We determine the iron-abundance, stellar metallicity of star-forming galaxies at redshift z2, homogeneously-selected and observed as part of the Galaxy Mass Assembly ultra-deep Spectroscopic Survey (GMASS).
Methods. We compute the equivalent width (EW) of a rest-frame mid-ultraviolet (mid-UV), photospheric absorption-line index, the 1978 Å index, found to vary monotonically with stellar metallicity by Rix, Pettini and collaborators (R04), in model star-forming galaxy (SFG) spectra created using the theoretical massive star models of Pauldrach and coworkers, and the evolutionary population synthesis code Starburst99. The 1978 Å index is sensitive to Fe III transitions and measures the iron-abundance, stellar metallicity. To accurately determine the 1978 Å index EW, we normalise and combine 75 SFG spectra from the GMASS survey to produce a spectrum corresponding to a total integration time 1652.5 hours (and a signal-to-noise ratio 100 for our 1.5 Å binning) of FORS2 spectroscopic observations at the Very Large Telescope.
Results. We measure a iron-abundance, stellar metallicity of log for our spectrum representative of a galaxy of stellar mass 9.4109 M⊙ assuming a Chabrier initial mass function (IMF). We find that the R04 model SFG spectrum for log solar metallicity provides the best description of our GMASS coadded spectrum. For similar galaxy stellar mass, our stellar metallicity is dex lower than the oxygen-abundance, gas-phase metallicity quantified by Erb and collaborators (E06) for UV-selected star-forming galaxies at .
Conclusions. We measure the iron-abundance, stellar metallicity of star-forming galaxies at redshift z2 by analysing the 1978 Å index in a spectrum created by combining 75 galaxy spectra from the GMASS survey. We find that our measurement is 0.25 dex lower than the oxygen-abundance gas-phase metallicity at similar values of galaxy stellar mass. We conclude that we are witnessing the establishment of a light-element overabundance in galaxies as they are being formed at redshift z2. Our measurements are indeed reminiscent of the -element enhancement seen in the likely progenitors of these starburst galaxies at low-redshift, i.e. galactic bulges and early-type galaxies.
Key Words.:
Methods: observational - Galaxies: abundances - Galaxies: evolution - Galaxies: formation - Galaxies: high-redshift - Galaxies: starburst1 Introduction
Galaxies are believed to form by the merging of dark matter haloes, the isolated collapse of a gas cloud and subsequent gas accretion, or a combination of these scenarios. Photometric and spectroscopic surveys measure the rate of galaxy mass assembly and the variation in galaxy star formation rates with redshift (Lilly et al. 1996; Madau et al. 1996; Giavalisco et al. 2004a; Cimatti et al. 2004).
Galaxies are unlikely to evolve as closed boxes but exchange gas, metals and stars with their environment. Following the early work of Larson (1974) cosmological models propose that mass outflows and winds driven by supernovae and AGN activity suppress star formation (via so-called “feedback”) increasingly effectively in galaxies of increasingly lower mass, and enrich the interstellar medium (ISM) with products of stellar nucleosynthesis (Springel & Hernquist 2003; Benson et al. 2003; De Lucia et al. 2004; Croton et al. 2006; Bower et al. 2006; Bertone et al. 2007; Finlator & Davé 2007). Such winds are required for example to prevent the overproduction of galactic low-mass stars and describe the observed metal-enrichment history of the Universe. In the local Universe and to a redshift of z2 a “mass-metallicity relation” is observed such that more massive star-forming galaxies are more metal-rich (Lequeux et al. 1979; Tremonti et al. 2004; Savaglio et al. 2005; Erb et al. 2006; Lee et al. 2006). Tremonti et al. (2004) (hereinafter T04) found a tight correlation between the gas-phase metallicity and stellar mass of 53,400 star-forming galaxies of redshift 0.005z0.25, using imaging and spectroscopic data from the Sloan Digital Sky Survey (SDSS). Their relation has a 1 scatter from the median of only 0.1 dex and is linear for stellar masses 8.5 log(M/M⊙) 10.5. At higher redshift Finlator & Davé (2007) were able to more accurately reproduce the gas phase mass-metallicity relation at z2 using “momentum-driven winds” (Murray et al. 2005; Oppenheimer & Davé 2006) instead of constant velocity winds traditionally proposed. “Momentum-driven winds” remove metals into the intergalactic medium by radiation pressure as photons are absorbed and scattered by dust, and supernovae and galactic winds. Unlike thermal energy, momentum cannot be radiated away and “momentum-driven winds” can transport metals to significant distances outside the galaxy.
Measuring galaxy metallicity as a function of redshift probes the rate of chemical enrichment. In the local Universe metallicity is measured using both spectroscopic absorption and emission lines. Gallazzi et al. (2005) found good agreement between stellar and gas-phase metallicities using SDSS galaxy spectra for which both absorption and emission lines were measurable. Faber and collaborators at Lick Observatory pioneered measurement of luminosity-weighted stellar age and metallicity of nearby early-type galaxies by developing the “Lick system” of spectroscopic absorption-line indices (Burstein et al. 1984; Faber et al. 1985; González 1993; Gorgas et al. 1993; Worthey et al. 1994; Worthey & Ottaviani 1997; Trager et al. 1998) for the rest-frame optical wavelength range 40006200Å, and the single-burst evolutionary population synthesis models of Worthey (1994). The “Lick system” was further developed by Trager et al. (2000) and Thomas, Maraston and collaborators (Thomas et al. 2003, 2004) to account for the effects of light-element overabundance ratios on Lick/IDS index measurements using respectively the empirical relations of Tripicco & Bell (1995), and the theoretical models of Maraston (2005) and calibrations of Korn et al. (2005).
At high-redshift emission lines are more readily detected than absorption lines and galaxy metallicity has been measured using primarily the oxygen-abundance, gas-phase metallicity of the ISM of star-forming galaxies, using the R23 (Pagel et al. 1979) and N2 (Storchi-Bergmann et al. 1994; Raimann et al. 2000) methods (Kobulnicky & Zaritsky 1999; Kobulnicky & Koo 2000; Carollo & Lilly 2001; Lilly et al. 2003; Kobulnicky & Kewley 2004; Shapley et al. 2004; Maier et al. 2005; Erb et al. 2006; Lamareille et al. 2006; Maier et al. 2006). At z1 the gas metallicity of the ISM has been constrained using the CIV1550 (Mehlert et al. 2002) and MgII and FeII absorption lines (Savaglio et al. 2004). Pettini and collaborators have measured the chemical abundances of the ISM using rest-frame UV absorption lines in a spectrum of the gravitationally-lensed Lyman- galaxy MS 1512-cB58 at redshift z2.73 (Pettini et al. 2002b) and damped Lyman- systems (Pettini et al. 2002a). Stellar metallicity data are required to fully test chemical evolution models. de Mello et al. (2004) provided a first constraint of stellar metallicity for a small sample of very massive () galaxies from the K20 survey (Cimatti et al. 2002; Daddi et al. 2004a). They showed tentative evidence for solar or supersolar metallicity but with large uncertainties due to limitations in the achieved S/N ratio. Rix et al. (2004) compared the iron-abundance, stellar metallicity for MS 1512-cB58 at z=2.73, and Q1307-BM1163 at z=1.411, with previously determined light-element abundances (magnesium, silicon and sulphur) and iron-abundance gas-phase metallicities of the ISM. For MS 1512-cB58, the iron-abundance, stellar metallicity is a factor of two higher than the light-element abundance gas-phase metallicities. The iron-abundance gas-phase metallicity is a factor of four lower than the light-element abundance metallicities: this is attributed to dust depletion of the ISM and the time delay in release of products of supernovae Ia (Pettini et al. 2002b). For Q1307-BM1163, the iron-abundance, stellar metallicity is a factor of two higher than the oxygen-abundance, gas-phase metallicity measured using the N2 method. Erb et al. (2006) compared two rest-frame mid-UV spectra (obtained for four of the six bins of stellar mass examined in their mass-metallicity relation analysis i.e. two lowest and two highest of six bins of mass) with star-forming galaxy spectra generated using the Starburst99 (Leitherer et al. 1999) model. Erb et al. (2006) found good agreement between the gas-phase metallicity oxygen abundance determined using the N2 method and the metallicity of the model spectrum that best described the rest-frame mid-UV spectra as judged by eye.
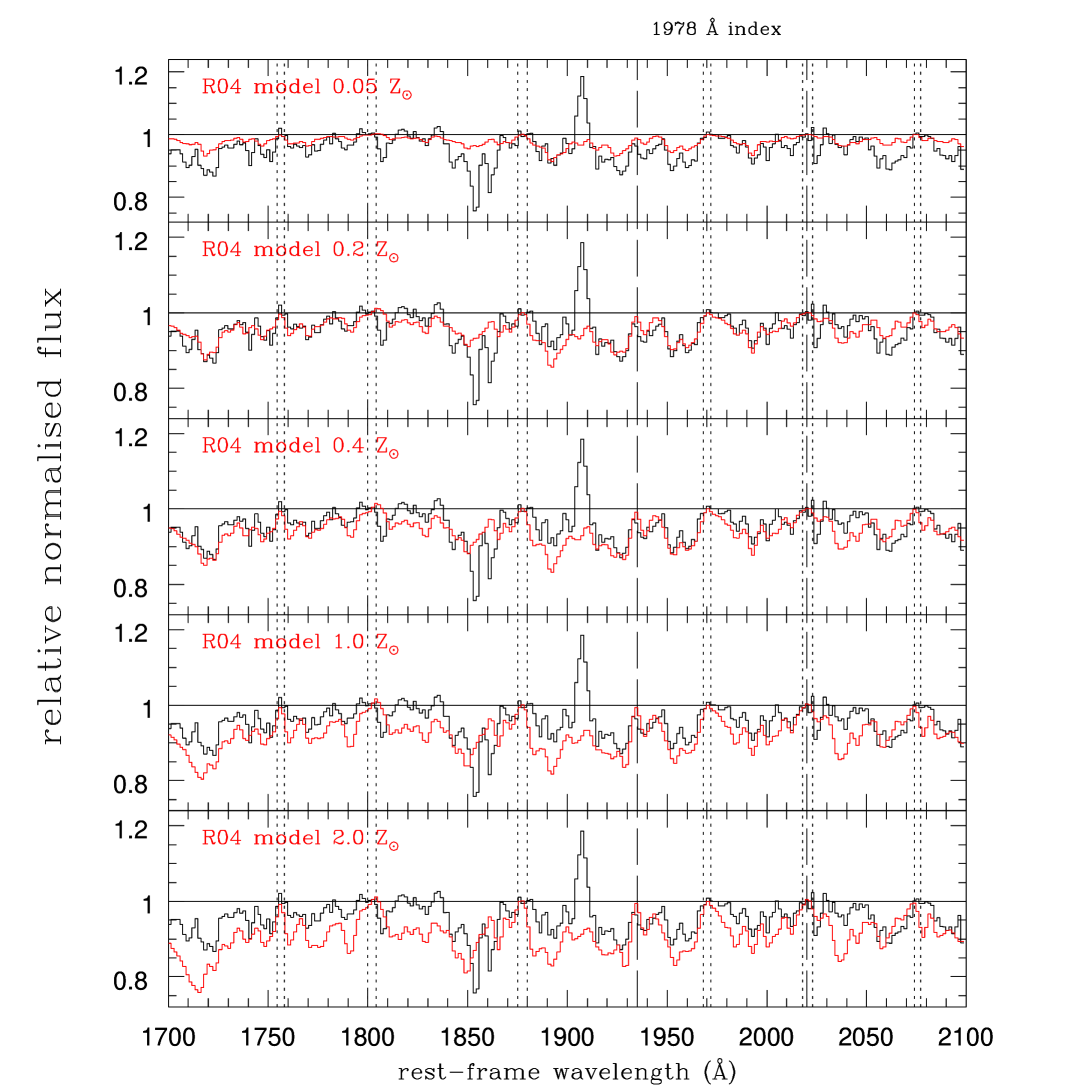
We present the first robust measurement of iron-abundance, stellar metallicity for mid-IR selected star-forming galaxies (SFGs) at z2. We measure a photospheric absorption-line index, defined by Rix et al. (2004) (hereinafter R04) in the rest-frame mid-ultraviolet galaxy spectrum (mid-UV) that is dominated by the light of massive stars. R04 modelled star-forming galaxy spectra using the evolutionary population synthesis models Starburst99 (Leitherer et al. (1999); hereinafter L99) and non-local thermal equilibrium (NLTE) stellar atmosphere models of OB stars (Pauldrach et al. 2001). Using stellar atmosphere models, the wavelength coverage of theoretical star-forming galaxy (SFG) models was extended redward to 2100 Å. Star-forming galaxy model spectra were generated for five values of metallicity, 0.05, 0.2, 0.4, 1.0, and 2.0 solar, assuming a continuous star formation history and a Salpeter IMF. R04 found that the equivalent width (EW) of an absorption-line system, centred on 1978 Å within an Fe III transition blend, varied monotonically with metallicity, after 100 Myr of star formation. They defined the EW of the “1978 Å index”, EW(1978), to have limits of 1935 Å and 2020 Å avoiding the Al III 1855, 1863 interstellar lines, the nebular emission line C III1909 and other weaker lines.
We measure the 1978 Å index in a spectrum created by adding 75 star-forming galaxy spectra from the Galaxy Mass Assembly ultradeep Spectroscopic Survey (GMASS) data corresponding to over 1652.5 hours of integration time with FORS2 at the VLT. Given the difficulty of measurement of the 1978 Å index and the limited range of galaxy stellar masses, we do not analyse spectra as a function of stellar mass. It would indeed be challenging to achieve this measurement for massive galaxies alone, because the most massive galaxies are fainter in the rest-frame mid-UV (e.g. Daddi et al. 2004a; Kong et al. 2006) and they are of course rarer (cf. Figure 2).
In Section 2 we provide a brief description of the GMASS survey. In Sections 3 and 4, we describe respectively, the selection of, and the combination of GMASS star-forming galaxy spectra. In Section 5 we outline the measurement of the 1978 Å index and its error, and contrast our observed data with the R04 star-forming galaxy model spectra. In Section 6 the 1978 Å index measurement is compared with predictions of galaxy stellar and gas metallicity from the cosmological simulations of Finlator & Davé (2007), and the oxygen-abundance gas-phase metallicities of Erb et al. (2006) and we briefly discuss our results and conclusions.
We use AB photometric magnitudes, and assume a WMAP cosmology with , and H0[km s-1 Mpc-1] (Spergel et al. 2003). We assume a Chabrier initial mass function (IMF) (Chabrier 2003) from 0.1 to 100 . Whether the IMF is universal between galaxies and at different redshift is a subject of ongoing debate. The empirical measurement of the Galactic IMF is not well determined and the uncertainty increases for the individual kinematical components (disk, bulge and thick disk) of the Galaxy (Chabrier 2003), and to high-redshift. For a review of the observational constraints provided by measurement of the mass-to-light ratios of nearby galaxies, the redshift evolution of the Fundamental Plane and galaxy cluster, element-abundances, see Renzini (2005). In this paper, the Chabrier IMF is chosen to provide a reference for all data shown and our conclusions are independent of this choice.
2 The GMASS Survey
GMASS (“Galaxy Mass Assembly ultra-deep Spectroscopic Survey” 111http://www.arcetri.astro.it/cimatti/gmass/gmass.html) is an ESO VLT Large Program project based on data acquired using the FORS2 spectrograph. A complete description of GMASS photometric observations, source detection, target selection, determination of photometric redshifts, mask preparation and spectroscopic observations and data reduction are provided by Kurk et al. (in preparation).
The project’s main science driver is to measure the physical properties of galaxies at redshifts a critical range in the mass assembly of massive galaxies. Spectroscopy allows the measurement of reliable galaxy redshifts, stellar masses, star formation rates and metallicities. The uniqueness of GMASS is its 4.5m selection that provides two major benefits: (1) it detects the peak of the stellar SEDs (for m) redshifted into the 4.5m band for , and (2) it is sensitive to the rest-frame mid-IR emission, i.e. to stellar mass, up to z3. The stellar mass completeness limits are (M/M 9.8, 10.1, and 10.5 for , , and , respectively (for and a Chabrier IMF). These mass limits allow mass assembly to be tracked for the precursors of today’s massive galaxies to the most massive galaxies at .
GMASS target selection was completed for the GOODS-South field222http://www.stsci.edu/science/goods from a region of arcmin2 chosen to match the FORS2 spectrograph field-of-view. All sources with Spitzer Space Telescope + IRAC data (Dickinson et al. in preparation), were selected to a limiting magnitude of (2.3 Jy). Finally a cut in photometric redshift of and two cuts in the optical magnitudes (, ) were applied.
Spectroscopic observations were completed for integration times of up to 32 hours, using either the blue 300V grism (for observed wavelengths 4000–6000 Å), or the red 300I grism (6000–10000 Å) depending on target photometric properties. The spectroscopic slit width was 1 arcsecond. Overall the GMASS survey had an excellent spectroscopic redshift measurement success rate of 85%. For objects without GMASS spectroscopic redshifts we adopted data from the literature where available, or photometric redshifts derived from our analysis using the publicly available optical (HST+ACS) (Giavalisco et al. 2004b), near-IR (VLT+ISAAC) (Retzlaff et al. in preparation) and IRAC images of the GOODS-South field (Dickinson et al. in preparation).
3 Selection of galaxy spectra
Specifically for the present analysis, all spectroscopic data collected for the GMASS survey were visually classified as passive galaxy, star-forming galaxy or stellar spectra, or (if a spectrum had too low signal-to-noise) to have an uncertain spectral type.
A spectrum was introduced into our analysis if classified as a star-forming galaxy (SFG) spectrum and if its rest-frame wavelength range included 1700-2100 Å. In Figure 2 we present the distribution of redshifts, KS apparent magnitudes and galaxy stellar masses of the 75 GMASS spectra selected. In Figure 1 we show a typical SFG spectrum created by simply average-combining all 75 GMASS SFG galaxy spectra chosen.
In Table 1, we indicate the median physical properties of the 75 selected galaxies i.e. for photometric data from the GOODS project, the apparent and photometric magnitudes derived using HST ACS imaging for the filters F435W (bgoods), F606W (vgoods), F814W (igoods), and F850LP (zgoods) respectively (Giavalisco et al. 2004b), the photometric magnitude, and absolute and magnitude; photometric and spectroscopic redshift; the best-fit galaxy age in Gyr, star formation rate in solar masses per year, dust extinction in magnitudes, and stellar mass in solar masses. Galaxy stellar mass, age, star formation rate, and dust extinction were measured by fitting the evolutionary population synthesis models of Bruzual & Charlot (2003) to galaxy spectral energy distributions SEDs inferred from photometric data gathered for GMASS. The model assumptions were a Chabrier IMF, solar metallicity, and a star formation rate (SFR) proportional to where is the star formation characteristic timescale, and the time elapsed since the onset of the current episode of star formation (Pozzetti et al. in preparation).
| bgoods | vgoods | igoods | zgoods | J | H | Ks | absB | absI | absK | zphot | zspec | age(Gyr) | AV | SFR(M⊙/yr) | Mass(M⊙) |
|---|---|---|---|---|---|---|---|---|---|---|---|---|---|---|---|
| 24.63 | 24.41 | 24.02 | 23.82 | 23.34 | 23.16 | 22.87 | -21.44 | -21.96 | -22.29 | 1.91 | 1.88 | 0.18 | 0.80 | 26.58 | 8.32109 |


4 Coaddition of star-forming galaxy spectra
To be able to measure the 1978 Å index and the galaxy iron-abundance, stellar metallicity, we carefully normalised and combined all 75 SFG spectra selected in Section 3.
For all observed wavelengths, the flux-calibrated intensity of each spectrum was deredshifted to the galaxy rest-frame using the GMASS spectroscopic redshift, and then divided by the median value of flux. A spectrum was created for the wavelength range 1700-2100 Å by fitting a natural spline function at regular intervals of 1.5 Å. A linear function was then fitted to and divided into this spectrum to take out a remaining slope in the spectral shape.
Due to the wide range of signal-to-noise ratios of the 75 SFG spectra (because of the diverse range of galaxy magnitudes and colours) and to ensure the most precise 1978 Å index measurement, we optimised the signal-to-noise ratio of the coadded spectrum using weights. Each spectrum was “weighted” by a measure of its signal-to-noise ratio and, as a function of wavelength, by the relative contribution of background night sky to the spectrum flux. To assess the weight due to signal-to-noise ratio of each normalised spectrum, we calculated the semi-interquartile range (s.i.q.r.) of flux in the wavelength range 1920-2050 Å and then its quadrature, and subtracted in quadrature a term (0.03) estimated to represent the contribution of intrinsic spectrum shape to the calculated s.i.q.r. value. A background sky spectrum was obtained by average-combining rows containing predominantly sky spectra in a CCD galaxy spectrum image. At all wavelengths the background sky flux was divided by its median value. The weight applied to each individual spectrum during combination was the product of the inverse of this final background sky spectrum, and the inverse of the weight due to spectrum signal-to-noise ratio calculated as described above. A stellar mass of 9.4109 M⊙ was calculated for the final coadded spectrum by weighting the GMASS stellar mass for each of the 75 galaxies by the identical weights applied to each spectrum during spectrum combination.
5 Stellar metallicity measurement and error
The 1978 Å index has a typical EW of 2-7Å (Rix et al. 2004) and its measurement is easily affected by a few deviant pixels in particular inside the pseudo-continua wavelength intervals defined by R04. In this Section we describe the measurement of the stellar metallicity and its error, and assess the solidity of our results using independent methods.
Firstly however we consider the appropriateness of the R04 predictions for our observed data. The R04 empirical calibration between 1978 Å index EW and metallicity (Equation 8 of R04) is defined for specific model assumptions and a particular spectral resolution. The R04 models are applicable to galaxies that have been undergoing bursts of star-formation for 100 Myr, a reasonable assumption for star-forming galaxies at redshift 2 (Daddi et al. 2004b; Shapley et al. 2004; Erb et al. 2006). The rest-frame spectral resolution of the R04 model predictions is 2.5 Å; this differs significantly from our rest-frame spectral resolution of 3.8 Å FWHM.
To be able to reliably measure stellar metallicity we derived a new empirical calibration between the 1978 Å index and metallicity for our rest-frame spectral resolution of 3.8 Å FWHM. To bring each R04 model spectrum to our resolution, we convolved each spectrum with a Gaussian function of width 2.86 Å FWHM. We measured the 1978 Å index using an approach identical to the method described for our observed spectrum below in Section 5.1.
Our revision of the R04 calibration is identical in form to Equation 8 of R04 i.e.
| (1) |
but our values of the coefficients C and D are different i.e. for an EW(1978) 6.0 Å, we find C = 0.37 and D = 1.95. In Figure 3 we directly compare the original R04 1978 Å index - metallicity calibration, and our revised calibration. This figure illustrates that for a given EW(1978) measurement, our revised calibration implies a higher value of metallicity than the original R04 calibration. We use our revised calibration to determine the galaxy iron-abundance, stellar metallicity.

We remark that to ascertain our 1978 Å index EW and its error and complete Figures 4, 5 and 6, a small positive offset of 1 Å was applied to the dispersion axis of the coadded spectrum. This offset was necessary to optimise the match between our coadded spectrum and the R04 model spectra i.e. the wavelengths of the faint absorption-line spectrum inside 1935–2020Å. The offset is similar to our wavelength calibration uncertainty and corresponds to a subfraction of a pixel in the GMASS spectroscopic data. If the offset had not been applied our 1978 Å index measurement would have changed by far less than the error we estimate.
5.1 The 1978 Å index measurement
We measured the 1978 Å absorption-line index equivalent width (EW) as defined by R04 in our coadded spectrum using fixed limits of 1935 Å and 2020 Å and by fitting the continuum using 6 of the narrow (typically 3-5 Å wide) pseudo-continua intervals for the wavelength range 1700-2100 Å. For our 1978 Å index EW measurement of 3.72 Å our revised calibration implies an iron-abundance, stellar metallicity of 0.267 solar.
5.2 Fitting R04 model galaxy spectra
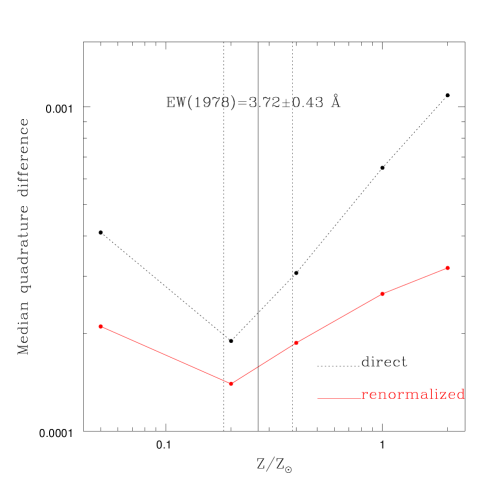
We independently determined the stellar metallicity by fitting the five R04 spectra (for metallicities of 0.05, 0.2, 0.4, 1.0, and 2.0 solar), broadened to match our rest-frame spectral resolution, to our coadded observed spectrum for the wavelength range 1935-2020 Å. In our so-called “renormalised method” we decided the best-fit R04 model spectrum by minimising the median of the quadrature of difference in flux between each broadened R04 model spectrum and our coadded spectrum. We minimised the median flux difference by multiplying the model spectrum by numbers between 0.9 and 1.1. We searched for the minimum of the quadrature of the median and not of the average because (i) the median is less sensitive than the average to deviant pixels, and (ii) we could not reliably measure error as a function of wavelength in our coadded spectrum (although to first order this should be fairly constant for our wavelength range of interest here). In our direct method we fitted each broadened R04 model spectrum without any multiplication by a constant. In Figure 5 we plot the quadrature of the median difference in flux for the two different fitting methods at each R04 model metallicity. Using both methods we find that the = 0.2 solar R04 broadened model spectrum provides the best description of our coadded spectrum. This is in good agreement with the iron-abundance, stellar metallicity measured using the 1978 Å index.
5.3 Robustness of the measurement and error
We assess the integrity of our stellar metallicity measurement and its error in different ways.
On close examination of Figure 5 it is seen that the faint absorption lines of our coadded spectrum are well reproduced by the R04 model spectra. This provides reassurance that the model spectra, broadened to match our spectra resolution, can be used to measure the galaxy stellar metallicity of our data.
The agreement between the two independent, best-fitting methods, completed in Section 5.2, implies that we are correctly and consistently assessing the continuum level of the coadded spectrum. This is critical because incorrect determination of the local (pseudo-)continua levels can be the main source of random and systematic error in the measurement of absorption-line equivalent widths.
We further remark that when applying the renormalised method in Section 5.2 the constant required to minimise the flux difference between coadded spectrum and model spectra (in cases of the 0.05, 0.2 and 0.4 solar metallicity models), modified the continuum level of the model spectrum by typically 0.6%. The coadded spectrum continuum level is being reproduced to at least this level. A conservative 1978 Å index error measurement would be 0.5 Å (the error corresponding to a shift of 0.6% in the level of the normalised coadded spectrum continuum).
In Section 5.2 and Figure 4 the quadrature of the median difference between the coadded spectrum and its best-fit model spectrum, corresponds to 1.2% of the coadded spectrum continuum level. This implies that the assessment of the continuum in the coadded spectrum (normalised using 6 R04 pseudo-continua intervals) is accurate to a level of 0.5%. Conversely the R04 model spectra are proven to reproduce an observed star-forming galaxy spectrum at the level of 1%.
Using the above results we conservatively assume that the noise of each bin of our coadded spectrum is 1% (implying a signal-to-noise ratio S/N of 100 per 1.5 Å rest-frame resolution element).
We determined the 1978 Å index error by simulating galaxy spectra affected by noise. As previously noted a major source of error in the 1978 Å index EW measurement is inaccurate assessment of the continuum level using local pseudocontinua either side of the main index passband. 1000 noise-affected galaxy spectra were created by adding random noise to the mean flux in each of the 6 R04 pseudocontinua wavelength intervals. The 1978 Å index was measured in each spectrum as described in Section 5.1. The standard deviation of the 1000 1978 Å index measurements was 0.43 Å. This was taken to be our index error and is very close to our independent assessments above. Using error propagation in Equation 1 this error corresponds to an uncertainty in metallicity of 0.159 dex: this is the metallicity errorbar plotted for our data in Figure 6.
Our measurement of stellar metallicity, derived using the 1978 Å index, and its corresponding error is 0.267 solar (log).
6 Discussion
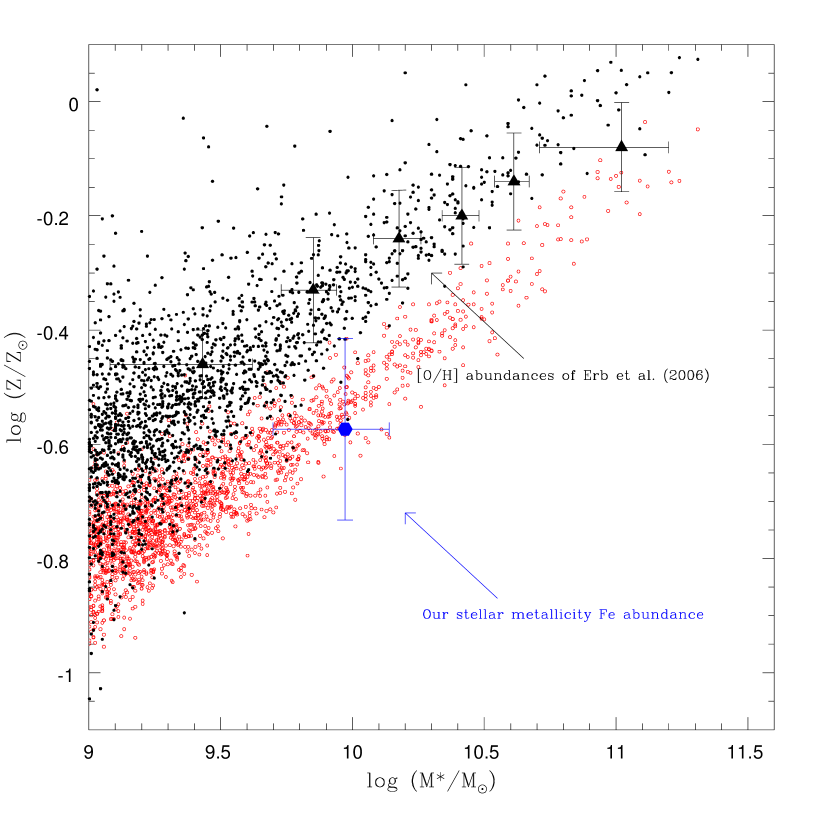
In Figure 6 we compare our measurement of galaxy iron-abundance, stellar metallicity, with the oxygen-abundance, gas-phase metallicity data of UV-selected star-forming galaxies from Erb et al. (2006, hereinafter E06), and the theoretical predictions of both galaxy gas-phase and stellar metallicity for different galaxy stellar masses from the cosmological simulations of Finlator & Davé (2007) (hereinafter FD07).The estimated error of the N2 method itself as indicated in Figure 3 of Erb et al. (2006) is approximately 0.05 dex. The solar oxygen abundance measurement of Asplund et al. (2004) has been subtracted in log-space from the oxygen-abundance gas-phase metallicities of E06; the stellar masses presented in E06 were calculated by assuming a Chabrier IMF.
Before venturing into interpreting Figure 6 we need to clarify that “metallicity” has a different meaning as measured by us, observed by E06 or calculated by FD07. In our case, the 1978 Å index measures a photospheric, Fe III absorption line of massive OB stars, i.e., of the most recent stars to have formed out of the ISM. The E06 measurement instead refers to the gas-phase oxygen abundance for UV-selected star-forming galaxies using the N2 method. Finally, the FD07 “metallicity” refers to the mass-averaged abundance of all the stars formed during the whole previous history of each galaxy, and corresponds to all heavy elements having assumed a global yield (). Thus the three metallicities refers to three different galactic components, and to three different elements or combination of elements. Moreover, the three metallicity determinations are derived from completely different procedures, each affected by its own different systematic errors. With this caveat in mind, we avoid overinterpreting the differences seen in Figure 6.
The 0.2 dex offset between the E06 oxygen abundance of the ISM and the average metal abundance of the stars of the FD07 simulated galaxies is qualitatively in agreement with the expectation. Indeed, the ISM metallicity results from the whole past metal enrichment, while the average stellar metallicity includes all previous, more metal poor stellar generations.
More intriguing is the difference between our estimate and that of either the ISM (0.25 dex) or the stars in the simulated galaxies (0.05 dex). Since we measure the metallicity in massive OB stars, one would expect it to be nearly identical to that of the ISM, given the short time elapsed since these stars formed (less than 10 Myr). However, assuming that this difference is real and not the effect of systematic error in the different methods, we must consider that the ISM metallicity is a measure of oxygen abundance, and our stellar metallicity is a measure of iron. As is well known, oxygen is produced only by massive stars exploding as Type II supernovae within at most few 10 Myr after formation, while iron is also produced by Type Ia supernovae that are characterized by an extremely wide distribution of formation-to-explosion delay times, from 10 Myr to more than 10 Gyr (e.g. Greggio 2005; Mannucci et al. 2005).
This different time behaviour of the two supernova types is understood to be responsible for the element enhancement (including the abundance of oxygen) seen in stellar systems that formed over a time short enough to correspond to a fraction of the SNIa distribution of delay times. Indeed, such element enhancements are observed in the metal poor stars of the Galactic halo (e.g. Wheeler et al. 1989; Cayrel et al. 2004), in metal poor and rich stars of the Galactic bulge (Zoccali et al. 2006; Fulbright et al. 2007), as well as in elliptical galaxies (e.g. Davies et al. 1993; Kuntschner 1998; Halliday 1999; Kuntschner 2000; Kuntschner et al. 2001; Morelli et al. 2004; Thomas et al. 2005). Since the star-forming galaxies we are studying are undergoing a starburst phase, the likely progeny of many if not most of them are bulges and early-type galaxies which in the local universe exhibit an enhancement, comparable to the 0.25 dex offset seen in Figure 6. Thus, taking this figure at face value, it suggests that we may be witnessing the enhancement being established among these galaxies.
The original low-redshift mass-metallicity relation of T04 lies 0.5 dex above the relation of E06. E06 also remeasured the oxygen-abundance, gas-phase metallicity using the N2 method for the same 53,400 galaxies studied by T04. They found a similar offset although narrower at higher stellar mass close to solar metallicity as the NII emission line used in the N2 method begins to saturate.
We note that the weighting scheme implemented, and the requirement of sufficient signal in the rest-frame UV to be able to measure a galaxy redshift, is biasing our measurement against the most reddened galaxies (and thus likely the most metal-rich). Although the long GMASS integration times of 15-20 hours are limiting this effect, still it might be expected that our result could be somewhat underestimating the true average metallicity of star-forming galaxies at the probed stellar masses (we note that the data of Erb et al. (2006) probably suffer an even stronger bias because of their UV-selection).
7 Conclusions
We have measured the iron-abundance, stellar metallicity of star-forming galaxies at redshift z2, for a spectrum created by adding together 75 star-forming galaxy spectra from the GMASS survey. The iron-abundance, stellar metallicity is determined by measuring the EW of a rest-frame mid-UV, photospheric absorption-line index, the 1978 Å index, defined by Rix et al. (2004) using the theoretical massive star models of Pauldrach et al. (2001), and the evolutionary population synthesis code Starburst99. We measure an iron-abundance, stellar metallicity of 0.267 solar (log). This is lower by 0.25 dex than the oxygen-abundance, gas-phase metallicity measured by Erb et al. (2006) for similar galaxy stellar mass and redshift. At least part of this difference may be the result of different systematic errors between the two estimates although both ourselves and Erb et al. (2006) find that systematic errors are very unlikely to reproduce our observed data results. We postulate that our measurements are reminiscent of the -element enhancement seen in the likely progenitors of these starburst galaxies, i.e. galactic bulges and early-type galaxies.
Acknowledgements.
This paper is dedicated to the memory of Professor Mario Perinotto. We thank the anonymous referee for constructive comments that helped improve the clarity of the manuscript. We are grateful to Max Pettini and Samantha Rix for providing the R04 models in digital form. We thank Kristian Finlator and Romeel Davé for providing their model predictions for the stellar and gas metallicity of galaxies. CH gratefully acknowledges the support and resources of IT Integration Engineering and the hospitality and resources of the University of Glasgow. ED is grateful to the Arcetri Observatory for hospitality during the development of this work.References
- Asplund et al. (2004) Asplund, M., Grevesse, N., Sauval, A. J., Allende Prieto, C., & Kiselman, D. 2004, A&A, 417, 751
- Benson et al. (2003) Benson, A. J., Bower, R. G., Frenk, C. S., et al. 2003, ApJ, 599, 38
- Bertone et al. (2007) Bertone, S., De Lucia, G., & Thomas, P. A. 2007, MNRAS, 379, 1143
- Bower et al. (2006) Bower, R. G., Benson, A. J., Malbon, R., et al. 2006, MNRAS, 370, 645
- Bruzual & Charlot (2003) Bruzual, G. & Charlot, S. 2003, MNRAS, 344, 1000
- Burstein et al. (1984) Burstein, D., Faber, S. M., Gaskell, C. M., & Krumm, N. 1984, ApJ, 287, 586
- Carollo & Lilly (2001) Carollo, C. M. & Lilly, S. J. 2001, ApJ, 548, L153
- Cayrel et al. (2004) Cayrel, R., Depagne, E., Spite, M., et al. 2004, A&A, 416, 1117
- Chabrier (2003) Chabrier, G. 2003, PASP, 115, 763
- Cimatti et al. (2004) Cimatti, A., Daddi, E., Renzini, A., et al. 2004, Nature, 430, 184
- Cimatti et al. (2002) Cimatti, A., Mignoli, M., Daddi, E., et al. 2002, A&A, 392, 395
- Croton et al. (2006) Croton, D. J., Springel, V., White, S. D. M., et al. 2006, MNRAS, 365, 11
- Daddi et al. (2004a) Daddi, E., Cimatti, A., Renzini, A., et al. 2004a, ApJ, 617, 746
- Daddi et al. (2004b) Daddi, E., Cimatti, A., Renzini, A., et al. 2004b, ApJ, 600, L127
- Davies et al. (1993) Davies, R. L., Sadler, E. M., & Peletier, R. F. 1993, MNRAS, 262, 650
- De Lucia et al. (2004) De Lucia, G., Kauffmann, G., & White, S. D. M. 2004, MNRAS, 349, 1101
- de Mello et al. (2004) de Mello, D. F., Daddi, E., Renzini, A., et al. 2004, ApJ, 608, L29
- Erb et al. (2006) Erb, D. K., Shapley, A. E., Pettini, M., et al. 2006, ApJ, 644, 813
- Faber et al. (1985) Faber, S. M., Friel, E. D., Burstein, D., & Gaskell, C. M. 1985, ApJS, 57, 711
- Finlator & Davé (2007) Finlator, K. & Davé, R. 2007, ArXiv e-prints, 0704.3100
- Fulbright et al. (2007) Fulbright, J. P., McWilliam, A., & Rich, R. M. 2007, ApJ, 661, 1152
- Gallazzi et al. (2005) Gallazzi, A., Charlot, S., Brinchmann, J., White, S. D. M., & Tremonti, C. A. 2005, MNRAS, 362, 41
- Giavalisco et al. (2004a) Giavalisco, M., Dickinson, M., Ferguson, H. C., et al. 2004a, ApJ, 600, L103
- Giavalisco et al. (2004b) Giavalisco, M., Ferguson, H. C., Koekemoer, A. M., et al. 2004b, ApJ, 600, L93
- González (1993) González, J. J. 1993, PhD thesis, University of California, Santa Cruz
- Gorgas et al. (1993) Gorgas, J., Faber, S. M., Burstein, D., et al. 1993, ApJS, 86, 153
- Greggio (2005) Greggio, L. 2005, A&A, 441, 1055
- Halliday (1999) Halliday, C. 1999, PhD thesis, University of Durham
- Kobulnicky & Kewley (2004) Kobulnicky, H. A. & Kewley, L. J. 2004, ApJ, 617, 240
- Kobulnicky & Koo (2000) Kobulnicky, H. A. & Koo, D. C. 2000, ApJ, 545, 712
- Kobulnicky & Zaritsky (1999) Kobulnicky, H. A. & Zaritsky, D. 1999, ApJ, 511, 118
- Kong et al. (2006) Kong, X., Daddi, E., Arimoto, N., et al. 2006, ApJ, 638, 72
- Korn et al. (2005) Korn, A. J., Maraston, C., & Thomas, D. 2005, A&A, 438, 685
- Kuntschner (1998) Kuntschner, H. 1998, PhD thesis, University of Durham
- Kuntschner (2000) Kuntschner, H. 2000, MNRAS, 315, 184
- Kuntschner et al. (2001) Kuntschner, H., Lucey, J. R., Smith, R. J., Hudson, M. J., & Davies, R. L. 2001, MNRAS, 323, 615
- Lamareille et al. (2006) Lamareille, F., Contini, T., Brinchmann, J., et al. 2006, A&A, 448, 907
- Larson (1974) Larson, R. B. 1974, MNRAS, 169, 229
- Lee et al. (2006) Lee, H., Skillman, E. D., Cannon, J. M., et al. 2006, ApJ, 647, 970
- Leitherer et al. (1999) Leitherer, C., Schaerer, D., Goldader, J. D., et al. 1999, ApJS, 123, 3
- Lequeux et al. (1979) Lequeux, J., Peimbert, M., Rayo, J. F., Serrano, A., & Torres-Peimbert, S. 1979, A&A, 80, 155
- Lilly et al. (2003) Lilly, S. J., Carollo, C. M., & Stockton, A. N. 2003, ApJ, 597, 730
- Lilly et al. (1996) Lilly, S. J., Le Fevre, O., Hammer, F., & Crampton, D. 1996, ApJ, 460, L1+
- Madau et al. (1996) Madau, P., Ferguson, H. C., Dickinson, M. E., et al. 1996, MNRAS, 283, 1388
- Maier et al. (2006) Maier, C., Lilly, S. J., Carollo, C. M., et al. 2006, ApJ, 639, 858
- Maier et al. (2005) Maier, C., Lilly, S. J., Carollo, C. M., Stockton, A., & Brodwin, M. 2005, ApJ, 634, 849
- Mannucci et al. (2005) Mannucci, F., Della Valle, M., Panagia, N., et al. 2005, A&A, 433, 807
- Maraston (2005) Maraston, C. 2005, MNRAS, 362, 799
- Mehlert et al. (2002) Mehlert, D., Noll, S., Appenzeller, I., et al. 2002, A&A, 393, 809
- Morelli et al. (2004) Morelli, L., Halliday, C., Corsini, E. M., et al. 2004, MNRAS, 354, 753
- Murray et al. (2005) Murray, N., Quataert, E., & Thompson, T. A. 2005, ApJ, 618, 569
- Oppenheimer & Davé (2006) Oppenheimer, B. D. & Davé, R. 2006, MNRAS, 373, 1265
- Pagel et al. (1979) Pagel, B. E. J., Edmunds, M. G., Blackwell, D. E., Chun, M. S., & Smith, G. 1979, MNRAS, 189, 95
- Pauldrach et al. (2001) Pauldrach, A. W. A., Hoffmann, T. L., & Lennon, M. 2001, A&A, 375, 161
- Pettini et al. (2002a) Pettini, M., Ellison, S. L., Bergeron, J., & Petitjean, P. 2002a, A&A, 391, 21
- Pettini et al. (2002b) Pettini, M., Rix, S. A., Steidel, C. C., et al. 2002b, ApJ, 569, 742
- Raimann et al. (2000) Raimann, D., Storchi-Bergmann, T., Bica, E., Melnick, J., & Schmitt, H. 2000, MNRAS, 316, 559
- Renzini (2005) Renzini, A. 2005, in Astrophysics and Space Science Library, Vol. 327, The Initial Mass Function 50 Years Later, ed. E. Corbelli, F. Palla, & H. Zinnecker, 221+
- Rix et al. (2004) Rix, S. A., Pettini, M., Leitherer, C., et al. 2004, ApJ, 615, 98
- Savaglio et al. (2004) Savaglio, S., Glazebrook, K., Abraham, R. G., et al. 2004, ApJ, 602, 51
- Savaglio et al. (2005) Savaglio, S., Glazebrook, K., Le Borgne, D., et al. 2005, ApJ, 635, 260
- Shapley et al. (2004) Shapley, A. E., Erb, D. K., Pettini, M., Steidel, C. C., & Adelberger, K. L. 2004, ApJ, 612, 108
- Spergel et al. (2003) Spergel, D. N., Verde, L., Peiris, H. V., et al. 2003, ApJS, 148, 175
- Springel & Hernquist (2003) Springel, V. & Hernquist, L. 2003, MNRAS, 339, 289
- Storchi-Bergmann et al. (1994) Storchi-Bergmann, T., Calzetti, D., & Kinney, A. L. 1994, ApJ, 429, 572
- Thomas et al. (2003) Thomas, D., Maraston, C., & Bender, R. 2003, MNRAS, 339, 897
- Thomas et al. (2005) Thomas, D., Maraston, C., Bender, R., & Mendes de Oliveira, C. 2005, ApJ, 621, 673
- Thomas et al. (2004) Thomas, D., Maraston, C., & Korn, A. 2004, MNRAS, 351, L19
- Trager et al. (2000) Trager, S. C., Faber, S. M., Worthey, G., & González, J. J. 2000, AJ, 119, 1645
- Trager et al. (1998) Trager, S. C., Worthey, G., Faber, S. M., Burstein, D., & Gonzalez, J. J. 1998, ApJS, 116, 1
- Tremonti et al. (2004) Tremonti, C. A., Heckman, T. M., Kauffmann, G., et al. 2004, ApJ, 613, 898
- Tripicco & Bell (1995) Tripicco, M. J. & Bell, R. A. 1995, AJ, 110, 3035
- Wheeler et al. (1989) Wheeler, J. C., Sneden, C., & Truran, Jr., J. W. 1989, ARA&A, 27, 279
- Worthey (1994) Worthey, G. 1994, ApJS, 95, 107
- Worthey et al. (1994) Worthey, G., Faber, S. M., Gonzalez, J. J., & Burstein, D. 1994, ApJS, 94, 687
- Worthey & Ottaviani (1997) Worthey, G. & Ottaviani, D. L. 1997, ApJS, 111, 377
- Zoccali et al. (2006) Zoccali, M., Lecureur, A., Barbuy, B., et al. 2006, A&A, 457, L1