Merging of globular clusters within inner
galactic regions.
II. The Nuclear Star Cluster formation
Abstract
In this paper we present the results of two detailed N-body simulations of the interaction of a sample of four massive globular clusters in the inner region of a triaxial galaxy. A full merging of the clusters takes place, leading to a slowly evolving cluster which is quite similar to observed Nuclear Clusters. Actually, both the density and the velocity dispersion profiles match qualitatively, and quantitatively after scaling, with observed features of many nucleated galaxies. In the case of dense initial clusters, the merger remnant shows a density profile more concentrated than that of the progenitors, with a central density higher than the sum of the central progenitors central densities. These findings support the idea that a massive Nuclear Cluster may have formed in early phases of the mother galaxy evolution and lead to to the formation of a nucleus, which, in many galaxies, has indeed a luminosity profile similar to that of an extended King model. A correlation with galactic nuclear activity is suggested.
1 Introduction
In the first paper of this series devoted to the study of the interaction of globular clusters (GCs) in triaxial galaxies, we analyzed the face-on collision between two GCs moving on quasi-radial orbits in the central galactic region, with the aim, also, to understand how effective is the tidal distortion. Our first finding was that the face-on collision is practically uneffective respect to the role of the external tidal field. Actually, the tidal erosion has been shown to be such to destroy loose GCs (initial King concentration parameter ) in few passages through the galactic centre, while tight cluster () keeps bound a substantial amount of their mass up to the complete orbital decaying. At this latter regard, another important result is that the orbital energy dissipation due to the tidal interaction is of the same order of that caused by dynamical friction. At the light of these results, and given that dynamical friction was shown to be important in segregating massive GCs in triaxial potentials (Pesce, Capuzzo-Dolcetta & Vietri 1992; Capuzzo-Dolcetta, 1993; Capuzzo-Dolcetta & Vicari, 2005), a natural further step in the present program of investigation is to study the possible merging of a set of GCs decayed in the central galactic region to see whether a sort of ‘super star cluster ’(SSC) results from the merging, and what its morphological and dynamical characteristics could be.
It is quite ascertained the existence of very bright (L⊙) clusters of stars in the central region of galaxies across the Hubble sequence thanks to VLT and HST observations (Walcher et al.,, 2005; van der Marel et al.,, 2007; Wehner & Harris,, 2006). On the basis of integrated colours and of the estimated ratios, these clusters are usually thought to be young or, at least, to contain a significant population of young stars. In any case, that of the age is a controversal point, because, for instance, the nuclear star clusters (NCs) in M82 show evidence for mass segregation despite their spectra are well fitted by stellar population synthesis models with ages – Myr (McCrady,, 2004). Böker et al., (2004) fitted analytical models to Hubble Space Telescope images of 39 NCs in order to determine their effective radii after correction for the instrumental point-spread function. They compared the luminosities and sizes of NCs to those of other ellipsoidal stellar systems, in particular the Milky Way globular clusters, finding for NCs a narrow size distribution statistically indistinguishable from that of Galactic GCs, even though the NCs are, on average, 4 mag brighter than the old GCs. They discuss some possible interpretations of the similarity among NCs and Galactic GCs and, from a comparison of NCs luminosities with various properties of their host galaxies, find that more luminous galaxies harbor more luminous NCs. It remains unclear whether this correlation reflects the influence of galaxy size, mass, and/or star formation rate.
However, Rossa et al., (2006), by means of spectroscopic HST/STIS data, derived NCs ages for 19 galaxies and found that they range from 10 Myr to 10 Gyr, with a non negligible presence of old clusters. A comparable result has been deduced also for 9 NCs of very late-type, bulge-less spirals, by Walcher et al., (2006) by means of a high-resolution spectroscopic survey with VLT/UVES.
Genzel et al., (2003), in their study of the stellar cuspy distribution around the Supermassive Black Hole (SBH) in the Galactic center, found that the K-band luminosity function of the local NC (within 9” of Sgr A*) resembles that of the large-scale Galactic bulge except for showing an excess of stars at . It fits with population synthesis models of an old, metal-rich stellar population with a contribution from young, early, and late-type stars at the bright end. In the central arcsecond, they argued that a stellar merger model is the most appealing explanation. These stars may thus be “super blue-stragglers”, formed and “rejuvenated” through mergers of lower mass stars in the very dense ( pc-3) environment of the cusp.
Another intriguing piece of the puzzle of the structure of SSCs is given by Baumgardt et al., (2003). Through a comparison between the observational data on the kinematical structure of the very bright cluster G1 in M31 —obtained with the HST WFP Camera 2 and Space Telescope Imaging Spectrograph instruments— and their results of dynamical simulations carried out using the special purpose computer GRAPE-6, they obtained very good fits when starting simulations with initial conditions extracted from the end product of a previous simulation concerning a merging between two pre-existent star clusters. The merging explains observed features without the need to invoke the presence of an intermediate-mass black hole in the center of G1.
Not many simulations have been presented in the literature that study the possible formation scenarios for SSCs. Among these, we remind those by Fellhauer & Kroupa, (2002, 2005) finding that star clusters aggregates, like the ones found in the Antennae or Stephan Quintet, are very likely the merger progenitors of SSCs. Interestingly enough, these authors also find that the resulting SSC is a stable and bound object, whose density profile is well fitted by a King profile, even if the mass loss of the merger product occurs through every perigalacticon passage.
2 Globular cluster merging and galactic nuclei
The increasing amount of data about massive clusters in galaxies, together with that of GC systems in galaxies, especially of early type but also for spirals (Harris,, 1986, 1991; Ashman & Zepf,, 1998; Harris,, 2001, etc.) makes interesting the investigation, started in the first paper of this series (Miocchi et al.,, 2006, hereafter Paper I), of the fate of massive GCs moving in the parent galaxy field, subjected to dynamical friction braking and tidal interaction. In Paper I we studied the dynamical evolution of two GCs with mass M⊙ moving on quasi radial orbits in a triaxial galactic potential, following eight passages across the galactic center. The scope of that paper was to investigate the chances of survival of GCs to possible tidal disruption induced both by the external field and by mutual cluster-cluster interaction; with this aim, we maximized these effects by giving the clusters initial conditions corresponding to quasi-radial orbits.
In this Paper II, we have another aim, that is to study whether and how the merging of various massive GCs decayed by dynamical friction in the inner galactic region may occur. The main questions to answer are: (i) given some (realistic) initial conditions for a set of GCs which experienced a significant orbital decay, are they undergoing a full merge? (ii) if so, what is the time needed? (iii) what is the final structure of the merged NC? (iv) does it attain a quasi-steady state?
The answers to these questions are of overwhelming importance to give substance to the interpretation of the formation of early type galaxy nuclei via merging of decayed GCs, a hypothesis raised first by Tremaine et al., (1975) and subsequently extensively studied by Capuzzo-Dolcetta, (1993); Capuzzo-Dolcetta & Tesseri, (1997, 1999); Capuzzo-Dolcetta & Vicari, (2005).
This scenario of galactic nuclei formation has been raised again recently, due to the independent and almost contemporaneous findings that NC masses obey to similar scaling relationships with host galaxy properties as SBHs do (see Rossa et al., 2006 for spirals; Wehner & Harris, 2006 for dwarf elliptical [dE] galaxies and Côtè et al., 2006 for elliptical galaxies). In particular, Côtè et al., (2006) give evidence, in early-type galaxies in the Virgo cluster, of NC luminosity distributions that are much better fitted by an extended profile (King’s) rather than by a point source (see Böker et al., 2002 for a similar finding in late-type spirals and Graham & Guzmán, 2003 for dE galaxies in the Coma Cluster). The half mass radii of nuclei () are in the range (pc) , with pc and correlate with the nucleus luminosity: . The mean of the frequency function for the nucleus-to-galaxy luminosity ratio in nucleated galaxies, is indistinguishable from that of the Super Massive BH-to-bulge mass ratio, , calculated in 23 early-type galaxies. On these bases, Côtè et al., (2006) argue that resolved stellar nuclei are the low-mass counterparts of nuclei hosting SBHs detected in the bright galaxies. If this view is correct, then one should think in terms of central massive objects, either SBHs or SSCs, that accompany the formation and/or early evolution of almost all early-type galaxies.
It is clear that these characteristics of galactic nuclei well fit into a scenario of multiple GC merging in the inner galactic regions (that we call “dissipationless” scenario) as alternative to the “dissipational” scenario, this latter being based mainly on speculative hypotheses (see, e.g., van den Bergh,, 1986; Silk et al.,, 1987; Babul & Rees,, 1992) supported by some quantitative results (Mihos & Hernquist,, 1994). The proof of the validity of the “dissipationless” hypothesis requires, at first, a detailed -body simulation of the interaction of stellar clusters in the inner region of their parent galaxy, taking into account both the cluster-cluster and the cluster-galaxy dynamical interaction. This latter includes tidal distortion, acting on the cluster internal motion, and dynamical friction, acting on the cluster orbital motion.
In this context, we cite the encouraging results of the numerical simulations made by Oh & Lin, (2000) who revisited the hypothesis of dE nuclei formation through the orbital decay of GCs and suggested that this occurs mainly in galaxies with a relatively weak extragalactic tidal perturbation, leading to the formation of compact nuclei within a Hubble timescale. They also show that the central galactic field does not destroy the integrity of the clusters and facilitates the merging to occur. Moreover, they find that the observed central structures of some nucleated Virgo Cluster dEs are well reproduced by superimposing a small number of globular clusters to the galactic stellar distribution. Nevertheless, Oh & Lin, used a very small number of particles ( in each cluster) to simulate the final merger stage, during which they neglected the role of dinamical friction, as well. Thus, their results could be affected by spurious collisional effects, even though a rather large smoothing radius was adopted in the inter-particle interactions.
More recently, Bekki et al., (2004) show how the formation of NCs via multiple merging of GCs, leads to systems with global scaling relations which are compatible with those observed for galactic nuclei. Unfortunately, as mentioned before, these results cannot be considered conclusive because in these authors’ simulations the, important, role of the external field was neglected.
3 The simulations
We consider GCs as -body systems moving within a triaxial galaxy represented by an analytical potential, subjected also to the deceleration due to dynamical friction (hereafter df). To keep a high level of resolution in the simulations (i.e., a large number of particles to represent each GC without exceeding computational capabilities, we decided to limit our study to the interaction of a limited number, four, of GCs.
We studied the merging process of these GCs, as if they were already decayed to the inner region of the galaxy, in two separate simulations (cases 1 and 2). A quick orbital decay induced by df is due to initial large values for the total mass of the clusters. These large masses are compatible with those of many young GCs actually observed in various galaxies (e.g., Kissler-Patig et al.,, 2006, and references therein), see Paper I for a deeper discussion. The 4 clusters are labeled (a1), (b1), (c1), (d1) in the case 1 and (a2), (b2), (c2), (d2) in the case 2. In the simulation of case 2, the 4 GCs have the same initial orbital conditions but their scaling parameters are such to give them less dense and more extended initial configurations (see also Table 1 and Sect.3.2).
Unless otherwise specified, the same units of measure used in Paper I are adopted in this paper: lengths, masses and time are measured, respectively, in unit of the galactic core radius , of the galactic core mass and of the galactic core-crossing time . Note that the actual physical values for these quantities are unrelevant because the results of simulations can be scaled as long as the 2-body stellar collisions are negligible; otherwise, the dynamics would obviously depend also on the mass of the individual star in the clusters.
As regards the computational techniques, we adopted an -body representation for the stars in the clusters, simulating their dynamics by means of the parallel ‘treeATD’ code (Miocchi & Capuzzo-Dolcetta,, 2002), whose main features were also described in Paper I.
3.1 The galactic model
We adopt the same galactic model used in the simulations of Paper I, i.e. the self-consistent triaxial model described in de Zeeuw & Merritt, (1983). It corresponds to a non-rotating ellipsoidal and triaxial distribution of matter oriented in such a way to have the longest and the shortest principal axis aligned with the coordinate axes and , respectively. The axial ratios are : : , leading to a projected profile in agreement with that observed in the spheroids of some spirals (see, e.g., Bertola et al.,, 1991; Matthews & de Grijs,, 2004) and in elliptical galaxies (see, e.g., Wagner,, 1988; Davies et al.,, 2001; Statler et al.,, 2004). The resulting potential can be expressed as the sum of a spherically simmetric density following the modified Hubble’s law
| (1) |
with scale parameters (core radius) and , plus other two non-spherical terms that give the triaxial behaviour (Schwarzschild,, 1979). The mass parameter is the mass enclosed in a radius slightly smaller than , in fact . The mass in the generic sphere of radius is contributed only by the spherically simmetric part, , of total density, giving:
| (2) |
that gives an infinite total mass. However, there is no need of a cutoff in the model, because only the gravitational potential (which is not divergent) is important for the purpose of our simulations.
As in Paper I, the reference frame has the origin at the galactic center and the and axes are, respectively, along the maximum and minimum axis of the triaxial ellipsoid. The centers-of-mass (CM) of the clusters were initially located well within the galactic core (see Table 3).
With regard to the df, we used the generalization to the triaxial case (see Pesce et al., 1992), of the Chandrasekhar formula (Chandrasekhar,, 1943), with a self-consistent evaluation of the velocity dispersion tensor, taking also into account that the GCs are extended objects. See Paper I for more details at this regard.
3.2 The cluster model
Our numerical study involved two sets of four clusters evolved in two separate simulations. The GCs initial internal distribution was sampled from a stellar King, (1966) isotropic model with total mass , velocity parameter111Which is such that, at the center, , the approximation being as better as the model concentration is higher (Binney & Tremaine,, 1987, sect. 4.4c). , limiting and “King” radius and , respectively; is the concentration parameter, the half-mass crossing time and is the central density. The ‘limiting radius’ is the radius at which the King distribution function drops to zero, to reproduce the presence of the external field (King,, 1966). The initial values of these parameters are listed in Table 1.
Each cluster was represented with ‘particles’, whose individual masses were assigned according to a Salpeter’s mass distribution () cutted at and , with average , where is adjusted to give the desired cluster total mass (see Table 1). When simulating massive GCs, the assumption gives a high value of that shifts the chosen mass distribution in form of Salpeter law towards large masses so to lose its representativity for a real GC stellar mass spectrum. However, as discussed in Paper I, we use unequal mass particles to verify that no collisional relaxation takes place during the simulation, as demanded by the 2-body relaxation time of the clusters which is in any case longer than the time to merge.
Actually, even for the most compact case considered here (model (a1) see Table 1), the half-mass relaxation time of the simulated cluster is larger than the merging time (see Sect. 4) after which the clusters lose their individuality and evolve as a larger system (see discussion in Sect.6) The real cluster (with a larger number of stars) relaxation time is obviously longer than that of the simulated (sampled) cluster.
Were the GCs massive enough to decay rapidly into the galactic core, it can be safely assumed (see also Paper I, sect. 2) that their age at the beginning of the simulation is less than their internal 2-body relaxation time, so that mass segregation has not occurred and, thus, it was not included in the initial stellar distribution.
In the following, we often refer to the system center-of-density (CD) – i.e. the average particle position weighted with the local density instead of the mass – as defined in Casertano & Hut, (1985). As in Paper I, in most cases we took the CD as the origin of the best suitable reference frame for the study of the internal system properties.
4 Results
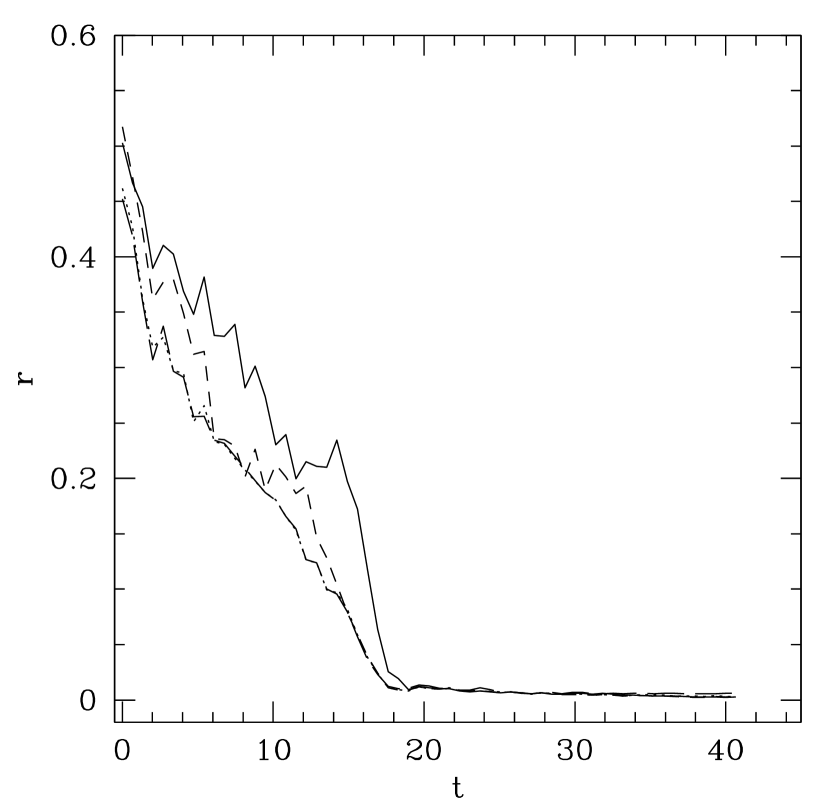
In spite that the true conserved quantity, in absence of any external dissipation, is the center-of-mass orbital energy, it is preferable to refer to the CD orbital energy instead, because the CD identifies better the actual GC location when the outer part of the cluster is highly distorted and dispersed. Defining as the orbital energy (per unit mass) of the cluster CD, its dissipation due to both the df braking effect and to the tidal interaction with the environment, can be quantified by the following parameter (Paper I):
| (3) |
where is the central galactic potential well. In Fig. 3, is plotted for all the clusters in the two cases studied.
The merging occurs rather quickly, as it is indicated by the snapshots of the system as projected onto one of the coordinates plane (see Fig.s 1 and 2 for the case 1) and clearly seen from the time behaviour of the Lagrangian radii of the whole system (Fig. 4). Lagrangian radii attain steady values at a “merging” time of about , when also the innermost radius shown stabilizes; note, that the inner is the Lagrangian radius, the later is the time at which the stable state is achieved. A similar merging time can be deduced also by the time behaviour of the distances of the clusters CD to the galactic center (Fig. 5).
Of course, the energy dissipation rate is closely related to the prescription adopted for the evaluation and treatment of df. For instance, our evaluation ( Paper I, Appendix A) could lead, in principle, to an overestimate of the effect, because we consider the cluster as a constant mass point222To partially overcome this problem we conservatively used a halved cluster mass as mass parameter in the df formula.. Obviously, df would be accounted for accurately when adopting a full -body representation of the galactic region in which GCs move; for this reason we are running a self-consistent simulation that we will present in a forthcoming paper. However, preliminary results show a clearly shorter orbital decaying time for the same clusters of case 1, but moving in a self-consistent representation of the same galaxy sampled by “particles”. This is shown by the time behaviour of the distance of the clusters CD from the galactic center depicted in Fig.6, from which a merging time is deduced, i.e. a factor smaller than in the simulations with the analytic df form. This finding agrees with some recent results that show how stars stripped from the cluster by the field, but still close enough to the system, continue to contribute to mass of the decelerating system (Fellhauer & Lin,, 2007). Moreover, recent fully self-consistent -body simulations confirm that the real df effect can be even stronger that that estimated by the usual Chandrasekhar formula (probably for the further friction due to tidal effects, see Fujii et al.,, 2007).
4.1 The NC morphology
To study the NC morphology, we evaluated the eigenvalues and the eigenvectors of the inertia tensor
| (4) |
with being the position vector of the -th particle, and the CD position. In Fig. 7, the square root of the eigenvalues are plotted as a function of time. They are evaluated considering, in Eq. (4), only particles closer than to the system CD, where is the half-mass radius of the NC at the end of the simulations. Since is equal to the length of the -th axes of the ellipsoid fitted to the matter distribution, then their ratios give a direct measure of the triaxiality of the system; e.g. if then the system is spherical.
It can be seen that, after the initial merging phase, the NC as a whole attains a stable configuration. Only in the case 2 (Fig. 7, upper panel) the system shape is moderately axisymmetric (oblate) and, by examining the orientation of the eigenvectors, it was found to have principal axes nearly aligned to those of the galactic potential, with axial ratios : : : : , and with nearly parallel to the -axis. This alignment suggests that the final morphology is influenced, to some extent, by the galactic morphology. Thus, it is not surprising that in the NC2 outskirts the stars tend, eventually, to move on orbits compatible with the underlying galactic triaxial configuration, as we will see from the velocity anisotropy (Sect. 4.1.2). Nevertheless, the self-gravity of the simulated system is important enough to make the shape of the NC2 closer to a spherical configuration than the galaxy. Accordingly, the configuration of the NC1 is almost spherical due to its stronger self-gravity (Fig. 7, lower panel).
4.1.1 Density profile
The radial density profile of the NCs, which we have seen to be quasi-spherical at the end of the merging, is plotted in Fig. 8, where, for comparison, the profile corresponding to the spatial superposition of the 4 progenitor clusters, in their initial configurations, is reported, too. This gives an immediate ‘visual’ indication of the efficiency of the merging process; the merging remnant density profile is even more concentrated than that given by the mere sum of the initial profiles of the four progenitors. Actually, the merger profile has a smaller core (showing a central density a factor higher) and a more extended envelope. In fact, it is remarkably well fitted by a high-concentration () King profile (see Fig. 8). This result — which agrees with what found in the different context of merging galaxies since the pioneering White, (1978) simulations — suggests that a sort of violent relaxation took place during the merging. This relaxation is likely due to the rapidly varying potential acting on each star of the clusters.
In the initial cluster models a stellar mass spectrum was included without mass segregation, in order to investigate possible relaxation phenomena due to either spurious collisional effects or induced by the external tidal field. The analysis of the behaviour of the average mass as a function of the distance from the center in the final NC configuration indicates no evidence of mass segregation, thus enforcing the above-mentioned hypothesis about the violent relaxation as a cause of the increased concentration of the merging product.
4.1.2 Velocity distribution
To compare our simulation results with observational data giving the radial profile of the line-of-sight velocity dispersion, we must evaluate the “total” velocity dispersion, , by properly accounting for the contribution of the underlying galaxy, this latter being given directly by the self-consistent model (according to the fitting formulae [A3] and [A4] in Paper I). Fig.9 shows clearly a behaviour of decreasing towards the galactic center, where the surface density of the NC dominates and thus lowers to the velocity dispersion of the NC, which is ‘colder’ than the host galactic core. The behaviour shown in Fig.9 may seem peculiar for a self-gravitating system, which normally keeps its equilibrium through a negative (or null, if isothermal) gradient of . This apparent peculiarity is due to that the central “observed” velocity dispersion is dominated by the NC which is not a self-gravitating system, indeed. This feature was actually found by a Keck II spectroscopic analysis (Geha et al.,, 2002, see their Fig. 5) for most of the Virgo cluster nucleated dEs of the sample. The same radial behaviour is also shown by the solution of the Jeans equations for a sample of NCs observed in late-type spirals (Walcher et al.,, 2005) and is also deduced on the basis of direct -body simulations by Oh & Lin, (2000) concerning GCs merging at the center of dEs. This latter simulation confirms the occurrence of a merging event within the central potential well of the host galaxy, even if care is due to the low number of particles that forces them to adopt a rather large gravitational smoothing radius, in order to suppress fictitious collisional effects.
As regards the velocity anisotropy, we studied the anisotropy parameters of the stellar velocity distribution in the NCs, as a function of the distance from the system CD, where and denote the azimuthal or the polar angle, respectively. These parameters are compared with those of the host galaxy.
We have found that NC1 has a nearly isotropic velocity distribution (), while the influence of the external galactic potential induces a (i.e. ) in the outer region () of the less compact NC2, which means that the velocity distribution in the outskirts is preferentially tangential and parallel to the plane, as in the galactic model. Noticeably, Geha et al., (2002) found that the decrease in the center of their observed nucleated dE can be reproduced, in most cases, by a model having a nearly isotropic or moderately tangential velocity distribution.
Another relevant parameter is the central value of , which is proportional to the density in the phase-space. Its value (see Table 2) in the merged systems is smaller than that of the four individual progenitor clusters; this corresponds to the, expected, rarefaction in the phase-space of the inner part of the system after the mutual interaction of the merging clusters and, mainly, that with the external field. This time-dependent interaction leads to a certain diffusion in phase space even if the four GCs constitute a collisionless systems. Note how the rise of the central space density respect to the linear summation of individual GC densities in the case of NC2 is strongly balanced by expansion in velocity space ( of NC2 is times higher than the average velocity dispersion of the progenitors) so to decrease for a factor the phase-space density.
As regards the virial equilibrium of NCs, it is worth noting that the King model fitting of NC1 (Fig.8) gives a velocity parameter , significantly lower than the true central value of the line-of-sight velocity dispersion . This discrepancy is due to the non negligible influence of the external galactic potential, which kinematically “heats up” the NC. This has an important implication on the reliability of the NC mass determination by means of the virial relation , with the projected velocity dispersion. The true mass value for our NCs is obtained with a virial parameter that is about 5 times lower than the usually adopted values based on the unrealistic assumption of isolated King models. This finding is in remarkable agreement with the results of Walcher et al., (2005) on the dynamical mass estimate of NCs observed in bulge-less spiral galaxies.
5 Are resolved galactic nuclei compatible with a merging origin?
An important result of this work is that a quasi-stationary NC may form as merger product of orbitally decayed massive clusters. The projected density profile in the 2 cases studied here is given in Fig. 8. Its similarity to the resolved nuclear profiles of many of the galaxies observed by, e.g., Böker et al., (2002); Geha et al., (2002); Walcher et al., (2005); Côtè et al., (2006) is clear; of course, the ratio between the central surface total density and that of the galaxy central plateau depends on the number of merged GCs. This ratio is for the four merging GCs of case 1 and for case 2. An analysis of Fig. 4 in Côtè et al., (2006) indicates ratios of the central luminosity and the inward extrapolated galactic luminosity in the interval . In the assumption that the density contrast scales linearly with the number of GCs merged () the range of the observed ratio corresponds to the interval for case 1 and for the case 2. Of course, the linearity is not guaranteed; actually, the modes of the merging of a more abundant sample of GCs deserves a careful, forthcoming, study. Moreover, a fully self-consistent study of the feedback among the merging GCs and the surrounding stellar field is needed to confirm the modes and time of orbital decay and merging. This study will constitute a check of the reliability of the dynamical friction treatment done here in the frame of the Pesce et al. (1992) scheme, which, if proved, will result on the possibility of saving a huge amount of CPU time in future simulations.
6 The merger remnant stationariety
In both the cases studied here the merging occurs at and the resulting NC keeps its characteristics almost unchanged over the remaining simulated time (other ). This does not imply, necessarily, the secular stationariety of the merged system, which should be investigated extending sufficiently in time the -body simulations. Anyway, simple considerations on the relaxation times convince ourselves that the lifetime of the merged system should be quite long. Actually, the half mass relaxation time of the cluster is (Spitzer,, 1987)
| (5) |
which gives , for the values , and corresponding to the four merged clusters of case 1, and , for the four merged clusters of case 2, where the only different value is that of the ratio which results in this case. In physical units, this means Gyr and Gyr in the 2 cases, respectively, assuming pc and M⊙. Consequently, the merged system should stay almost stationary for a time much longer than that of our present simulations and, more relevantly, of the order of the age of galaxies, especially when thinking that the ‘true ’number of stars in the system is from to times the one used in the simulations for in the range –, so to scale all the relaxation times estimated above for a factor in the range –. If other clusters merge to the center, increases, as likely does, increasing furtherly . In conclusion, a collisional evolution for the nuclear cluster seems unlikely, but larger scale instabilities cannot be ruled out. So, the dynamical evolution of the merger remnant deserves a more extended in time simulation.
In the, likely, hipothesis that the NC keeps its stability during subsequent merging events, the central density growth shown by Fig.8 can be reasonably scaled with the number of merging clusters, giving (case 1) and (case 2) in units of the central galactic density, . With and pc as typical values of normal elliptical galaxies, one has pc-3; consequently, for the NC to reach the high density of the order of pc-3, which is typical of the environment of massive accreting objects, (case 1) and (case 2) are needed. Even with all the necessary cautions suggested by the various assumptions done, these numbers (particularly for case 1) are indicating that a NC formed by merging of individual sub-structures may actually have reached central densities large enough and in a time short enough to provide mass for an efficient accretion of a possible massive galactic object, as suggested in various previous studies (e.g., Capuzzo-Dolcetta,, 1993; Capuzzo-Dolcetta & Tesseri,, 1999; Capuzzo-Dolcetta & Vicari,, 2005). In light of this, it is clear the importance of further, more detailed and complete, study of the actual modes of formation and evolution of a NC via the merging process (Capuzzo-Dolcetta & Miocchi, in preparation).
7 Conclusions
In this paper we studied the modes of interaction of a sample of few (4) globular clusters whose orbital motion is limited to the core of the galactic triaxial field, because they have experienced a significant and rapid dissipation of the orbital energy by dynamical friction acting on their large initial masses. We studied 2 sets of 4 GCs of different initial conditions, characterised by a higher (case 1) and lower (case 2) central density. Dynamical friction was properly taken into account by the triaxial generalization of the classical Chandrasekhar formula (Pesce et al., 1992) and it is the main cause of orbital energy dissipation up to the beginning of the merging process, when the individual cluster sizes are comparable with the orbital size. Since this stage on, the main responsible of the residual orbital energy loss is the tidal torque. The merger is completed in galactic core crossing times, i.e. in a time much shorter than the Hubble time and, in any case, small compared to the total orbital decaying time.
The merged system keeps some of the characteristics of the preexisting objects, attaining a relaxed structure which has, in the case 2, a mildly triaxial shape (inherited by the environment) and a halo which is diffusing in the external field assuming its phase space properties. The case 1 results into a merger configuration which conserves better the spherical simmetry of the ‘progenitors’ and whose radial density profile is more concentrated to the center than that expected on the basis of the mere space superposition of the 4 progenitors. This is, likely, the consequence of some violent relaxation of the merged cluster to the state of a quasi-stationary Super Star Cluster, whose stellar density distribution maintains a King shape and is very similar to Nuclear Clusters observed at the center of many galaxies. Even in the limits of our simulations (both on the number of merging objects and on the time extension of the integration), we may infer from a comparison of our results with the characteristics (surface brightness profile, integrated light and velocity dispersion) of the nuclei of many galaxies (Böker et al.,, 2002; Geha et al.,, 2002; Walcher et al.,, 2005; Côtè et al.,, 2006) that such nuclei may have actually formed by the merging of few tens (when merging progenitors are quite compact) up to few hundreds (when progenitors are looser) massive GCs decayed orbitally into the inner galactic regions.
As remarkable result, the radial profile of the line-of-sight velocity dispersion of the merger remnant shows the same minimum at the galactic center as actually found by observations of a sample of Virgo cluster nucleated dEs (Geha et al.,, 2002) and of late-type spirals (Walcher et al.,, 2005). Finally, an important theoretical result is that high densities ( pc-3), critical to allow a significant accretion onto a massive object, may be reached by mean of a merging of less than clusters of the type considered in case 1. This may have important implications on the role of NCs in supplying the innermost galactic activity.
8 Acknowledgements
The main computational resources employed for this work were provided by CINECA (http://www.cineca.it) thanks to the agreement with INAF (http://inaf.cineca.it) under the Key-Project grant inakp002. We thank dr. P. Di Matteo for providing us with her subroutine to generate multi-mass King models, used for initial conditions, and dr. A. Vicari for his fitting routines of the Schwarzschild’s velocity dispersion tensor, useful to calculate dynamical friction on the merging GCs.
References
- Ashman & Zepf, (1998) Ashman, K. M., Zepf, S. E. 1998, Globular cluster systems New York: Cambridge University Press, 1998. (Cambridge astrophysics series ; 30)
- Babul & Rees, (1992) Babul, A., & Rees, M.J. 1992, MNRAS, 255, 346
- Baumgardt et al., (2003) Baumgardt, H., Makino, J., Hut, P., McMillan, S., Portegies Zwart, S. 2003, ApJ, 589L, 25
- Bekki et al., (2004) Bekki, K., Couch, W.J., Drinkwater, M.J. & Shioya, Y. 2004, ApJ 610, L13
- Bertola et al., (1991) Bertola, F., Vietri, M, & Zeilinger, W.W. 1991, ApJ, 374, L13
- Binney & Tremaine, (1987) Binney, J., & Tremaine, S. 1987, Galactic Dynamics, Princeton Univ. Press
- Böker et al., (2002) Böker, T., Laine, S., van der Marel, R. P., Sarzi, M., Rix, H.-W., Ho, L. C., Shields, J. C. 2002, AJ, 123, 1389
- Böker et al., (2004) Böker, T., Sarzi, M., McLaughlin, D. E., van der Marel, R. P., Rix, H.-W., Ho, L. C., Shields, J. C. 2004, AJ, 127, 105
- Capuzzo-Dolcetta, (1993) Capuzzo-Dolcetta, R. 1993, ApJ, 415, 616
- Capuzzo-Dolcetta et al., (2005) Capuzzo-Dolcetta, R., Di Matteo, P., & Miocchi, P. 2005, AJ, 129, 1906
- Capuzzo-Dolcetta & Tesseri, (1997) Capuzzo-Dolcetta, R., & Tesseri, A. 1997, MNRAS, 292, 808
- Capuzzo-Dolcetta & Tesseri, (1999) Capuzzo-Dolcetta, R., & Tesseri, A. 1999, MNRAS, 308, 961
- Capuzzo-Dolcetta & Vicari, (2005) Capuzzo-Dolcetta, R., & Vicari, A. 2005, MNRAS, 356, 899
- Casertano & Hut, (1985) Casertano, S., & Hut, P. 1985, ApJ, 298, 80
- Chandrasekhar, (1943) Chandrasekhar, S. 1943, ApJ, 97, 255
- Côtè et al., (2006) Côtè, P. et al. 2006, ApJS, 165, 57
- Davies et al., (2001) Davies, R. L. , Kuntschner, H. , Emsellem, E., Bacon, R., Bureau, M., Carollo, C.M., Copin, Y., Miller, B.W., Monnet, G., Peletier, R.F., Verolme, E.K., & de Zeeuw, P.T. 2001, ApJ, 548, L33
- de Zeeuw & Merritt, (1983) de Zeeuw, T., & Merritt, D. 1983, ApJ, 267, 571
- Fellhauer & Kroupa, (2002) Fellhauer, M., & Kroupa, P. 2002, MNRAS, 330, 642
- Fellhauer & Kroupa, (2005) Fellhauer, M., & Kroupa, P. 2005, MNRAS, 359, 223
- Fellhauer & Lin, (2007) Fellhauer, M., & Lin, D.N.C. 2007, MNRAS, 375, 604
- Fujii et al., (2007) Fujii, M., Iwasawa, M., Funato, Y., & Makino, J. 2007, submitted to ApJ(astro-ph/0708.3719)
- Geha et al., (2002) Geha, M., Guhathakurta, P., & R. P. van der Marel, R.P. 2002, AJ, 124, 3073
- Genzel et al., (2003) Genzel, R., et al. 2003, ApJ, 594, 812
- Graham & Guzmán, (2003) Graham, A. W., & Guzmán, R. 2003, AJ, 125, 2936
- Harris, (1986) Harris, W.E. 1986, AJ, 91, 822
- Harris, (1991) Harris, W.E. 1991, ARA&A, 29, 543
- Harris, (2001) Harris, W.E. 2001, in Labhardt L., Binggeli B. eds., Saas-Fee Advanced Course 28, Star Clusters. Springer-Verlag, Berlin, p.223
- Haşegan et al., (2005) Haşegan, M., et al. 2005, ApJ, 627, 203
- Kissler-Patig et al., (2006) Kissler-Patig, M., Jordán, A., & Bastian, N. 2006 A&A, 448, 1031
- King, (1966) King, I.R. 1966, AJ, 71, 64
- Matthews & de Grijs, (2004) Matthews, L.D., & de Grijs, R. 2004, AJ, 128, 137
- McCrady, (2004) McCrady, N. 2004, AAS Meeting, 205, 85
- Mihos & Hernquist, (1994) Mihos, J.C., & Hernquist, L. 1994, ApJ, 437, L47
- Miocchi & Capuzzo-Dolcetta, (2002) Miocchi, P., & Capuzzo-Dolcetta, R. 2002, A&A, 382, 758
- Miocchi et al., (2006) Miocchi, P., Capuzzo-Dolcetta, R., Di Matteo, P., & Vicari, A. 2006, ApJ, 644, 940 (Paper I)
- Oh & Lin, (2000) Oh, K.S., & Lin, D.N.C. 2000, ApJ, 543, 620
- Pesce et al. (1992) Pesce, E., Capuzzo-Dolcetta, R., & Vietri, M. 1992, MNRAS, 254, 466
- Rossa et al., (2006) Rossa, J., van der Marel, R. P., Boeker, T., Gerssen, J., Ho, L. C., Rix, H.-W., Shields, J. C., & Walcher, C. J. 2006, AJ, 132, 1074
- Schwarzschild, (1979) Schwarzschild, M. 1979, ApJ, 232, 236
- Silk et al., (1987) Silk, J., Wyse, R.F.G., & Shields, G.A. 1987, ApJ, 332, L59
- Spitzer, (1987) Spitzer, L. Jr. 1987, Dynamical Evolution of Globular Clusters (Princeton: Princeton University Press)
- Statler et al., (2004) Statler, T.S., Emsellem, E., Peletier, R. F., & Bacon, R. 2004, MNRAS, 353, 1
- Tremaine et al., (1975) Tremaine, S., Ostriker, J.P., & Spitzer, L. Jr. 1975, ApJ, 196, 407
- van den Bergh, (1986) van den Bergh, S. 1986, AJ, 91, 271
- van der Marel et al., (2007) van der Marel, R. P., Rossa, J., Walcher, C. J., Boeker, T., Ho, L. C., Rix, H.-W., & Shields, J. C. 2007, Proceedings of IAU Symp. 241, ”Stellar Populations as Building Blocks of Galaxies“, A. Vazdekis and R. Peletier., eds. (astro-ph/0702433)
- Wagner, (1988) Wagner, S.J., Bender, R., & Moellenhoff, C. 1988, A&A, 195, L5
- Walcher et al., (2005) Walcher, C. J., van der Marel, R. P., McLaughlin, D., Rix, H.-W., Böker, T., Häring, N., Ho, L.C., Sarzi, M., & Shields, J. C. 2005, ApJ, 618, 237
- Walcher et al., (2006) Walcher, C. J., Böker, T., Charlot, S., Ho, L. C., Rix, H.-W., Rossa, J., Shields, J. C., & van der Marel, R. P. 2006, ApJ, 649, 692
- Wehner & Harris, (2006) Wehner, E.H, & Harris, W.E. 2006, ApJ, 644, L17
- White, (1978) White, S.D.M. 1978, MNRAS, 184, 185


| cluster model | |||||||||
|---|---|---|---|---|---|---|---|---|---|
| (a1) | |||||||||
| (b1) | |||||||||
| (c1) | |||||||||
| (d1) | |||||||||
| (a2) | |||||||||
| (b2) | |||||||||
| (c2) | |||||||||
| (d2) |
Note. — Parameters list for the initial cluster models, expressed in galactic units. Reported are: the GC mass (), the limiting radius (), the King concentration coefficient (), the King radius (), the half-mass radius (), the central density (), the half-mass crossing time [], the King velocity parameter (), and the central phase-space density estimate (where ).
| Nuclear cluster | ||||||||
|---|---|---|---|---|---|---|---|---|
| NC1 | ||||||||
| NC2 |
Note. — Parameters list for the NCs in the last configuration, expressed in galactic units. Reported are: the total mass (), the concentration coefficient () and the King radius () of the best-fit King model, the half-mass radius (), the central density (), the half-mass crossing time (), the central velocity dispersion () and the central phase-space density estimate.
| cluster model | |||
|---|---|---|---|
| (a1) – (a2) | |||
| (b1) – (b2) | |||
| (c1) – (c2) | |||
| (d1) – (d2) |
Note. — Initial conditions of the orbits of the 4 clusters. All started with zero initial velocity.