Vertically Extended Neutral Gas in the Massive Edge-on Spiral NGC 5746
Abstract
We present Very Large Array 21-cm observations of the massive edge-on spiral galaxy NGC 5746. This galaxy has recently been reported to have a luminous X-ray halo, which has been taken as evidence of residual hot gas as predicted in galaxy formation scenarios. Such models also predict that some of this gas should undergo thermal instabilities, leading to a population of warm clouds falling onto the disk. If so, then one might expect to find a vertically extended neutral layer. We detect a substantial high-latitude component, but conclude that almost all of its mass of M☉ most likely resides in a warp. Four features far from the plane containing about M☉ are found at velocities distinct from this warp. These clouds may be associated with the expected infall, although an origin in a disk-halo flow cannot be ruled out, except for one feature which is counter-rotating. The warp itself may be a result of infall according to recent models. But clearly this galaxy lacks a massive, lagging neutral halo as found in NGC 891. The disk HI is concentrated into two rings of radii 1.5 and 3 arcminutes. Radial inflow is found in the disk, probably due to the bar in this galaxy. A nearby member of this galaxy group, NGC 5740, is also detected. It shows a prominent one-sided extension which may be the result of ram pressure stripping.
1 Introduction
Gaseous thick disks or halos in spiral galaxies hold promise for answering key questions about galaxy formation and evolution. These vertically extended layers are multiphase, with detailed studies of the nearest edge-on galaxies revealing halos of neutral hydrogen (e.g. Irwin, 1994; Swaters et al., 1997), diffuse ionized gas (DIG; e.g. Rand et al., 1990; Dettmar, 1990; Rossa & Dettmar, 2003b), hot X-ray emitting gas (e.g. Bregman & Pildis, 1994; Strickland et al., 2004; Tüllmann et al., 2006b), radio continuum emission (e.g. Irwin et al., 1999; Dahlem et al., 2001) and dust (e.g. Howk & Savage, 1999; Alton et al., 2000; Irwin & Madden, 2006).
Especially for the extended DIG, X-ray, dust and radio continuum components, it has been well established that their prominence is correlated with the star formation activity in the underlying disk (e.g. Rand, 1996; Rossa & Dettmar, 2003a; Howk & Savage, 1999; Tüllmann et al., 2006a; Dahlem et al., 2006). Large shell-like and vertically oriented filamentary structures are also seen in many of the more actively star-forming edge-ons, in, e.g., DIG (Rand et al., 1990) and HI (e.g. Lee et al., 2001). All of this evidence has led to a picture of the origin of these layers in a star-formation-driven disk-halo cycle, which has been theoretically modeled as a general galactic fountain flow (Shapiro & Field, 1976; Bregman, 1980) with later models incorporating the fact that mass and energy input into the halo may efficiently occur through localized structures such as supershells and chimneys (Norman & Ikeuchi, 1989).
As for the Milky Way, the WHAM survey (Haffner et al., 2003) has characterized in detail the so-called Reynolds layer of vertically-extended DIG (Reynolds et al., 1973), revealing further instances of possible superbubbles (Reynolds et al., 2001). Very relevant to this paper are the High Velocity Clouds (HVCs) and Intermediate Velocity Clouds (IVCs). For the latter, a few are known to be 0.3–4 kpc above the midplane, with metallicities close to solar, and it is quite possible that these clouds originate in a disk-halo flow (Wakker 2004, and references therein). The situation for the HVCs is different, however. Not considering the contribution from the Magellanic Stream (Putman et al., 2003), some well studied complexes are found to be many kpc from the plane (e.g. 8–10 kpc for part of complex A, 4 kpc for complex C; Wakker 2004 and references therein). Although information is scarce, their metallicities are also well below solar (e.g. Collins et al. 2007), suggesting that such clouds are not part of a disk-halo flow but may be extragalactic clouds that are mixing with metal-enriched gas in the halo as they fall onto the disk.
Such a population of infalling warm clouds is a prediction of recent models of galaxy formation, in which galaxies are still growing by this mechanism. The idea that galaxies form by gas cooling out of a shock-heated hot halo was presented by White & Rees (1978). This hot gas should be thermally unstable and given to fragmentation (Field, 1965; Fall & Rees, 1985; Murray & Lin, 1990). Maller & Bullock (2004) explored the consequences of such an inflow of fragmenting material. The remaining hot gas has such a low density that it can support itself against infall for a long time. This may explain the ”over-cooling” problem in galaxy formation models that leads to overly massive galaxies and the finding that most of the baryons in the universe never ended up in galaxies (Benson et al. 2003 and references therein). Instabilities in cooling inflows have also been studied by Kaufmann et al. (2006) and Sommer-Larsen (2006). The cloud populations and distributions in these high-resolution models vary, with clouds having an uncertain but probably high ionization fraction.
An alternative explanation to the ”over-cooling” problem in the most massive galaxies is feedback. Reheating of the halo gas by core-collapse supernovae or a (possibly recurrent) AGN prevents the gas from cooling and flowing in (Binney, 2004). Heating by Type Ia supernovae is considered by Wang (2005). It is also argued that, except in the most massive halos, infalling gas never heats to the virial temperature but flows in cold (Binney, 1977; Birnboim & Dekel, 2003; Binney, 2004; Kereš et al., 2005; Dekel & Birnboim, 2006).
The rotation of gaseous halos may also provide clues as to their origin and the physical processes occurring within them. In recent years, the manner in which rotation speeds change as a function of height has begun to be characterized in the DIG (Heald et al., 2006a, b, 2007; Oosterloo et al., 2007). Heald and coworkers have measured the gradient in rotation speed with height () in three edge-ons which form a decreasing sequence of star forming activity and DIG scale-height: NGC 5775 (–8 km s-1 kpc-1), NGC 891 (–17 km s-1 kpc-1), and NGC 4302 (–30 km s-1 kpc-1). The gradients, when expressed in terms of km s-1 per DIG scale-height, show much less range: –15 to –25 km s-1 (scale height)-1. The authors show that simple ballistic models of disk-halo flow (Collins et al., 2002) greatly underpredict the magnitude of these gradients and also predict the wrong trend with scale-height. Two possible resolutions are: 1) the physics of disk-halo flows are not well described by ballistic models and that hydrodynamical effects such as pressure (Barnabè et al., 2006) or magnetic or viscous forces (Benjamin, 2002) dominate the rotation, or 2) part or all of the gas does not originate in a flow from the high-angular-momentum disk, but rather from infalling low-angular-momentum primordial gas. For the DIG, the latter explanation must also account for morphological and other connections with ongoing star formation discussed above.
For NGC 891, has also been measured for the HI and is –15 km s-1 kpc-1 (Oosterloo et al., 2007), in good agreement with the DIG value . The authors conclude from this gradient that at least some of the M☉ HI halo must be accreted, low angular momentum material (see also Fraternali & Binney 2006).
Furthering our understanding of both galactic infall and disk-halo cycling, as well as possible interactions between the two, would be made easier if one could isolate galaxies where one or the other origin is expected to obtain. High star-forming galaxies like NGC 5775 presumably have gaseous halos dominated by disk-halo flows. The recent discovery of a bright ( erg s-1) X-ray halo around the massive, nearby (29.4 Mpc is the commonly adopted distance), low star forming edge-on Sb galaxy NGC 5746 (Pedersen et al., 2006; Rasmussen et al., 2006) presents a challenge to disk-halo models as the X-ray luminosity clearly exceeds that expected (Tüllmann et al., 2006a; Strickland et al., 2004) for a galaxy with no detected DIG halo (Rand 1996; in an image with an Emission Measure noise level of 3.7 pc cm-6) and little star formation. Rand (1996) roughly characterized the star formation rate per unit disk area of many edge-ons using the far infrared luminosity measured by the Infrared Astronomical Satellite (IRAS) divided by the optical disk area: / (values calculated from the NASA/IPAC Extragalactic Database111The NASA/IPAC Extragalactic Database (NED) is operated by the Jet Propulsion Laboratory, California Institute of Technology, under contract with the National Aeronautics and Space Administration.). NGC 5746 is one of the lower of the 16 edge-ons thus characterized, at erg s-1 kpc-2. Rather, the X-ray luminosity puts NGC 5746 on the expected steep relationship for hot halos in galaxy formation models (Toft et al., 2002), and, in such an interpretation, it is only because of the very high rotation speed (measured in this paper to be about 310 km s-1) that this residual hot halo can be detected at all. The metallicity of the hot gas is found to be low, at about 0.04 solar (Rasmussen et al., 2006), but is uncertain and could be biased toward low values (see Buote 2000). But overall, this galaxy may well be an attractive test case where disk-halo cycling is minimized.
There are some caveats to this interpretation, however. First, NGC 5746 is in a group of 26 cataloged members (Giuricin et al., 2000), and there may well have been interactions in the past leading to gas in the group environment. Second, although there is little ongoing star formation, it may be that Type Ia supernovae or an AGN create a hot wind or provide energy to keep a pre-existing halo heated, as discussed above. However, Rasmussen et al. (2006) argue that the likely Type Ia SN rate in a galaxy like NGC 5746 would be far too low to explain the X-ray luminosity. They also argue that there is little evidence for at least current nuclear activity in this galaxy, and that a soft, thermal X-ray halo would not be expected for an AGN outflow anyway. We do note, however, that NGC 5746 is classified as a LINER by Carrillo et al. (1999), and there is a compact X-ray source (González-Martín et al., 2006) at the center, indicating at least low level activity at present, although no compact radio source has been detected (Nagar et al., 2005). If the metallicity of the hot gas is indeed as low as 0.04, these alternative sources are not very likely.
If this X-ray halo is a residual of galaxy formation and thus an indication of missing baryons, then an obvious question is whether the predicted thermal instabilities are occurring, leading to an infalling warm component. If it exists, the lack of a DIG halo may simply mean that there are few disk sources capable of significant ionization. But there may be a neutral halo. Either a detection or an upper limit will constrain galaxy formation models and the “missing baryon” question, and shed light on the origin of the Milky Way’s HVCs, more so if individual clouds can be seen. A detection of a significant neutral halo would also be challenging to explain in terms of a disk-halo cycle origin.
We have therefore observed NGC 5746 in 21-cm emission with the Very Large Array (VLA), as described in §2. We analyze high-latitude emission in §3, and end with a brief discussion in §4 in terms of the theories of the halo gas discussed above.
2 Observations
NGC 5746 was observed in the C array of the VLA on 2007 January 7, 8, 12 and 13. Phase calibration was achieved through observations of VLA calibrator 1445+099 about every 30 minutes. Observations of 3C286 and 3C48 were used for flux and bandpass calibration. Sixty three spectral channels were employed, centered at 1725 km s-1, with channel width 20.85 km s-1, while online Hanning smoothing yielding a velocity resolution of twice this width. A total of about 28.3 hours were spent observing NGC 5746. Eight of the 27 antennae were unavailable for most of the final track, while two were absent on the other three dates. Smaller amounts of data were also lost due to high winds, interference, and equipment failures. Data were inspected for high amplitudes and any suspect data excised. Some small baseline corrections for a few antennae were made, based on later observations in the same configuration. The calibration of all four tracks is of very high quality.
High amplitude visibilities were clipped before mapping. Dirty maps of each track were made to check for additional problems before concatenating the four datasets. Continuum was subtracted in the -plane using line-free channels at either end of the spectrometer with the AIPS tasks UVSUB and UVLSF. This was very successful. The AIPS task IMAGR was used to produce clean maps using clean boxes that covered the emission from NGC 5746 as well as NGC 5740, which is also detected, albeit somewhat outside the 31.9’ FWHM primary beam. The pointing center is R.A. 14h 44m 56.4s, Decl. 1∘ 57’ 16” (J2000). The primary data cube discussed here was made with no -tapering and has a resolution of 15.5”x14.8” (2.2 x 2.1 kpc) at a P.A. of . A cube with 61.3”x58.1” resolution (8.7 x 8.3 kpc), at a P.A. of 45.5∘, created via -tapering is also discussed here. All maps have 1024x1024 pixels of 3” size, and were made with uniform -weighting with the IMAGR ’ROBUST’ parameter equal to 0. The noise in a single channel of the full-resolution cube is 0.23 mJy (beam)-1. No primary beam correction was made for maps of NGC 5746. Primary beam attenuation reaches 4% at the ends of the major axis. Maps of NGC 5740 are corrected for primary beam attenuation; the response at the center of this galaxy has dropped to 0.36, and thus structure may not be accurately mapped. No other galaxies in the NGC 5746 group are within the mapped region. Observed velocities are on the heliocentric scale. The noise corresponds to an HI column density of cm-2 averaged over one resolution element for optically thin gas. In a zeroth-moment map made using all data and all channels, a 5 detection of a point source corresponds to M☉, using the conversion from (e.g.) Zwaan et al. (1997). All masses are of total atomic gas and include a correction of 1.36 for helium content.
Finally, the GIPSY task BLOT was used to blank emission-free regions in each channel, reducing the noise in moment maps. Moment maps were made with various strategies to eliminate as much noise as possible while retaining as much emission as possible that appears to be real in the channel maps and position-velocity (pv) diagrams (given its signal-to-noise ratio and continuity over multiple velocity channels). The zeroth-moment map presented here for the full-resolution cube includes all emission in the blotted cube above the 1 level in each pixel in two consecutive channels. For the 60” resolution cube, such a strategy introduced too many features in the zeroth-moment map that did not appear real in the data cube, and thus a 2.5 cutoff was used. A concern with the velocity resolution of 42 km s-1 is that many real spectrally narrow features may be rejected by this strategy.
3 Results
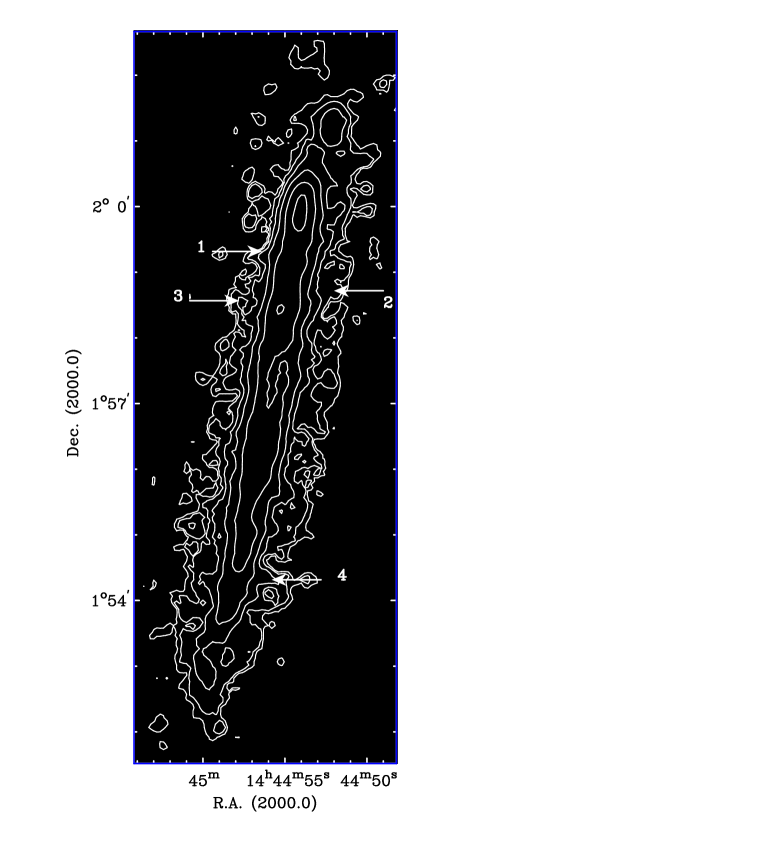
Channel maps of the full-resolution cube are shown in Figure 1. Zeroth- and first-moment maps made from the blotted full-resolution cube are shown in Figure 2. The zeroth-moment map is overlaid on an Digitized Sky Survey red image in Figure 3. Also labeled in Figure 3 are the four extraplanar features discussed in §3.5. The emission from NGC 5746 is dominated by what appears to be a highly inclined disk at a position angle (PA) of 350∘ (measured CCW from N to the receding side of the major axis) with a large central depression of about 2’ diameter. In this sense it is somewhat reminiscent of the Infrared Space Observatory ISOCAM 12m image from Bendo et al. (2002), which has the appearance of an inclined ring of approximate diameter 2.3’ (19.7 kpc). It is possible the HI hole is larger but limited resolution has made it appear smaller.

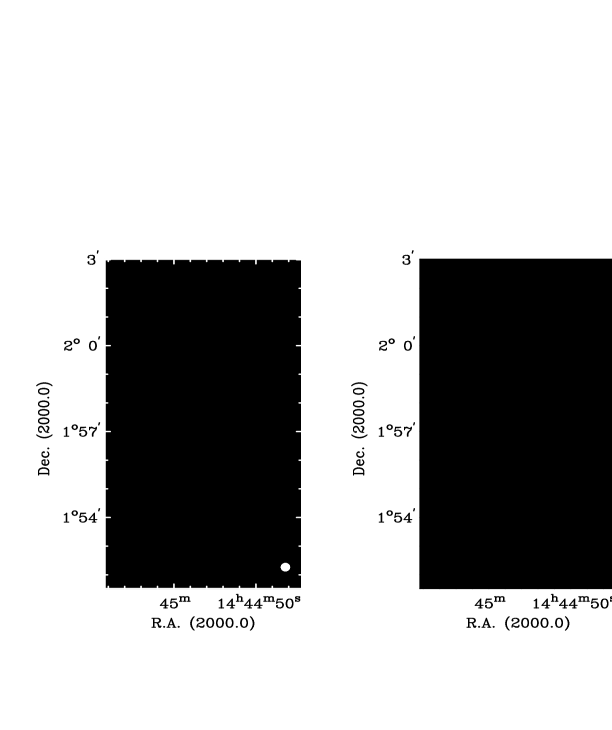
At fainter levels, a component extended along the minor axis is clearly detected. It is resolved into individual clouds and filaments to some degree. This is in contrast to the HI map of NGC 891 (see Figure 1 of Oosterloo et al. 2007) where the halo is smoother in appearance despite better linear resolution (1.4 kpc vs. 2.1 kpc). Emission is detected up to about 70” (10 kpc) from the midplane. The northern end of the disk also suggests a warp.
The total flux in the map in Figure 2 is 33.7 Jy km s-1, yielding a total atomic mass of M☉. For comparison, the total observed flux found by Springob et al. (2005) using the Arecibo telescope is 38.8 Jy km s-1.
Figure 4 shows the zeroth- and first-moment maps from the 60”-resolution cube. The total mass in this map is M☉, slightly less than in the full-resolution map. We attribute this to the somewhat higher cutoff that was necessary to eliminate noisy features in the moment map at this resolution. However, it also indicates that there is very little diffuse, low surface brightness emission that is missed in the full resolution cube. The ends of the disk in this map also suggest a warp, but with the opposite sense of bending than is evident at lower radii in the full resolution map.
3.1 Modeling the Atomic Mass Distribution and Rotation
Our main goal here is to understand the origin of the faint, vertically extended component seen in Figure 2 through full modeling of the data cubes. Although we are able to quantitatively constrain many of the model parameters, we do not carry out a full search of parameter space, not least because of asymmetries in the data, but rather explore and constrain a few well motivated types of models.
We begin by constraining the radial density profile at the midplane. As a first estimate, we employ the GIPSY task RADIAL, which fits radial profiles of the column density integrated vertically through the disk to averaged major axis emission profiles for highly inclined galaxies. The observed major axis emission profile is shown in Figure 5 as the solid line. Since in the below modeling we will use axisymmetric density distributions, we also show a profile where the north and south sides have been averaged to produce an axisymmetric profile (dashed line). The fitted axisymmetric profile is shown as the dotted line. The radial column density profile derived by RADIAL is shown in Figure 6 as the filled circles. The disk is dominated by two rings of radius 1.5’ and 3’ and width about 1’, while the profile confirms the aforementioned central depression of radius 1’. RADIAL reproduces the observed profile in Figure 5 very well, except for a moderate overestimate of the emission in the central depression. This overestimate cannot be rectified by creating a more prominent central hole but is instead a result of projected emission from gas at larger radii; it presumably indicates an asymmetry in the galaxy. The other symbols in Figure 6 show the deviations from the basic profile featured in the models described below.


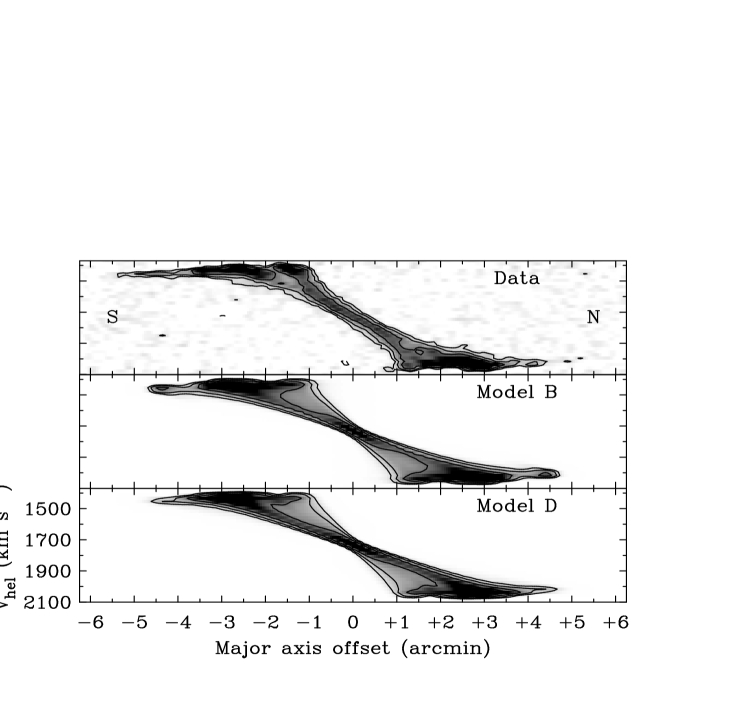
We use the major axis pv diagram (Figure 7) and the envelope tracing method to estimate the rotation curve. The method is described in Sofue & Rubin (2001). We use (see Sofue & Rubin 2001 for the definition of this parameter). We assume the inclination is close enough to so that no correction for projection is necessary. As there is little modeled column density in the central 1’ radius, the rotation curve is very poorly constrained there. In fact, long-slit spectra and a peanut bulge indicate that NGC 5746 is clearly barred, with the bar elongated more across the line of sight than along it (Kuijken & Merrifield, 1995; Bureau & Freeman, 1999). The bar manifests itself kinematically in a steeply rising component within major axis offsets of in pv diagrams of emission lines (indicative of orbits perpendicular to the bar), which is clearly not seen in HI. For our rotation curve we have simply extended the value at inwards. Our adopted rotation curve is shown in Figure 8. The dynamical mass within (42.8 kpc), given by , is M☉.

We next need to constrain the inclination, . For nearly edge-on galaxies, tilted-ring programs such as ROTCUR in GIPSY cannot do this accurately, especially if a warp along the line of sight or a lagging halo is suspected and contributes significantly to the velocity field. However, can be estimated by assuming axisymmetry in the ringlike appearance of the emission at the center of the zeroth-moment map. Hence, we use our adopted rotation curve and radial column density profile as inputs to the GIPSY program GALMOD (a program which allows construction of model galaxies with specified radial column density profiles, rotation curves, and various forms for the vertical density distribution) in order to generate a zeroth-moment map and match it to the data. The radial bins in all our models have a width of 15” (2.1 kpc). The models produced by GALMOD are convolved to the resolution of the data. From the measured separation of the two sides of the ring along the minor axis near the galaxy center in Figure 2, we find that must be about 86∘. This value is confirmed by the modeling described below. ROTCUR was run to constrain other parameters, and indicates a PA of , a systemic velocity of km s-1, and a kinematic center about 6” or 850 pc west of the pointing center, at R.A. 14h 44m 56.0s, Decl. 1∘ 57’ 16” (J2000). The gas is initially assumed to be in a single exponential layer with scale height 3” or about 400 pc. The true scale height of the bulk of the emission is not well constrained because of the resolution and could be substantially lower than 3”.
We next show that the vertical structure cannot be fit by a single component at a given inclination, or by two exponential components. Figure 9 shows a minor-axis emission profile, averaged over 3’ along the major axis (solid line). There are clearly tails at both ends of the profile. The dashed line shows our modeled component for an exponential layer with 3” scale height. It fits the bulk of the emission well but not the tails. The dotted line shows an exponential model with a scale height of 18”. It fits the tails well but is broader than the bulk of the emission and washes out the splitting at low latitudes (which is due to the ringlike distribution). No combination of two exponentials were found to produce a reasonable fit. This result does not change if a gaussian or sech2 form is used.

Instead we consider two possibilities to explain the tails. The first is a warp along the line of sight, and the second is a halo with a box-like (employed for ease of modeling although it is unphysical) profile in . The model parameters are summarized in Table 1.
The morphology of the tails turns out to be very much coupled with their kinematics, so we now consider these together by introducing pv diagrams parallel to the minor axis at various positions along the major axis which provide good leverage on the parameters of interest. These are shown in Figure 10, along with several models generated by GALMOD and variants on that program. The characteristic appearance of the disk component in these diagrams is one of narrow angular extent at velocities furthest from which broadens and (where the ringlike structure is evident) splits as velocities move towards . The faint high-latitude component has a characteristic appearance which will greatly constrain its morphology and kinematics. Although it varies significantly among cuts, it generally manifests itself as an extended, spectrally very narrow component at velocities closer to than the disk component, with a definite gradient in with that is more evident in panels further from the galaxy center. Some east-west asymmetries are evident in this component.
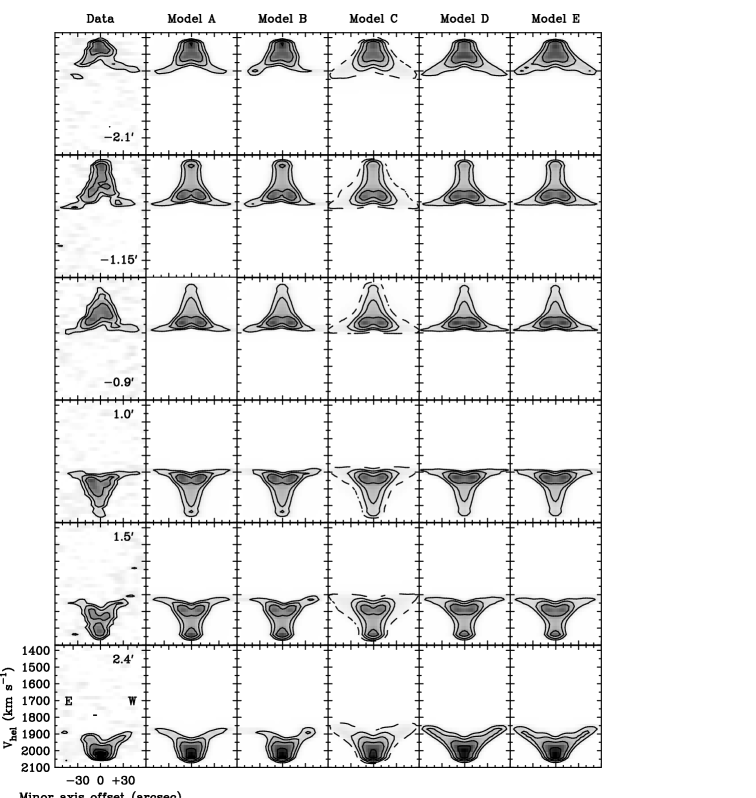
We first consider a warp along the line of sight. In GALMOD, this is achieved by slowly decreasing the inclination of outer rings. However, in order to reproduce the minor axis emission profile, the column density in the warped rings had to be increased significantly from the major-axis-based starting point, as shown in Figure 6. The warp begins at a radius of 4’ (34.2 kpc), where , dropping to by 5’ (42.8 kpc) radius (Figure 11). The maximum displacement of the midplane of the outermost warped ring from the unwarped disk is about 5 kpc. A slightly larger warping is required for the SE quadrant (top three panels of Figure 10 at negative minor axis offsets) but is not modeled here. The resulting model, Model A, appears to match the observed minor-axis pv diagrams very well.

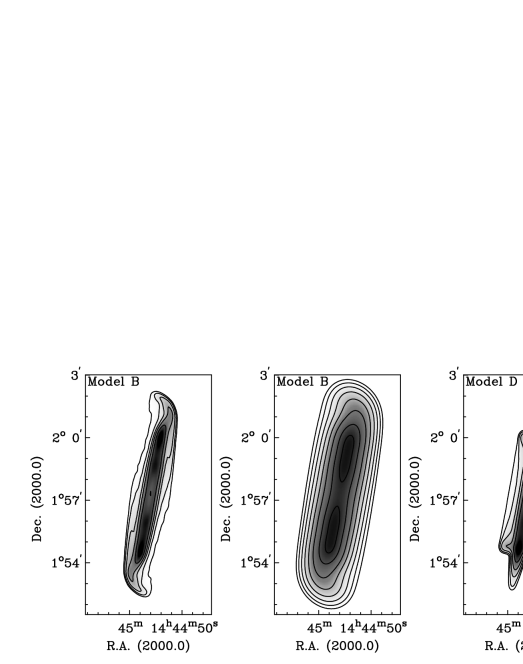
Model B is an attempt to incorporate the bending across the line of sight evident in the zeroth-moment maps. Retaining the run of inclination in Model A, the PA in this model decreases from 350∘ to 346∘ over the radius range 3’ to 4’, and then increases back to 5∘ by 5’ radius (Figure 11). The asymmetry introduced into the minor-axis pv diagrams (Figure 10) provides a slightly better match to the data at high latitudes, although still probably underestimating the observed asymmetry. The zeroth-moment map of this model (Figure 12) also exhibits a slight brightness asymmetry with respect to the minor axis at major axis distances less than 4’ from the center and at heights 30–60” from the plane that is also apparent on the east side in Figure 2. The model appears to somewhat overestimate the bending to larger PAs evident in Figure 2 (and, of course, there is too much emission at the ends of the major axis because of the excess column density in the modeled warp). However, a model version smoothed to 60” (Figure 12, center), is a reasonable match to the bending in Figure 4. We note that warps are often asymmetric (García-Ruiz et al., 2002), so one should not expect a warp fitted to kinematic information parallel to the minor axis to match perfectly the morphology along the major axis. A second caveat to this exercise is that some of the bending along the major axis may be due to outer spiral structure seen not quite edge-on. In fact, the initial bending to lower PAs in the model is only present to match the morphology in the moment maps. The subsequent increase in PA is responsible for the asymmetries in the pv diagrams. As mentioned at the beginning of this section, for these kinds of reasons, we have not carried out a full exploration of parameter space but simply present these models as reasonable fits to the data.
We next consider the box-like halo, extending to (7.1 kpc). Such a component, when convolved with the beam, loses its sharp edges and, added in the right proportion to the disk component, reasonably reproduces the minor-axis emission profile in Figure 9, being almost indistinguishable from the warp model profile. The disk component column density is normalized downwards by a factor of 1.24 in these models.
For the halo models, the gradient in with at high latitudes in Figure 10 implies a rotational velocity that decreases with , i.e. . The spectral narrowness implies that such a halo cannot occupy a large range in radius, otherwise projection of the rotational velocity would cause broadening of the profiles in disagreement with the data.
To illustrate these constraints, we first consider a model where the halo has the same radial density profile shape as the disk, and a vertical gradient in rotation velocity of –3.5 km s-1 (arcsec)-1 (–25 km s-1 kpc-1). We refer to this as Model C in Figure 10. Although the amount of high-latitude emission is well matched to the data, there is little such emission seen at the first solid contour level of this model. This is because the velocity profiles there are broader with lower peak intensities, extending to velocities much too far from to be consistent with the data, and we demonstrate this by including a low-level dashed contour. Clearly, this model is a poor match to the halo emission.
The narrowness of the high-latitude velocity profiles puts a strong constraint on the radial range of the halo component, and leads us to consider annular distributions, beginning with one in which the entire halo is contained in one 15” ring. Model D in Figure 10 features a ring of central radius = 180”, with km s-1 arcsec-1, and a necessarily high column density of cm-2 to match the minor axis emission profile. Comparison of modeled and data pv diagrams for other values of constrain this parameter to be in the range 160–200” (22.8–28.5 kpc). Even for such a narrow ring, the high-latitude velocity profiles tend to be broader than in the data. For values of outside the range –3 to –4 km s-1 arcsec-1 the gradient in the halo component in the pv diagrams is not well matched. However, a somewhat higher gradient is required for the SE quadrant, and models indicate a value of km s-1 arcsec-1. All halo models employ to match the minor-axis emission profile.
The narrowness of the ring also introduces a strong edge-brightening in the halo in zeroth-moment maps (Figure 12) due to the projection of the ring which is clearly not seen in the data. This halo would therefore need to be much more asymmetric than the warp of Models A and B. The normalization of the modeled halo also now depends on the radial range used to form the minor axis emission profiles. We have chosen to normalize using the same radial range as above, realizing that the edge-brightening will lead to excess mass in the modeled halo.
An annulus wider than 1’ (8.6 kpc), although featuring a more plausible column density, causes the high-latitude velocity profiles to broaden, if only slightly. Model E, where the annulus is 1.25’ wide and its column density is cm-2, shows this effect.
The major-axis pv diagram for the data and Models B and D are compared in Figure 7. The general shape of the flat part of the pv diagram is reproduced quite well, given that we do not attempt to model the aforementioned asymmetry in the emission around the major axis. The general slope of the rising part of the diagram is underestimated. In the models, the slope is dictated by the fact that most of the gas is in the outer () ring in our axisymmetric radial profile. Asymmetries, in the sense of gas being more centrally concentrated in the vicinity of the inner ring at major axis offsets within 1’ of the center, could be the cause of this discrepancy.
The velocity dispersion is not well constrained because of the somewhat low velocity resolution. A value of 10 km s-1 was used in the models for both disk and halo.
We roughly estimate the fraction of mass in the extended component in two different ways. First, we simply assume that in the zeroth-moment map of Figure 2, all emission above a certain height can be attributed to the extended component. Using two values of this height – 9” and 11” (1.3 and 1.6 kpc) –, its mass is M☉. The second estimate comes from the models. In the warp model, the excess column density in the warped region accounts for M☉. For the halo models, we calculate the mass in the halo component and find M☉. These are both overestimates, especially the latter, because the extra column density along the line of sight required by the axisymmetric models overestimates the emission along the major axis. The estimate from the data themselves is likely to be superior.
Although both models are inaccurate because of their symmetry, the problem is much worse for the halo model. This model is also much more contrived in that it requires a very large mass in a very small radial range. The narrowness of the high-latitude spectra is also better reproduced by the warp model. We therefore conclude that the extended component is a warp rather than a halo. Further fine tuning of the warp model may produce a slightly better match to the data, but the asymmetries preclude a significant improvement, and hence we do not pursue this further here.
3.2 Radial Inflow
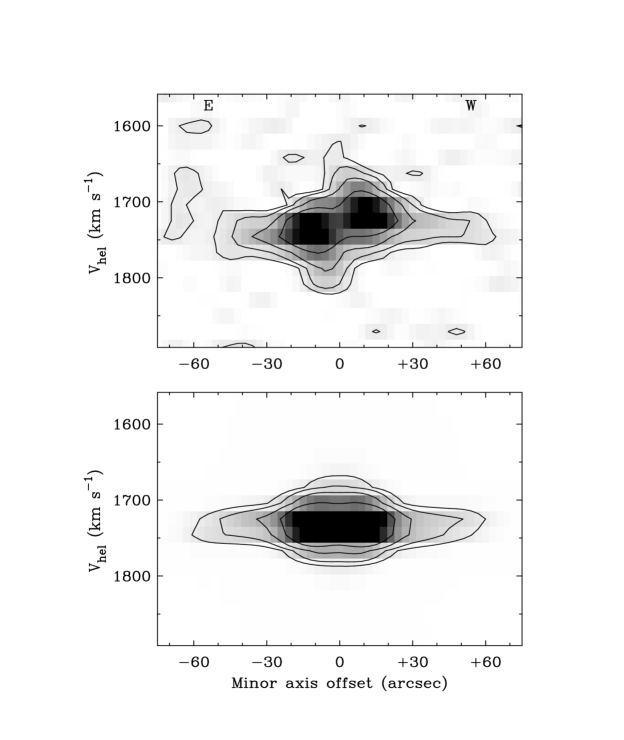
Figure 13 (top panel) shows a pv diagram along the minor axis of the galaxy. A shift in mean velocity between the positive and negative sides is apparent in the disk component, while a very small shift also exists in the warp component (the double-peaked nature of the disk component is due to the inner ring of 1.5’ radius as discussed above). Such a shift is a potential sign of radial inflow in a not quite edge-on galaxy. All diagrams for major axis offsets within one beam width of this one show this signature. For the warp, such a shift is also seen, albeit at a slightly smaller amplitude, in the corresponding pv diagram of Model B (bottom panel of Figure 13), and we cannot rule out that it is an effect of the warp geometry. For the disk, since there is strong kinematic evidence of a bar (see §1), the signature would suggest radial inflow in the inner ring-like gas distribution surrounding the bar. To measure the inflow amplitude, we have created two spectra from the minor axis pv diagram, averaged over the range 3–18” in the minor axis direction on the east and west sides. A Gaussian is fit to each spectrum to find the mean velocity, and half of the velocity difference between the east and west sides is taken as the inflow velocity. The result is km s-1.
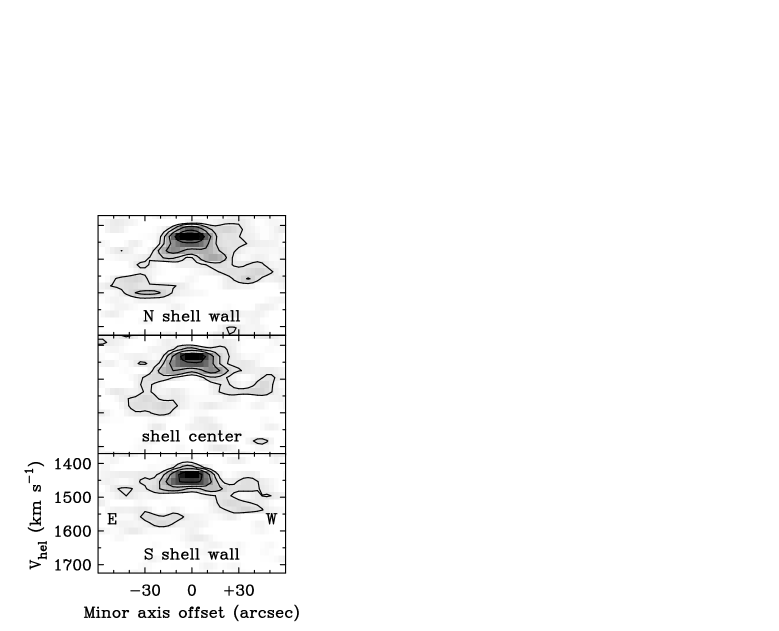
3.3 A Possible Supershell
A structure in the SW quadrant above the disk has the form of a closed shell – better seen in Figure 14 – although it is always possible that projection of unrelated features has given it this appearance. The total mass is about M☉, and the extent parallel to the major axis is about 3.4 kpc. Position-velocity diagrams parallel to the minor axis for the northern wall, center and southern wall of the shell are shown in Figure 15. Above about 10” (1.4 kpc) from the plane, the walls show emission at the velocities of the warp as well as a broad component extending to about the terminal velocity in the northern wall, and some evidence for line splitting in the southern wall. The northern wall is detected over nine velocity channels, or about 190 km s-1. The line splitting in the southern wall is five channels or about 100 km s-1. Given that the velocities in the warp component are due to the warp geometry, it would be incorrect to conclude that this line broadening/splitting is due to expansion. Rather, it may just indicate that the feature is extended along the line of sight. There is no indication of a corresponding ionized feature in the H image of Rand (1996).

3.4 A Clumpy Warp?
Figure 2 shows that the high-latitude emission is partially resolved into individual clumps. Almost thirty such features have been identified by visual inspection and are listed in Table 2. This selection is not meant to be complete or statistically well defined, but is simply meant to give a first-order idea of the masses of well detected features. These range from about M☉ to M☉, and their masses sum to M☉, or about half of the total mass of the high-latitude emission. The most massive, numbered 18, is the shell-like structure discussed above. Most are unresolved but a few have a filamentary appearance and lengths of 3–6 kpc. The line widths are difficult to estimate for many features because of the velocity resolution of 42 km s-1 (FWHM) and the low signal-to-noise ratio of some of the detections. For example, the significant emission for three of the best detected clouds, numbered 5, 6 and 8 in Table 2, is confined to two channels and therefore the lines are unresolved. Others, such as 11 and 28, show emission over channels, or km s-1, and it is not clear if these represent actual internal motions or reflect the extent of the features along the line of sight, for example.
The 60”-resolution zeroth-moment map (Figure 4) reveals two faint vertical extensions from the plane in the SE quadrant, reaching heights of 15 and 20 kpc. Summing their emission above where they appear to merge with the disk, we obtain masses of M☉ and M☉, for the northern and southern feature, respectively. A faint extension is also seen off the NW end of the disk. Its mass is about M☉. The first-moment map shows that the SE features have about the same velocity as the part of the warp that they connect to with little change in velocity along their vertical extent.
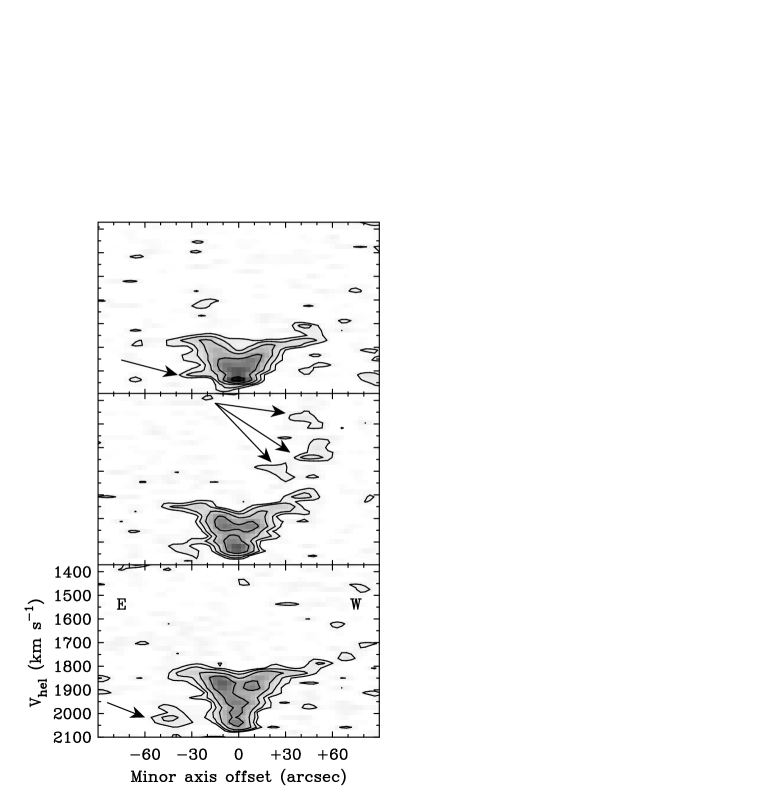
3.5 High Latitude Features Not in the Warp
We have carefully combed the channel maps and pv diagrams to look for high-latitude emission which does not have the velocities of the warp component but which may not be evident in Figure 2. We have found four such features. Position-velocity diagrams for the first three, at the center of their extent along the major axis, are shown in Figure 16. The features’ locations are also marked in Figure 3, and their properties are summarized in Table 3. One is an unresolved feature in the NE quadrant of the halo. The second and third are diffuse features with appreciable extents along the major axis of 0.7’ and 0.6’ (6.0 and 5.1 kpc), respectively. The second feature is also counterrotating and its emission spans more than 300 km s-1. The fourth is the low- side of the possible shell (Cloud 18 in Table 2).
3.6 NGC 5740
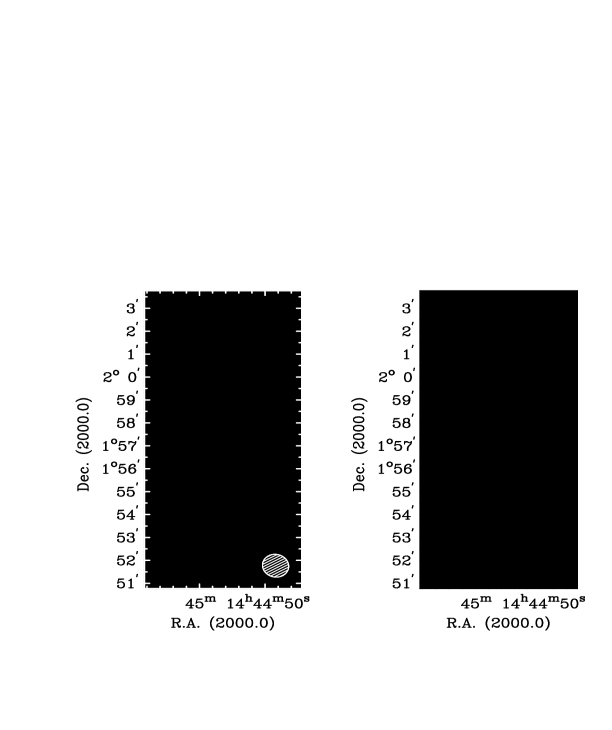
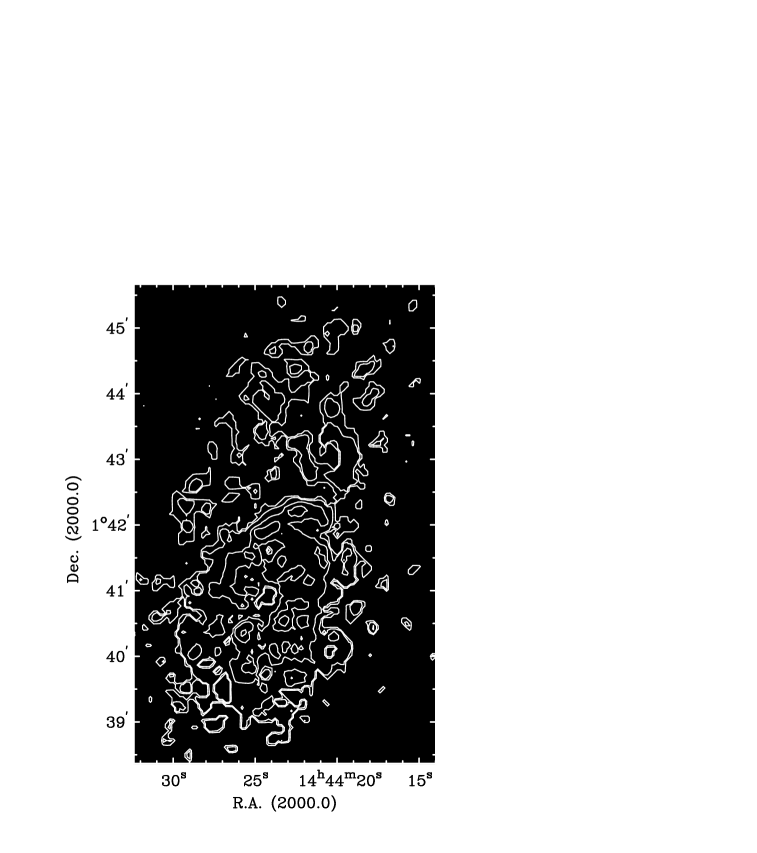
As this barred (Erwin, 2005) Sb galaxy is beyond the half-power radius of the primary beam, the detailed structure may not be accurate and we limit ourselves to general properties only. We assume its distance to be the same as that of NGC 5746. Channel maps of the full-resolution cube are shown in Figure 17. Zeroth- and first-moment maps of NGC 5740 are presented in Figure 18, using all data above in two consecutive channels. The zeroth-moment map is overlaid on a Digitized Sky Survey red image in Figure 19. There is a disk of about 30 kpc diameter and a large extension to the NNW. The disk has a mass of about M☉ and the extension M☉. For comparison, Schneider et al. (1986) quote a mass in atomic hydrogen of M☉, scaled to our distance.

A ROTCUR analysis of the disk indicates a PA of , an inclination of , km s-1, a dynamical center of R.A. 14h 44m 24.4s, Decl. 1∘ 40’ 52”, with approximate uncertainty 3” in R.A. and 8” in Decl. The first-moment map suggests regular rotation continues into the NNW extension. Keeping and the dynamical center fixed, and fitting the receding half of the galaxy only, the extension exhibits little change in PA but a continued fall in and an increase in inclination to at 2’ and at 4’. The derived rotation curve is shown in Figure 20. The dynamical mass within (17.1 kpc) is M☉.
Morphologically, the NNW extension is similar to extensions in several Virgo Cluster galaxies, most of which are best explained by ram pressure stripping (Chung et al., 2007). There is no obvious evidence of compression of the gas on the opposite side of the disk, however. The condition for ram pressure stripping, as given by Vollmer et al. (2001), is , where is the intragroup medium (IGM) density, and is the velocity of the galaxy through the medium, for gas at surface density at a radius from the galactic center. At the outskirts of the main disk the typical surface density is about 2 M☉pc-2, while km s-1. The condition for stripping is then ( cm-3)(/100 km s-1). Both required numbers are not constrained. We find that the one-dimensional velocity dispersion for the catalogued galaxies of the NGC 5746 group is 120 km s-1. The IGM density is unknown. X-ray bright groups are found to be HI-deficient by Sengupta & Balasubramanyam (2006), who calculate a range of IGM densities from to cm-3, but it is unknown how extensive X-ray emission is in the NGC 5746 group. Hence, it is unclear whether the stripping condition can be met. Tidal stripping seems less likely given the morphology and that the closest group galaxy on the sky, NGC 5746, is 155 kpc away in projection.

4 Discussion
Almost all of the high-latitude gas we have detected can be associated with the warp. At the level of sensitivity of our data, only the features listed in Table 3, summing to about 108 M☉, may have originated in a disk-halo flow or infall. The heights off the plane of their centers range from 2 to 8 kpc. One of the more massive ones is counter-rotating and is unlikely to have originated in the disk. A few M☉ worth of counter-rotating clouds were also discovered in the neutral halo of NGC 891 by Oosterloo et al. (2007).
Are these few clouds consistent with predictions from the halo thermal instability simulations mentioned in §1? In the simulations of Sommer-Larsen (2006), most of the warm clouds are within 50 kpc from the center of the galaxy and total M☉, with most having masses a few times to a few times M☉ for a galaxy like the Milky Way. By comparison, for an M33-like galaxy, Kaufmann et al. (2006) expect clouds of radii kpc and masses from to a few times M☉, totaling M☉ depending on the simulation parameters, confined to within about 10–20 kpc above the disk. If the few clouds in Table 3 are due to infall, we note that their total mass is comparable to these model predictions, with the caveat that the fraction of neutral gas is uncertain in the simulations. The small number of detected clouds is in fact comparable to that in the “very high resolution” simulation of Sommer-Larsen (2006), where the mass resolution is comparable to that of our data.
For galaxies like the Milky Way, Maller & Bullock (2004) predict M☉ of mostly ionized clouds of mass M☉ and size kpc, extending to 150 kpc from the center of the galaxy. At our sensitivity, it is difficult to rule out with confidence such a widespread population of clouds from the HI data alone.
It would be interesting to know how much mass in warm clouds forms in simulations of more massive systems like NGC 5746, and where it is located. The cooling rate, at least, of the hot gas in this galaxy can be estimated from the observations, but is very uncertain. The rate inferred by Rasmussen et al. (2006), who exclude the projected disk area where there may be contamination by other sources of hot gas, is only 0.2 M☉ (yr)-1. The rate is modest because the estimated halo temperature is rather high, at 0.56 keV. However, most of the halo cooling is likely to be occurring in the excluded area, and their models of massive disks suggest that the cooling rate could be 5–10 times higher as a result. In summary, it is unclear whether the observed clouds are consistent with theoretical expectations for halo cooling in a massive disk galaxy like NGC 5746.
What fraction of these halo clouds do we expect to be fully or mostly ionized? This depends on the incident ionizing flux, the mass, and most importantly, the bounding pressure on the cloud. If we assume that the ionized gas in a cloud is in thermal pressure equilibrium with an outside pressure, the density of a cloud is given by , where is the normalized hydrogen density of the cloud, is the normalized temperature, and is the normalized thermal pressure. (We use here for solar metallicity gas, , and for fully ionized plasma). For a constant density spherical cloud, the cloud radius is given by .
We assume that the outer skin of this cloud will be ionized by a (plane-parallel) flux of H ionizing photons, . The metagalactic flux is estimated to be (Sternberg et al. 2002, and references therein), while high velocity clouds in the Galactic halo experience (Tufte et al., 2002). The thickness of this skin, , is determined by the balance of ionizations and recombinations, where the Case B recombination coefficient is . (Note that for optically thick clouds, , so that the surface averaged emission measure is a simple measure of the ionizing flux.) In this case, the skin depth is given by .
With these approximations, the ionized volume and mass of the cloud is given by or for small . The condition for a cloud to be fully ionized is
| (1) |
For very low ionization fraction (%), this criterion is well approximated by
| (2) |
so that an ionization fraction of less than 1% requires
The sensitivity of the ionization fraction of gas clouds to the outside pressure has been studied by Ferrara & Field (1994), Wolfire et al. (1995), and Maloney & Putman (2003) with comparable results. The normalization constant relating the pressure to the ionization fraction and cloud mass will depend on the assumed geometry. The presence of central condensation due to dark matter halos can also lower somewhat the pressure necessary to form neutral clouds (Sternberg et al., 2002).
These considerations show that not only are X-ray halos associated with galaxy formation more likely to form condensations, but that the higher pressures of such halos result in a much larger neutral fraction for the condensation. Using the density and temperature estimate for the X-ray halo of NGC 5746 (Rasmussen et al., 2006), the halo pressure is given by . Such a high bounding pressure would guarantee that clouds embedded in this hot gas will be primarily neutral. It is also interesting to note that the bounding pressure for the cloud can be either the thermal gaseous halo pressure or the ram pressure associated with a cloud’s motion through the halo. The one cloud showing counter rotation presumably has a much higher ram pressure than most of the rest of neutral gas detected and could be expected to have a higher neutral fraction.
At larger radius than that traced by the X-ray gas, it remains possible that the pressure will drop to such a point that a large population of fully ionized clouds might be present, but uncertainties in the X-ray data and analysis prevent such pressure variations from being assessed. Although the predicted emission measure from the front and back face of an individual cloud is a relatively low EM, a population of unresolved smaller clouds in the beam might boost the H emission to detectable levels. However, processes such as thermal conduction and evaporation should set a lower limit on the mass of cloud that can survive (Maller & Bullock, 2004). We have reexamined the H image of Rand (1996), smoothed to 1.5” resolution – yielding a noise level of 2.2 pc cm-6 – and find no evidence for such bright clouds in the halo.
To attempt to constrain the origin of the neutral gas halo in this and other galaxies, we can compare the neutral halo mass and mass fraction with estimates for other galaxies and look for correlations with other parameters (Table 4). In this comparison one should keep in mind that some of the galaxies are edge-on, one (NGC 6946) very much face-on, and some at intermediate inclinations (NGC 4559, NGC 2403 and NGC 253), and thus the characterization of halo gas necessarily varies from galaxy to galaxy. In the galaxies not viewed edge-on, the extraplanar gas is identified by its anomalous velocities compared to the bulk of the emission. We also note that the sensitivity and linear resolution of these observations vary significantly.
NGC 5746 ranks near the bottom of the table in terms of halo mass and mass fraction and also has one of the lowest levels of star formation activity, as estimated from /, lending support for an origin in a weak disk-halo flow. However, there is no discernable trend among the galaxies in this direction. NGC 6946 and NGC 253 stand out as having little HI in their halos given their star forming activity. The halo HI in the latter is particularly puzzling as it is found only on one side of the disk, away from the center of the galaxy (Boomsma et al., 2005). It is possible that the neutral gas has been swept radially outward by the central starburst outflow or that much of the halo gas is ionized. In NGC 6946, Boomsma (2007) note that the mass of halo gas more than doubles in a map at 64” resolution vs. one at 22” resolution. The rotation speeds of the galaxies span a factor of three, and thus the ability of supernova power to raise gas off the plane should vary significantly from galaxy to galaxy. In particular, the high fractions of halo HI in NGC 4559, NGC 2403 and UGC 7321 could be in part due to their low mass. Finally, there does not seem to be any correlation between halo mass or mass fraction and rotation speed alone.
However, at this point it is not unreasonable to conclude for NGC 5746 that the three non-counterrotating clouds in Table 3 may just as likely be due to a relatively inactive disk-halo cycle as to infall. One possible further clue to their origin would be infrared emission, and indeed imaging observations of this and other edge-ons with the Spitzer Space Telescope have been proposed. A detection of dust would argue against an origin in low-metallicity infalling gas.
A larger sample of edge-ons needs to be observed with comparable sensitivity and angular resolution to understand how the mass and kinematics (rotational lags in particular) of neutral halo gas relates to other galactic properties such as star formation activity, assuming that such gas can always be kinematically distinguished from warps and flares. A better measure of such activity than the somewhat crude tracer employed here would be the 24m surface density as measured by the Spitzer Space Telescope (Calzetti et al., 2005), hence 24m maps of a large sample of edge-ons would be of great benefit in such comparisons. For NGC 5746, deeper observations with higher spectral resolution are clearly called for in order to carry out a more complete census of halo gas that can be distinguished from the warp, so that its spatial distribution, kinematics, and cloud masses can be compared to the various models discussed here.
It should also be remembered that NGC 5746 is in a group environment, and some of the high-latitude gas may owe its origin to previous encounters, although the apparently low metallicity of the hot gas argues against encounters with other large galaxies.
We reemphasize that our best warp model (Model B) is not necessarily a unique fit to the data, especially because of asymmetries, but does demonstrate that a warp is a superior explanation to a lagging halo. It is not surprising that a warp is present in NGC 5746, as they are common in disk galaxies (e.g García-Ruiz et al., 2002). As far as the warp parameters are concerned, we note that it is generally the case in such galaxies (Briggs, 1990) that the line of nodes increases in the direction of galaxy rotation for radii beyond the Holmberg radius, which is 4.5’ for NGC 5746 (Holmberg, 1958). Our warp model implies an increase beginning just inside this radius. More recently, van der Kruit (2007) finds evidence from edge-ons that warps begin just beyond the radius where a truncation is evident in the stellar disk, but finds no indication of such a truncation in NGC 5746.
Finally, there is the possibility that the warp itself is caused by infall. The origin of warps is debated, but the possibility receiving most attention recently is that they are due to infalling gas with an angular momentum vector tilted with respect to the inner disk (Jiang & Binney, 1999; Shen & Sellwood, 2006). In the N-body simulations of Shen & Sellwood (2006), in which particles are injected into an outer torus inclined at a fixed angle with respect to the main disk, the warp can persist for several Gyr, making it difficult to infer the accretion history from the mere presence of a warp. That is, the large gas mass in the warp may reflect accretion over a substantial period of time and not necessarily demand a high accretion rate, as would more likely be the case such a large mass were contained in a lagging halo. On the other hand, if the centrally concentrated X-ray halo emission reflects the hot gas density, then one would expect any warm clouds recently formed by cooling out of the hot phase to be more centrally concentrated.
5 Conclusions
We have observed the massive edge-on spiral NGC 5746 with the VLA, in an attempt to find a vertically extended component of atomic gas as predicted by recent galaxy formation models. A high-latitude component has been discovered, but almost all of its mass, summing to M☉ – or about 15% of the total HI mass – is more readily explained as a warp than as a halo. The warp must be asymmetric in its column density distribution and geometry, but this is not unusual. If the high-latitude component is a lagging halo, it must feature a large mass in a rather narrow radial range, be centered at a large radius, and have a much larger degree of asymmetry than the warp. Even then, such a model has difficulty reproducing the narrowness of the high-latitude spectra as well as the warp model. We therefore conclude that a warp is the more likely explanation. The warp itself may be a result of infall according to recent models. It partially resolves into clouds of mass M☉ to M☉, accounting for about half the mass in the warp.
We have found four high-latitude features at velocities distinct from the warp, totaling about 108 M☉. These could be accreting onto the disk, or they may originate in a disk-halo flow, although there is no other sign of such a flow in this galaxy with little star forming activity. One cloud is counter-rotating and must have an external origin. The cloud properties are roughly comparable to those expected in the galaxy formation models of Kaufmann et al. (2006) and Sommer-Larsen (2006) where warm clouds form by thermal instabilities in the residual hot halos. However, these models have not been tailored to galaxies as massive as NGC 5746, and it would be interesting to compare our results with such a model. Given the calculated pressure in the hot halo, we expect any clouds to be primarily neutral. Alternatively, we cannot rule out a weak disk-halo flow as the origin for these clouds, except for the counter-rotating one. How neutral gaseous halos relate to other galaxian properties needs to be tested with more observations.
The disk shows the signature of radial inflow at the level of about 10 km s-1. This is most likely due to the bar, which is known to have a strong kinematical signature from optical long-slit spectra.
The group member NGC 5740 is also detected, albeit outside the half-power points of the primary beam. The most important result here is a broad extension of gas to the NE, which is more likely to be due to ram pressure than tidal stripping, although whether the condition for such stripping is met is unknown.
References
- Alton et al. (2000) Alton, P. B., Rand, R. J., Xilouris, E. M., Bevan, S., Ferguson, A. M., Davies, J. I., & Bianchi, S. 2000, A&AS, 145, 83
- Barbieri et al. (2005) Barbieri, C. V., Fraternali, F., Oosterloo, T., Bertin, G., Boomsma, R., & Sancisi, R. 2005, A&A, 439, 947
- Barnabè et al. (2006) Barnabè, M., Ciotti, L., Fraternali, F., & Sancisi, R. 2006, A&A, 446, 61
- Bendo et al. (2002) Bendo, G. J., Joseph, R. D., Wells, M., Gallais, P., Haas, M., Heras, A. M., Klaas, U., Laureijs, R. J., Leech, K., Lemke, D., Metcalfe, L., Rowan-Robinson, M., Schulz, B., & Telesco, C. 2002, AJ, 123, 3067
- Benjamin (2002) Benjamin, R. A. 2002, in Astronomical Society of the Pacific Conference Series, Vol. 276, Seeing Through the Dust: The Detection of HI and the Exploration of the ISM in Galaxies, ed. A. R. Taylor, T. L. Landecker, & A. G. Willis, 201–+
- Benson et al. (2003) Benson, A. J., Bower, R. G., Frenk, C. S., Lacey, C. G., Baugh, C. M., & Cole, S. 2003, ApJ, 599, 38
- Binney (1977) Binney, J. 1977, ApJ, 215, 483
- Binney (2004) —. 2004, MNRAS, 347, 1093
- Birnboim & Dekel (2003) Birnboim, Y., & Dekel, A. 2003, MNRAS, 345, 349
- Boomsma (2007) Boomsma, R. 2007, PhD thesis, Kapteyn Astronomical Institute, University of Groningen
- Boomsma et al. (2005) Boomsma, R., Oosterloo, T. A., Fraternali, F., van der Hulst, J. M., & Sancisi, R. 2005, A&A, 431, 65
- Braun & Walterbos (1992) Braun, R., & Walterbos, R. A. M. 1992, ApJ, 386, 120
- Bregman (1980) Bregman, J. N. 1980, ApJ, 236, 577
- Bregman & Pildis (1994) Bregman, J. N., & Pildis, R. A. 1994, ApJ, 420, 570
- Briggs (1990) Briggs, F. H. 1990, ApJ, 352, 15
- Brinks & Burton (1984) Brinks, E., & Burton, W. B. 1984, A&A, 141, 195
- Buote (2000) Buote, D. A. 2000, MNRAS, 311, 176
- Bureau & Freeman (1999) Bureau, M., & Freeman, K. C. 1999, AJ, 118, 126
- Calzetti et al. (2005) Calzetti, D., Kennicutt, Jr., R. C., Bianchi, L., Thilker, D. A., Dale, D. A., Engelbracht, C. W., Leitherer, C., Meyer, M. J., Sosey, M. L., Mutchler, M., Regan, M. W., Thornley, M. D., Armus, L., Bendo, G. J., Boissier, S., Boselli, A., Draine, B. T., Gordon, K. D., Helou, G., Hollenbach, D. J., Kewley, L., Madore, B. F., Martin, D. C., Murphy, E. J., Rieke, G. H., Rieke, M. J., Roussel, H., Sheth, K., Smith, J. D., Walter, F., White, B. A., Yi, S., Scoville, N. Z., Polletta, M., & Lindler, D. 2005, ApJ, 633, 871
- Carrillo et al. (1999) Carrillo, R., Masegosa, J., Dultzin-Hacyan, D., & Ordoñez, R. 1999, Revista Mexicana de Astronomia y Astrofisica, 35, 187
- Chung et al. (2007) Chung, A., van Gorkom, J. H., Kenney, J. D. P., & Vollmer, B. 2007, ApJ, 659, L115
- Collins et al. (2002) Collins, J. A., Benjamin, R. A., & Rand, R. J. 2002, ApJ, 578, 98
- Collins et al. (2007) Collins, J. A., Shull, J. M., & Giroux, M. L. 2007, ApJ, 657, 271
- Dahlem et al. (2001) Dahlem, M., Lazendic, J. S., Haynes, R. F., Ehle, M., & Lisenfeld, U. 2001, A&A, 374, 42
- Dahlem et al. (2006) Dahlem, M., Lisenfeld, U., & Rossa, J. 2006, A&A, 457, 121
- Dekel & Birnboim (2006) Dekel, A., & Birnboim, Y. 2006, MNRAS, 368, 2
- Dettmar (1990) Dettmar, R.-J. 1990, A&A, 232, L15
- Erwin (2005) Erwin, P. 2005, MNRAS, 364, 283
- Fall & Rees (1985) Fall, S. M., & Rees, M. J. 1985, ApJ, 298, 18
- Ferrara & Field (1994) Ferrara, A., & Field, G. B. 1994, ApJ, 423, 665
- Field (1965) Field, G. B. 1965, ApJ, 142, 531
- Fraternali & Binney (2006) Fraternali, F., & Binney, J. J. 2006, MNRAS, 366, 449
- Fraternali et al. (2002) Fraternali, F., van Moorsel, G., Sancisi, R., & Oosterloo, T. 2002, AJ, 123, 3124
- García-Ruiz et al. (2002) García-Ruiz, I., Sancisi, R., & Kuijken, K. 2002, A&A, 394, 769
- Giuricin et al. (2000) Giuricin, G., Marinoni, C., Ceriani, L., & Pisani, A. 2000, ApJ, 543, 178
- González-Martín et al. (2006) González-Martín, O., Masegosa, J., Márquez, I., Guerrero, M. A., & Dultzin-Hacyan, D. 2006, A&A, 460, 45
- Haffner et al. (2003) Haffner, L. M., Reynolds, R. J., Tufte, S. L., Madsen, G. J., Jaehnig, K. P., & Percival, J. W. 2003, ApJS, 149, 405
- Heald et al. (2006a) Heald, G. H., Rand, R. J., Benjamin, R. A., & Bershady, M. A. 2006a, ApJ, 647, 1018
- Heald et al. (2007) —. 2007, ApJ, 663, 933
- Heald et al. (2006b) Heald, G. H., Rand, R. J., Benjamin, R. A., Collins, J. A., & Bland-Hawthorn, J. 2006b, ApJ, 636, 181
- Holmberg (1958) Holmberg, E. 1958, Meddelanden fran Lunds Astronomiska Observatorium Serie II, 136, 1
- Howk & Savage (1999) Howk, J. C., & Savage, B. D. 1999, AJ, 117, 2077
- Irwin (1994) Irwin, J. A. 1994, ApJ, 429, 618
- Irwin et al. (1999) Irwin, J. A., English, J., & Sorathia, B. 1999, AJ, 117, 2102
- Irwin & Madden (2006) Irwin, J. A., & Madden, S. C. 2006, A&A, 445, 123
- Jiang & Binney (1999) Jiang, I.-G., & Binney, J. 1999, MNRAS, 303, L7
- Kaufmann et al. (2006) Kaufmann, T., Mayer, L., Wadsley, J., Stadel, J., & Moore, B. 2006, MNRAS, 370, 1612
- Kereš et al. (2005) Kereš, D., Katz, N., Weinberg, D. H., & Davé, R. 2005, MNRAS, 363, 2
- Kuijken & Merrifield (1995) Kuijken, K., & Merrifield, M. R. 1995, ApJ, 443, L13
- Lee & Irwin (1997) Lee, S.-W., & Irwin, J. A. 1997, ApJ, 490, 247
- Lee et al. (2001) Lee, S.-W., Irwin, J. A., Dettmar, R.-J., Cunningham, C. T., Golla, G., & Wang, Q. D. 2001, A&A, 377, 759
- Maller & Bullock (2004) Maller, A. H., & Bullock, J. S. 2004, MNRAS, 355, 694
- Maloney & Putman (2003) Maloney, P. R., & Putman, M. E. 2003, ApJ, 589, 270
- Matthews & Wood (2003) Matthews, L. D., & Wood, K. 2003, ApJ, 593, 721
- Murray & Lin (1990) Murray, S. D., & Lin, D. N. C. 1990, ApJ, 363, 50
- Nagar et al. (2005) Nagar, N. M., Falcke, H., & Wilson, A. S. 2005, A&A, 435, 521
- Norman & Ikeuchi (1989) Norman, C. A., & Ikeuchi, S. 1989, ApJ, 345, 372
- Oosterloo et al. (2007) Oosterloo, T., Fraternali, F., & Sancisi, R. 2007, AJ, 134, 1019
- Pedersen et al. (2006) Pedersen, K., Rasmussen, J., Sommer-Larsen, J., Toft, S., Benson, A. J., & Bower, R. G. 2006, New Astronomy, 11, 465
- Putman et al. (2003) Putman, M. E., Staveley-Smith, L., Freeman, K. C., Gibson, B. K., & Barnes, D. G. 2003, ApJ, 586, 170
- Rand (1996) Rand, R. J. 1996, ApJ, 462, 712
- Rand et al. (1990) Rand, R. J., Kulkarni, S. R., & Hester, J. J. 1990, ApJ, 352, L1
- Rasmussen et al. (2006) Rasmussen, J., Sommer-Larsen, J., Pedersen, K., Toft, S., Benson, A., Bower, R. G., & Olsen, L. F. 2006, ArXiv Astrophysics e-prints
- Reynolds et al. (1973) Reynolds, R. J., Roesler, F. L., & Scherb, F. 1973, ApJ, 179, 651
- Reynolds et al. (2001) Reynolds, R. J., Sterling, N. C., & Haffner, L. M. 2001, ApJ, 558, L101
- Rossa & Dettmar (2003a) Rossa, J., & Dettmar, R.-J. 2003a, A&A, 406, 493
- Rossa & Dettmar (2003b) —. 2003b, A&A, 406, 505
- Schneider et al. (1986) Schneider, S. E., Helou, G., Salpeter, E. E., & Terzian, Y. 1986, AJ, 92, 742
- Sengupta & Balasubramanyam (2006) Sengupta, C., & Balasubramanyam, R. 2006, MNRAS, 369, 360
- Shapiro & Field (1976) Shapiro, P. R., & Field, G. B. 1976, ApJ, 205, 762
- Shen & Sellwood (2006) Shen, J., & Sellwood, J. A. 2006, MNRAS, 370, 2
- Sofue & Rubin (2001) Sofue, Y., & Rubin, V. 2001, ARA&A, 39, 137
- Sommer-Larsen (2006) Sommer-Larsen, J. 2006, ApJ, 644, L1
- Springob et al. (2005) Springob, C. M., Haynes, M. P., Giovanelli, R., & Kent, B. R. 2005, ApJS, 160, 149
- Sternberg et al. (2002) Sternberg, A., McKee, C. F., & Wolfire, M. G. 2002, ApJS, 143, 419
- Strickland et al. (2004) Strickland, D. K., Heckman, T. M., Colbert, E. J. M., Hoopes, C. G., & Weaver, K. A. 2004, ApJ, 606, 829
- Swaters et al. (1997) Swaters, R. A., Sancisi, R., & van der Hulst, J. M. 1997, ApJ, 491, 140
- Thilker et al. (2004) Thilker, D. A., Braun, R., Walterbos, R. A. M., Corbelli, E., Lockman, F. J., Murphy, E., & Maddalena, R. 2004, ApJ, 601, L39
- Toft et al. (2002) Toft, S., Rasmussen, J., Sommer-Larsen, J., & Pedersen, K. 2002, MNRAS, 335, 799
- Tufte et al. (2002) Tufte, S. L., Wilson, J. D., Madsen, G. J., Haffner, L. M., & Reynolds, R. J. 2002, ApJ, 572, L153
- Tüllmann et al. (2006a) Tüllmann, R., Breitschwerdt, D., Rossa, J., Pietsch, W., & Dettmar, R.-J. 2006a, A&A, 457, 779
- Tüllmann et al. (2006b) Tüllmann, R., Pietsch, W., Rossa, J., Breitschwerdt, D., & Dettmar, R.-J. 2006b, A&A, 448, 43
- Uson & Matthews (2003) Uson, J. M., & Matthews, L. D. 2003, AJ, 125, 2455
- van der Kruit (2007) van der Kruit, P. C. 2007, A&A, 466, 883
- Vollmer et al. (2001) Vollmer, B., Cayatte, V., Balkowski, C., & Duschl, W. J. 2001, ApJ, 561, 708
- Wakker (2004) Wakker, B. P. 2004, Ap&SS, 289, 381
- Wang (2005) Wang, Q. D. 2005, in Astronomical Society of the Pacific Conference Series, Vol. 331, Extra-Planar Gas, ed. R. Braun, 329–+
- White & Rees (1978) White, S. D. M., & Rees, M. J. 1978, MNRAS, 183, 341
- Wolfire et al. (1995) Wolfire, M. G., McKee, C. F., Hollenbach, D., & Tielens, A. G. G. M. 1995, ApJ, 453, 673
- Zwaan et al. (1997) Zwaan, M. A., Briggs, F. H., Sprayberry, D., & Sorar, E. 1997, ApJ, 490, 173
| Model | Description | Incl. | P.A. | Disk rotation | High-latitude |
|---|---|---|---|---|---|
| (degrees) | (degrees) | curve | NH profile | ||
| A | warp along | Figure 11 | 350 | Figure 8 | Figure 6 |
| line of sight | |||||
| B | warp at angle to | Figure 11 | Figure 11 | Figure 8 | Figure 6 |
| line of sight | |||||
| C | lagging halo | 86.25 | 350 | Figure 8 | Figure 6 |
| (radial profile of disk) | |||||
| D | lagging halo | 86.25 | 350 | Figure 8 | Figure 6 |
| (narrow ring) | |||||
| E | lagging halo | 86.25 | 350 | Figure 8 | Figure 6 |
| (broader ring) |
| NumberaaNumbers generally run in a counter-clockwise direction around the disk starting at the northern end. | R.A. | Decl. | Offset along major axisbbOffsets are from the dynamical center determined in the text. | Offset along minor axisbbOffsets are from the dynamical center determined in the text. | Mass |
|---|---|---|---|---|---|
| (J2000.0) | (J2000.0) | (arcmin) | (arcmin) | (106 M☉) | |
| 1 | 14h 44m 53.5s | 2∘ 2’ 13” | 4.95 | -0.25 | 39 |
| 2 | 14h 44m 56.0s | 2∘ 1’ 48” | 4.45 | -0.75 | 7.4 |
| 3 | 14h 44m 57.0s | 2∘ 1’ 21” | 4.00 | -0.85 | 14 |
| 4 | 14h 44m 56.9s | 2∘ 0’ 56” | 3.60 | -0.85 | 7.9 |
| 5 | 14h 44m 57.1s | 2∘ 0’ 12” | 2.90 | -0.75 | 14 |
| 6 | 14h 44m 57.3s | 1∘ 59’ 44” | 2.45 | -0.75 | 15 |
| 7 | 14h 44m 59.0s | 1∘ 59’ 14” | 1.90 | -1.10 | 7.6 |
| 8 | 14h 44m 57.8s | 1∘ 58’ 32” | 1.15 | -0.75 | 31 |
| 9 | 14h 45m 0.2s | 1∘ 57’ 24” | -0.05 | -1.05 | 6.8 |
| 10 | 14h 44m 59.6s | 1∘ 56’ 36” | -0.80 | -0.75 | 16 |
| 11 | 14h 45m 1.0s | 1∘ 55’ 8” | -2.30 | -0.85 | 36 |
| 12 | 14h 45m 1.4s | 1∘ 53’ 52” | -3.55 | -0.70 | 35 |
| 13 | 14h 45m 2.7s | 1∘ 53’ 30” | -4.00 | -1.00 | 12 |
| 14 | 14h 45m 2.9s | 1∘ 52’ 0” | -5.55 | -0.75 | 14 |
| 15 | 14h 44m 59.2s | 1∘ 52’ 1” | -5.25 | 0.15 | 14 |
| 16 | 14h 44m 58.4s | 1∘ 53’ 2” | -4.25 | 0.10 | 40 |
| 17 | 14h 44m 57.2s | 1∘ 53’ 25” | -3.85 | 0.35 | 43 |
| 18 | 14h 44m 55.9s | 1∘ 54’ 8” | -3.15 | 0.45 | 84 |
| 19 | 14h 44m 53.8s | 1∘ 54’ 1” | -2.80 | 1.00 | 3.7 |
| 20 | 14h 44m 54.0s | 1∘ 56’ 28” | -0.70 | 0.60 | 31 |
| 21 | 14h 44m 52.4s | 1∘ 57’ 22” | 0.20 | 0.85 | 23 |
| 22 | 14h 44m 52.5s | 1∘ 58’ 8” | 1.10 | 0.75 | 39 |
| 23 | 14h 44m 51.6s | 1∘ 59’ 2” | 1.95 | 0.80 | 31 |
| 24 | 14h 44m 49.7s | 1∘ 59’ 19” | 2.30 | 1.20 | 14 |
| 25 | 14h 44m 51.9s | 1∘ 59’ 56” | 2.75 | 0.50 | 41 |
| 26 | 14h 44m 50.1s | 1∘ 59’ 55” | 2.90 | 1.00 | 12 |
| 27 | 14h 44m 50.2s | 2∘ 0’ 14” | 3.20 | 0.95 | 9.5 |
| 28 | 14h 44m 50.2s | 2∘ 0’ 42” | 4.55 | 0.50 | 27 |
| 29 | 14h 44m 50.8s | 2∘ 1’ 42” | 4.85 | 0.90 | 12 |
| 30 | 14h 44m 49.0s | 2∘ 1’ 54” | 4.85 | 0.90 | 13 |
| Number | R.A. | Decl. | Offset along major axisaaOffsets are from the dynamical center determined in the text. | Offset along minor axisaaOffsets are from the dynamical center determined in the text. | Mass | Range in |
|---|---|---|---|---|---|---|
| (J2000.0) | (J2000.0) | (arcmin) | (arcmin) | (106 M☉) | (km s-1) | |
| 1 | 14h 44m 56.6s | 1∘ 59’ 19” | 2.00 | -0.45 | 7.2 | 1933–2017 |
| 2 | 14h 44m 52.2s | 1∘ 58’ 43” | 1.70 | 0.75 | 24 | 1493–1808 |
| 3 | 14h 44m 58.0s | 1∘ 58’ 34” | 1.15 | -0.70 | 56 | 1933–2058 |
| 4 | 14h 44m 56.0s | 1∘ 54’ 19” | -2.90 | 0.60 | 7.9 | 1391–1495 |
| Galaxy | HI halo mass | Percentage of HI | / | Rotation speedaaAn approximate value for the flat part of the disk rotation curve. |
|---|---|---|---|---|
| ( M☉) | mass in halo | ( erg s-1 kpc-2) | (km s-1) | |
| NGC 891bbHalo mass and rotation speed from Oosterloo et al. (2007) | 12 | 30 | 3.5 | 225 |
| NGC 4559ccHalo mass and rotation speed from Barbieri et al. (2005) | 6 | 10 | 0.8 | 120 |
| NGC 3044ddHalo mass and rotation speed from Lee & Irwin (1997) | 4 | 7 | 4.7 | 150 |
| NGC 2403eeHalo mass and rotation speed from Fraternali et al. (2002) | 3 | 10 | 1.1 | 135 |
| NGC 6946ffHalo mass and rotation speed from Boomsma (2007) | 3 | 4 | 9.6 | 170 |
| UGC 7321ggHalo mass from Matthews & Wood (2003) and rotation speed from Uson & Matthews (2003) | 1.3 | 12 | 0.1 | 105 |
| NGC 5746 | 1.0 | 1 | 0.4 | 310 |
| NGC 253hhHalo mass and rotation speed from Boomsma et al. (2005) | 0.8 | 3 | 10.6 | 230 |
| M31iiHalo mass from Thilker et al. (2004), total mass from Braun & Walterbos (1992), rotation speed from Brinks & Burton (1984) | 0.35 | 1 | 0.2 | 270 |