CCD photometric and mass function study of 9 young Large Magellanic Cloud star clusters ††thanks: Based on observations collected at the European Southern Observatory, Chile.
Abstract
We present CCD photometric and mass function study of 9 young Large Magellanic Cloud star clusters namely NGC 1767, NGC 1994, NGC 2002, NGC 2003, NGC 2006, SL 538, NGC 2011, NGC 2098 and NGC 2136. The data reaching down to 21 mag, are collected from 3.5-meter NTT/EFOSC2 in sub-arcsec seeing conditions. For NGC 1767, NGC 1994, NGC 2002, NGC 2003, NGC 2011 and NGC 2136, broad band photometric CCD data are presented for the first time. Seven of the 9 clusters have ages between 16 to 25 Myr while remaining two clusters have ages Myr (NGC 2098) and Myr (NGC 2136). For 7 younger clusters, the age estimates based on a recent model and the integrated spectra are found to be systematically lower ( 10 Myr) from the present estimate. In the mass range of , the MF slopes for 8 out of nine clusters were found to be similar with the value of ranging from to . For NGC 1767 it is flatter with . Mass segregation effects are observed for NGC 2002, NGC 2006, NGC 2136 and NGC 2098. This is consistent with the findings of Kontizas et al. (1998) for NGC 2098. Presence of mass segregation in these clusters could be an imprint of star formation process as their ages are significantly smaller than their dynamical evolution time. Mean MF slope of derived for a sample of 25 young ( Myr) dynamically unevolved LMC stellar systems provide support for the universality of IMF in the intermediate mass range .
keywords:
galaxies: clusters: general - galaxies: Magellanic Clouds1 Introduction
The distribution of stellar masses that form in one star-formation event in a given volume of space is called initial mass function (IMF). Some theoretical studies consider that the IMF should vary with the pressure and temperature of the star-forming cloud in such a way that higher-temperature regions ought to produce higher average stellar masses while others have exactly opposite views (see Larson 1998; Elmegreen 2000 and references therein). Detailed knowledge of the IMF shape in different star forming environments is therefore essential. One would like to know whether it is universal in time and space or not. For this, in a galaxy, its young (age 100 Myr) star clusters of different ages, abundance etc. need to be observed, as they contain dynamically unevolved, (almost) coeval sets of stars at the same distance with the same metallicity. For a number of such reasons, populous young star clusters of the Large Magellanic Clouds (LMC) are the most suitable objects for investigating the IMF. They provide physical conditions not present in our Galaxy e.g. stellar richness, metallicity and mass ranges (see Sagar 1993, 1995 and references therein). Unlike the galactic counterparts, where corrections for interstellar absorption are not always trivial since it could be large as well as variable (Sagar, 1987; Yadav & Sagar, 2001; Kumar et al., 2004), for LMC star clusters it is relatively small. Its treatment is therefore not a problem. Furthermore, choosing young (age Myr) clusters reduces the effects of dynamical evolution on their MF. The present day mass function of these stellar systems can therefore be considered as the IMF. The study of young LMC star clusters is thus important for providing the answer to the question of universality of the IMF. Both ground and Hubble Space Telescope (HST) observations have therefore been obtained (see Sagar & Richtler 1991; Brocato et al. 2001; Matteucci et al. 2002 and references therein) for a few of the large number of young LMC star clusters (Bica et al., 1999). The potential offered by them has not been fully utilised as still a large fraction of them are unobserved.
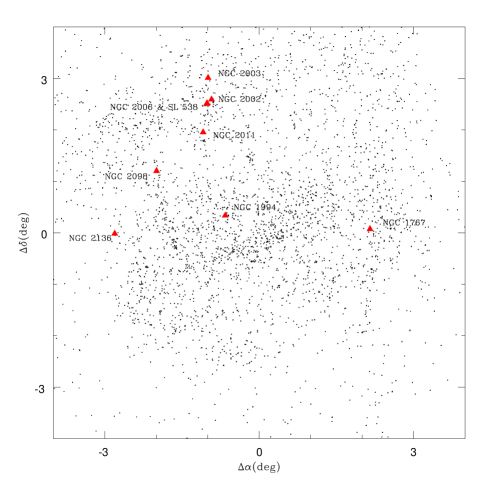
In this paper we derive mass function (MF) slopes using new broad band CCD photometric observations of the stars in 9 young LMC star clusters namely NGC 1767, NGC 1994, NGC 2002, NGC 2003, NGC 2006, SL 538, NGC 2011, NGC 2098 and NGC 2136. Their integrated photometric colours indicate that all of them belong to SWB (Searle et al., 1980) class of 0 or I and hence are very young with ages Myr (Elson & Fall, 1985; Bica et al., 1996) except NGC 2136 which belongs to SWB class of III indicating and age between 70 - 200 Myr. Table 1 lists the relevant information available prior to this study. All the clusters are rich indicating higher stellar density (Bica & Schmitt, 1995) and thus most suitable for the MF study. Except NGC 2011, all are elliptical in size with major axes diameters ranging from 13 to 28. Except for NGC 2002 and NGC 2098, all others are candidate members of either a pair or a multiple system (see Dieball et al. 2002). Locations of the target clusters are shown in Fig. 1. Most of them lie towards north-east side of the LMC bar harboring young star forming regions in contrast to the intermediate age (1 - 3 Gyr) cluster field of the bar. NGC 1767 lies south-west region of the LMC bar. Being spread over a wide region ( 5° 10°), the sample may reflect different star forming environments. It is therefore suitable for testing the universality of the IMF. When CCD observations were carried out in 1990, no detailed photometric observations and MF studies had been published. However, in the mean time some CCD photometric observations have been published for a few of the clusters under study. A brief description of the previous work on the clusters under study is given below.
| Clusters | Dmaj | Dmin | P.A. | age(Myr) | Remarks | ||
|---|---|---|---|---|---|---|---|
| NGC1767 | 4 | 130 | 120 | 30° | 0-30 | mM(39) | |
| NGC1994 | 5 28 21 | 1.60 | 1.50 | 170 | 10-30 | mM(275) | |
| NGC2002 | 5 30 21 | 1.90 | 1.70 | 20 | 10-30 | ||
| NGC2003 | 5 30 54 | 1.70 | 1.40 | 70 | 10-30 | mP(297) | |
| SL538 | 5 31 18 | 1.40 | 1.40 | 182 | mP(303) | ||
| NGC2006 | 5 31 19 | 1.60 | 1.40 | 140 | 22.52.5 | mP(303) | |
| NGC2011 | 5 32 19 | 1.00 | 1.00 | 10 - 30 | mP(320) | ||
| NGC2098 | 5 42 30 | 2.20 | 2.00 | 140 | 10 - 30 | ||
| NGC2136 | 5 52 59 | 2.80 | 2.50 | 140 | 70-200 | mP(456) |
1.1 Previous work
-
•
NGC 1767. This, a member of triple star cluster system, is located in the OB association LH 8. Integrated () and () colors indicate that the cluster is young with an age of 10 Myr.
-
•
NGC 1994. This, located in LMC DEM 210 region, is a member of a 5-cluster system. Its irregular size is largest amongst them. An age of about 5 - 30 Myr has been derived for the cluster from its integrated photometric colour observations.
-
•
NGC 2002. This single cluster is located in the OB association LH 77 in the supergiant shell LMC 4 region. The cluster center is condensed, but the outer part is resolved. Integrated light observations indicate an age of 10 - 30 Myr along with the presence of a few red supergiants (Bica et al., 1996).
-
•
NGC 2003. Integrated photometric observations indicate an age of 10 - 30 Myr for this cluster located in the Shapley III region of the LMC. Its shape on the photographic image is elongated with resolved outer parts.
-
•
NGC 2006 and SL 538. This binary star cluster is located in the northwestern part of the OB association LH 77 in supergiant shell LMC 4. The clusters are separated by on the sky corresponding to a linear separation of 13.3 pc at the distance of LMC. Integrated photometric observations obtained by Bhatia (1992) and Bica et al. (1996) indicate a similar age for both the clusters. Using low-resolution objective prism spectra and integrated IUE spectra, Kontizas et al. (1998) suggested that this binary cluster may merge in 10 Myr. Broad band and Hα CCD photometric observations were obtained by Dieball & Grebel (1998). Based on the colour-magnitude diagrams (CMDs) of the clusters they derived an age of Myr for SL 538 and of Myr for NGC 2006. The MF slopes obtained for both the clusters were consistent with that of Salpeter (1955) and indicated similar total masses. These studies thus indicates near-simultaneous formation of the cluster pair in the same giant molecular cloud.
-
•
NGC 2011. This is located in the OB association region LH 75. Its age estimated from the integrated photometric observations is between 10 to few tens of Myr. Its photographic image indicates that it is elongated, fairly condensed and partly resolved cluster. A recent analysis of its stellar content using HST observations reveal that it has two parallel main sequence branches, and may be a binary system (Gouliermis et al., 2006). However, the analysis also indicate that both populations might have formed in a single star forming event as the redder stars are situated in the central half arcmin region and are thought to be embedded in the dust and gas, while the blue stars are spread in the outer region up to 1 arcmin.
-
•
NGC 2098. This is another single cluster amongst the objects under study. The first broad band CCD photometric observations have been presented by Kontizas et al. (1998). They derived an age of 63 - 79 Myr and found strong evidence for mass segregation in agreement with their earlier studies based on the photographic observations. However, poor quality of their CCD data was indicated by the authors.
-
•
NGC 2136. This is the brighter component of the young binary globular cluster NGC 2136/ NGC 2137 in the LMC. The angular separation between the components is about 13. Hilker et al. (1995) using Stromgren CCD photometry of the clusters indicates their common origin. They indicate an age of 80 Myr and metallicity [Fe/H] = dex for the cluster while Dirsch et al. (2000) derive an age of Myr but the same metallicity. The cluster contains a number of Cepheids as well as red giants.
The present CCD observations, in combination with earlier observations, have been used to estimate and/or interpret the interstellar reddening to the cluster regions, ages and mass functions of the clusters. Section 2 deals with the observational data, reduction procedures and comparisons with the published photometric data. In section 3, we analyse the stellar surface density profiles, CMDs and MFs of the sample clusters. Last section is presented with the results and discussions.
| Object | Date | Exp | Seeing | N | |
|---|---|---|---|---|---|
| (Year 1990) | (s) | (″) | |||
| NGC 1767 | Jan 10/11 | B | 20 | 1.05 | 632 |
| V | 10 | 0.77 | |||
| R | 10 | 0.81 | |||
| NGC 1994 | Jan 10/11 | B | 20 | 1.02 | 1156 |
| V | 10,20 | 0.84 | |||
| R | 10,203 | 0.81 | |||
| I | 5 | 0.81 | |||
| NGC 2002 | Jan 10/11 | B | 40 | 0.98 | 799 |
| V | 20 | 0.72 | |||
| R | 15 | 0.88 | |||
| I | 10,20 | 0.86 | |||
| NGC 2002F | Jan 10/11 | B | 20 | 1.00 | 337 |
| V | 10 | 0.84 | |||
| R | 10 | 0.72 | |||
| NGC 2003 | Jan 10/11 | B | 60 | 0.81 | 729 |
| V | 20 | 0.74 | |||
| R | 20 | 0.72 | |||
| I | 10 | 0.72 | |||
| NGC 2006 | Jan 10/11 | B | 20 | 0.93 | 747 |
| and | V | 10 | 0.86 | ||
| SL 538 | R | 10 | 1.02 | ||
| Jan 12/11 | B | 45 | 0.91 | ||
| V | 20, 302 | 1.00 | |||
| R | 82 | 0.88 | |||
| NGC 2011 | Jan 10/11 | B | 60 | 0.91 | 610 |
| V | 20 | 0.84 | |||
| R | 15 | 0.81 | |||
| NGC 2098 | Jan 10/11 | B | 180 | 1.02 | 686 |
| V | 60 | 0.86 | |||
| R | 15 | 0.81 | |||
| NGC 2136 | Jan 12/13 | B | 60 | 1.00 | 1266 |
| V | 30 | 0.93 | |||
| R | 15 | 0.86 | |||
| NGC 2136F | Jan 13/14 | B | 60 | 1.09 | 270 |
| V | 30 | 0.88 | |||
| R | 152 | 0.86 |
2 Observations and Data reductions
The observations, procedures for data reductions are described in this section along with the photometric accuracy and comparison with published photometry.
2.1 Photometric data
The broad band CCD photometric observations were carried out at the European Southern Observatory (ESO), La Silla, Chile, in 1990 between January 10 and 13 using the ESO Faint Object Spectrograph and Camera-2 (EFOSC-2) mounted at the Nasmyth focus of the 3.5-m New Technology Telescope (NTT). The filters used in these observations were standard Bessel BVR (ESO#583, 584, 585) and Gunn i (ESO#618). At the focus of the telescope, a 27m square pixel of the 512512 size Tektronix CCD (#16) chip corresponds to 023 and entire chip covers a square area of side 20 on the sky. The read out noise for the system was 14 e with a gain factor of 5.5 e/ADU. During our observations the seeing varied from about 07 to 12 (see Table 2) with a mean value of 10 for band and about 08 for and bands. We obtained only one image for all clusters, as the CCD size was large enough to cover the entire region of the compact clusters. In the case of NGC 2002 and the binary cluster NGC 2136, we have also imaged a field region located about away from the center of clusters. Table 2 lists the log of observations. Most of the observations were taken during commissioning phase of the EFOSC2 when the instrument rotator was still not available. As the image on NTT rotates during exposures at rates which depends upon the position on the sky, only exposures of up to at most few minutes were possible. Bias frames were taken intermittently. Flat-field exposures were made of the twilight sky. Dark current frames were also secured.
Nine Landolt (1992) standards covering a range in brightness () as well as in colour () were observed for calibration purposes. The excellent photometric quality of the sky during the observations have ensured the accuracy of the data presented here.
2.2 Reductions
| Magnitude range | ||||
|---|---|---|---|---|
| 0.001 | 0.003 | 0.012 | 0.02 | |
| 14.015.0 | 0.005 | 0.02 | 0.03 | 0.04 |
| 15.016.0 | 0.01 | 0.02 | 0.03 | 0.04 |
| 16.017.0 | 0.02 | 0.03 | 0.04 | 0.04 |
| 17.018.0 | 0.04 | 0.04 | 0.05 | 0.05 |
| 18.019.0 | 0.05 | 0.05 | 0.07 | 0.07 |
| 19.020.0 | 0.07 | 0.08 | 0.08 | 0.08 |
| ID | X | Y | ||||
|---|---|---|---|---|---|---|
| n1767_1 | 241.02 | 163.95 | - | |||
| n1767_2 | 251.32 | 91.73 | - | |||
| n1767_3 | 256.84 | 147.23 | - | |||
| n1767_4 | 60.10 | 34.90 | - | |||
| - | - | - | - | - | - | - |
| - | - | - | - | - | - | - |

The data were reduced using computing facilities available at the ARIES Observatory, Nainital. Initial processing of the data frames was done in the usual manner using the IRAF/MIDAS data reduction package. The flat-field frames were summed for each colour band. The evenness of flat fields is better than a few percent in all the filters.
The magnitude estimate of a star on the data frames has been done using DAOPHOT software (Stetson, 1987, 1992). Further processing and conversion of these raw instrumental magnitudes into the standard photometric system have been done using the procedure outlined by Stetson (1992). The image parameters and errors provided by DAOPHOT were used to reject poor measurements. About 10% of the stars were rejected in this process. The DAOMASTER program was used for cross identifying the stars measured on different frames of a cluster region. In those cases where brighter stars are saturated on deep exposure frames, their magnitudes have been taken only from the short exposure frames. Most of the stars brighter than V 10.5 mag could not be measured because they are saturated even on the shortest exposure frames.
In deriving the colour equations for the CCD system and evaluating the zero-points for the data frames, we have used mean values of atmospheric extinction coefficients of the site viz 0.3, 0.2, 0.15 and 0.1 mag for and band respectively. The colour equations for the CCD system are determined by performing aperture photometry on the photometric standards. By fitting least square linear regressions in the observed aperture magnitudes as a function of the standard photometric indices, following colour equations are derived for the system:
where and are the standard magnitudes provided by Landolt (1992). The and are the CCD aperture magnitudes. The RMS deviations of the Landolt standards around the fitted magnitudes are found to be 0.033, 0.035, 0.027 and 0.026 mag respectively for and . For establishing the local standards, we selected about 30 isolated stars in each field and used the DAOGROW program for construction of the aperture growth curve required for determining the difference between aperture and profile-fitting magnitudes. These differences, together with the differences in exposure times and atmospheric extinction, were used in evaluating zero-points for local standards in the data frames. The zero-points are uncertain by 0.013 mag in and .
The internal errors estimated from the scatter in the individual measures of different exposures in NGC 2002 cluster region are listed in Table 3 as a function of magnitude for all filters. The errors become large ( mag) for stars fainter than 20 mag. They can be considered as representative of the accuracy of our photometry in all the cluster and field regions under study. The number of stars measured in different photometric passbands in an imaged region are given in Table 2. The X and Y pixel coordinates as well as , and CCD magnitudes of the stars observed in the regions of NGC 1767, NGC 1994, NGC 2002, NGC 2003, NGC 2006, SL 538, NGC 2011, NGC 2098 and NGC 2136 are listed in Table 4. Stars observed by others have been identified in the last column of the table. Only sample table is presented here; the entire table is available in electronic version of the article and also from the authors.

| Cluster | Core | Ring 1 | Ring 2 | |||
|---|---|---|---|---|---|---|
| NGC 1767 | 255 | 355 | 150 | |||
| NGC 1994 | 240 | 275 | 240 | |||
| NGC 2002 | 250 | 280 | 240 | |||
| NGC 2003 | 265 | 240 | 220 | |||
| NGC 2006 | 285 | 90 | 120 | |||
| SL 538 | 230 | 310 | 110 | |||
| NGC 2011 | 240 | 245 | 220 | |||
| NGC 2098 | 260 | 250 | 160 | |||
| NGC 2136 | 280 | 275 | 260 |
2.3 Photometric Comparisons
We compare the present CCD photometry with the published ones for the clusters NGC 2006, SL538 and NGC 2098 in the following subsections.
NGC 2006 and SL 538. The present photometry has 297 stars in common with the CCD photometric data given by Dieball & Grebel (1998). The plot of the differences between the two data sets (see Fig. 2) indicate agreement between the V magnitudes of the two data sets and the present photometry is 0.04 mag brighter in while the and colour agrees fairly well. The RMS scatter in , and was found to be 0.08 mag, 0.12 mag and 0.09 mag respectively and it can be understood in terms of the error present in both the photometries. There are a few outliers which appear to be mostly stars located in the nucleus region of the cluster and were treated as blended multiple stars in one of the photometry. We also note that the plot of differences with the color show a small systematic trend in and it is apparent also to some extent in . This may arise due to a second order color term from the B filter or due to a minor calibration uncertainties present in one of the photometry.
NGC 2098. There are 174 stars common between present photometry and the data given by Kontizas et al. (1998). The differences between these data are plotted in Fig. 3. They indicate that there is a constant difference between and magnitudes of the two data sets. We suspect that poor observing conditions during the Kontizas et al. (1998) observations may be responsible for the observed differences.
3 Data Analysis
The photometric data of the clusters under study have been used to study extent of the clusters along with their colour-magnitude diagrams (CMDs) and mass function in the following sub sections.
3.1 Radial density profiles
The spatial surface density profile of stars can be used to determine cluster radius, , which is taken as the distance from the cluster center where the average cluster contribution becomes negligible with respect to the background stellar field. It can also be used to estimate extent of field star contamination in the cluster region. For this, first we derive the cluster center iteratively by calculating average X and Y positions of stars within 150 pixels from an eye estimated centre, until it converged to a constant value. An error of about 10 to 20 pixels is expected in locating the cluster centre. The (X,Y) pixel coordinates of the cluster centres are given in Table 5. For determining the radial surface density of stars in a cluster, the imaged area has been divided into a number of concentric circles with respect to the above estimated cluster centre, in such a way that each zone contains statistically significant numbers of stars. The number density of stars, , in zone has been evaluated as
where is the number of stars up to 20 mag and is the area of the zone. Wherever the zones cover only part of the imaged cluster area, it has been accounted far in the determination of . The assumed concentric circles and the stellar surface densities derived in this way for the clusters under discussion are shown in Figs 4 to 6 and 8 to 12. Presence of clear radius-density variation confirms the relatively small diameters (compactness) of the star clusters under study.


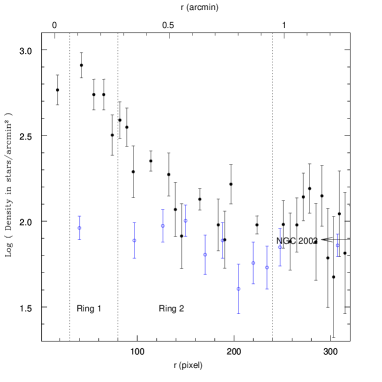


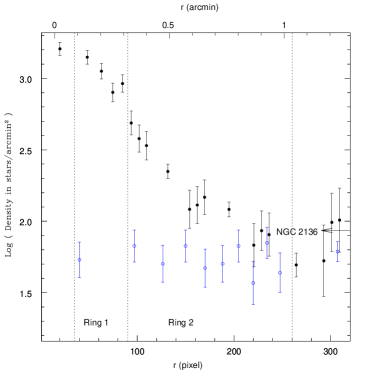


The level of field star density derived from the outer region are also shown in these figures. The field star densities up to mag are in the range of 69 to 102 star arcmin-2 with an average value of about 80 stars arcmin-2. For NGC 2002 and NGC 2136, the field stellar density is also estimated from a region lying away from cluster center. The derived mean densities are 78 and 56 stars arcmin-2 respectively. The corresponding values derived from the outermost region of the clusters () are 79 and 80 stars/arcmin2. Within our statistical uncertainty, they are similar. It can therefore be concluded that the extent of field star contamination is similar in all the clusters under discussion. We also derive the spatial variation of the field star density from the imaged field regions taking pix and pix as its center and the same are shown in Fig. 6 and Fig. 12. It is seen that the stellar density of the field region follows the background densities derived from the outermost regions of these two clusters. This indicates that stars with can be used to estimate field star contamination in the cluster. From these numbers as well as the cluster sequences present in the CM diagrams discussed below, one may say that the field star contamination in the stars brighter than mag is not strong enough to smear the cluster sequences and hence affect the results derived below.
As our data are substantially incomplete in the crowded central region of the clusters, we are unable to evaluate the value of stellar density at the cluster center. Consequently, the radius at which central stellar density becomes half can not be determined. However, the radial density profiles of all the clusters clearly indicate the innermost cluster region ( 30 pixel) where stellar crowding is so large that it cannot be used to determine the cluster MF accurately. Similarly, the outermost regions of the clusters where the stellar density becomes flat is clearly defined and we have considered this as the cluster radius. In Figs 4 to 6 and 8 to 12, one can see that for all the clusters beyond a radius , the number of stars up to 20 mag per unit area drops to a uniform level which might be considered as a good approximation of the background density. The cluster radius for the target clusters range from 120 pixels () for NGC 2006 & SL 538 to 260 pixels () for NGC 2136. Its value is about for NGC 1767 and NGC 2098 while the remaining clusters have a radius of about . In order to see radial variations of MF, the entire cluster region (excluding core) has been divided into two annulus region i.e. Ring 1 and Ring 2. The pixel values of the cluster radius, core region, Ring 1 and Ring 2 are listed in Table 5.
3.2 Color magnitude diagrams
In order to properly analyse the CMDs of our LMC clusters, it is necessary to delineate the cluster sequences from the unavoidable field star contamination. We therefore constructed CMDs of stars located at different radial distances from the cluster center. This helps us to clearly distinguish cluster features from those characterising the surrounding LMC fields. Consequently, two CMDs for each cluster, one representing the features of the clusters while other characterising the surrounding field region are constructed. Figures 4 to 6 and 8 to 12 show the CMDs of the cluster () as well as of the field () regions. For NGC 2002 and NGC 2136, we also show the CMDs of a nearby field (′) regions in Figs 7 and 13 respectively. A characteristic MS from mag to 20 mag is seen in all the clusters, except NGC 2136 where it begins at around 16 mag, indicating their youthful (age Myr) nature. In addition, the brighter end ( mag) is also populated by a few blue and red supergiants. This is in contrast to the field regions which is only sparsely populated by stars towards lower MS ( mag). Red clump of stars near mag, mag and mag in the CMDs, are populated by evolved stars arising from the old age ( 1 Gr) stellar populations of the LMC. Such a feature has also been observed in other CCD photometric studies of LMC star clusters (see Sagar et al. 1991 and references therein). These are intermediate age core helium burning stars of the LMC field forming a clump in the CMDs.
For constructing mass functions of the clusters under study, we need determination of distance, age and reddening for each object and the same are being described below.
A value of mag for the true distance modulus of the LMC is now well constrained since it is derived using more than two dozen independent measurements (see Alves 2004; Schaefer 2008 and references therein). The individual determinations, however, vary from 18.1 to 18.8 mag primarily due to different standard candles being used e.g. the Red clump, tip of red giant branch, Cepheids, RR Lyrae stars, Mira variables, SN1987A, eclipsing binaries etc. We adopt mag as distance modulus for LMC in the present study. Being everything similar, smaller distances result in lower ages and affect the derived mass ranges for MFs. A closer analysis indicates that adopting distance modulus 0.4 mag different changes the derived mass functions significantly, although its effect on MF slopes are observed to be negligible (Sagar & Richtler, 1991).
We use the stellar evolutionary models by Girardi et al. (2002) to estimate clusters ages and adopt a constant value of metallicity (Fe/H 0.3 dex). Recent estimates on the present day chemical abundance for LMC stellar population converge to a sub-solar metallicity, for example, Rolleston et al. (2002) derive a metallicity index of for OB-type main sequence stars. For many young ( Myr) LMC star clusters, the metallicity seems to have a plateau around Fe/H 0.4. (Mackey & Gilmore, 2003; Kerber et al., 2007). Effects of metallicity variation on the derived MF slope indicate that it becomes flatter with decreasing value of Z. A change in Z from 0.02 to 0.004 has a negligible effect on the MF slope, see Fig. 6 of Sagar & Richtler (1991).
Reddening towards surrounding LMC region is observed to be around mag as estimated from all sky maps at 100 (Schlegel et al., 1998). Based on HI emission map (Burstein & Heiles, 1982), the predicted towards cluster lie between 0.05 to 0.1 mag. However, the intra-galactic reddening across LMC is observed to vary and it may be as high as 0.3 mag in some regions (Bessell, 1991). We therefore adjusted the value of reddening to best fit the isochrones to the MS. Our age estimates are greatly facilitated by the presence of a few blue and red supergiants. The best estimate for age lies between two isochrones identified for each cluster and are shown in Figs. 4 to 6 and 8 to 12 and accordingly, we adopt mean age (/Myr) and uncertainty. The reddening and the adopted ages derived in this way are listed in Table 6. The values of are mag for all the clusters except for NGC 1767 and NGC 2002 where its value is 0.18 and 0.2 mag respectively. Thus the present low reddening values are in agreement with those based on HI and dust emission map of sky.
The present age estimates for NGC 2006 ( Myr) and SL 538 ( Myr) are consistent with the corresponding estimates of Myr and Myr by Dieball & Grebel (1998). Our age estimate ( Myr) for NGC 2098 is significantly younger than the estimate of 63 - 79 Myr by Kontizas et al. (1998). For all other clusters this is the first reliable estimate of age using main-sequence turn-off point in the CMDs. However, studies using integrated spectra of star clusters and single population stellar library derive about 10 Myr systematically younger ages (Wolf et al., 2007). Barring NGC 2098 and NGC 2136, their age estimates for the remaining 7 clusters of our sample lie between 6 to 8 Myr, while, our estimates range from 15 to 20 Myr. The age estimates derived from integrated spectra using theoretical models seem to be biased towards blue MS stars.
A gap in the MS is defined as a band, not necessarily perpendicular to the MS, with no or very few stars. Böhm-Vitense & Canterna (1974) first located a gap in MS around mag which arise due to onset of convection in the stellar envelope. Gaps seem to appear as statistically distinct features in MS of star clusters (Sagar & Joshi, 1978; Kjeldsen & Frandsen, 1991; Subramaniam & Sagar, 1999). MS Gaps in the present sample were identified visually and the gap parameters are listed in Table 6. Except NGC 2136, all the target clusters have about 0.3 to 0.5 mag wide gap between to mag. This seems to be characteristic feature of stellar evolution as the brighter gap location corresponds to the younger clusters. Stellar evolution models do predict paucity of stars around and beyond the MS turn off. However, some clusters seem to have clumpy MS with more than one gaps, for example, NGC 2003 and NGC 2011 show gaps of smaller amplitude ( mag) at fainter magnitudes. Both these clusters have elongated spatial structures and may have star forming history different from the other clusters. It is therefore noted that the gaps may also arise due to stochastic effects of star formation and sampling along the main sequence and it may not represent any genuine astrophysical effects.
3.3 Cluster luminosity and mass functions
The Luminosity functions (LFs) of LMC star clusters and their corresponding field region is derived from star counts in bin width of 0.5 mag in from the , diagrams. It has been preferred over other CMDs due to fainter limiting magnitude and better data completeness. The main factors which limit the precise determinations of cluster MF from present observations are data incompleteness and field star contamination as the central region of the clusters are more likely to suffer from data incompleteness while the outer region is more affected by field star contamination. Moreover, the present photometry is generally not able to resolve the central 30 pixel diameter region of each cluster. We therefore, estimate the LFs for the inner (Ring 1), outer (Ring 2), and entire regions of each cluster excluding the core. These regions are marked in the radial density profile of the respective clusters (see Sect 3.1) and also listed in Table 5.
For data completeness factor (CF), we follow the usual DAOPHOT procedure of adding and recovering the artificially selected stars with known magnitudes and positions in the original and frame and the effective CF is taken to be smaller value of them. We estimate CF separately for inner, outer, and entire regions as well as the corresponding field regions which is usually defined as (see Table 5). In the case of NGC 2002 and NGC 2136, the field region refers to full CCD frames of a nearby field. For each region, the number of stars (NS) lying on the main sequence in the diagram are counted in a bin width of 0.5 mag. In order to avoid field star contamination from intermediate age stellar populations of the LMC, which normally appear as the characteristic red clump near mag and mag, the stars are counted in a 0.5 mag strip around the best fitting isochrones. The LF for each bin is calculated as :
We present the derived LFs for all the clusters in Table LABEL:tab:lumf. Column 1 provides the magnitude bin and the columns 3 to 10 provides CF and NS values for the inner, outer, entire and field regions respectively. The LFs corrected for the data incompleteness and the field star contamination (corrected for area difference between cluster and field region) are given in the last three columns while the masses corresponding to the center of mag bin derived from the best fitting isochrones (see Sec. 3.2) are given in the 2nd column of Table LABEL:tab:lumf. For the outer region of NGC 2098, the MF could not be derived due to poor statistics.
| Cluster | E(B-V) | Age | MS gap parameters | MF slopes | ||||
|---|---|---|---|---|---|---|---|---|
| (mag) | (Myr) | Ring 1 | Ring 2 | Total | ||||
| NGC 1767 | 0.18 | |||||||
| NGC 1994 | 0.10 | |||||||
| NGC 2002 | 0.20 | |||||||
| NGC 2003 | 0.10 | |||||||
| NGC 2006 | 0.06 | |||||||
| SL 538 | 0.06 | |||||||
| NGC 2011 | 0.08 | |||||||
| NGC 2098 | 0.08 | – | ||||||
| NGC 2136 | 0.10 | - | - | - | ||||

4 Results and discussions
To convert the LFs into mass functions (MFs), we divide the number given in Table LABEL:tab:lumf by the mass interval, , of the magnitude bin under consideration. The value of is obtained from the mass luminosity relation derived from the appropriate isochrones. The resulting cluster MFs are plotted in Fig. 14 and the slopes are given in Table 6. The quoted uncertainties result from the linear regression solution. The slope is derived from the mass distribution function which is assumed to be a power law with index . If dN denotes the number of stars in a bin with central mass , then the value of is determined from the linear relation :
is also denoted as in the literature with , or being Salpeter (1955) value.
For NGC 2002, NGC 2006, NGC 2011 and NGC 2136, the MF slopes for inner (Ring 1) and outer (Ring 2) cluster regions differ by about one dex and is shallower for the inner cluster region. In case of NGC 2098 too, the MF slope for the entire region is steeper than the inner region. However, due to poor statistics the MF slope for the outer region could not be derived. Kontizas et al. (1998) found similar trend for SL 566 and NGC 2098, i.e. shallower LF slopes in the inner regions of the clusters. This could be interpreted as mass segregation (high concentration of heavier stars in the central region) and it may arise due to star formation or dynamical evolution processes. As the ages of the clusters under discussion are less than the dynamical relaxation time, the observed variation may be an imprint of star formation. However, we note that the combined effect of scatter in MF slope may be as large as one dex and hence, we suggest HST observations to resolve the stars of the cluster core region and to confirm the radial variation of MF slope. For further discussion, we consider only the MF slope derived for the total cluster region.
The mass range for the sample clusters are similar and vary from to except for NGC 2136 where it is only to . As the ages of all the clusters are less than the dynamical evolution times ( Myrs), the slope of the present day MFs can be considered as slope of IMFs. Furthermore, we also assume that all the stars in the cluster are formed in a single star-forming bursts and hence barring most evolved stars, the derived MFs could be least affected by the star formation history of the clusters. Excluding NGC 1767, we get a mean MF slope of for 8 target clusters. This value is not too different from the Salpeter value derived for solar neighbourhood stars and for other young galactic and M33 star clusters in the intermediate mass range (cf. Sagar 2000, 2002; Chen et al. 2007). The mass function slope for NGC 1767 was found to be significantly flatter () than the Salpeter value.
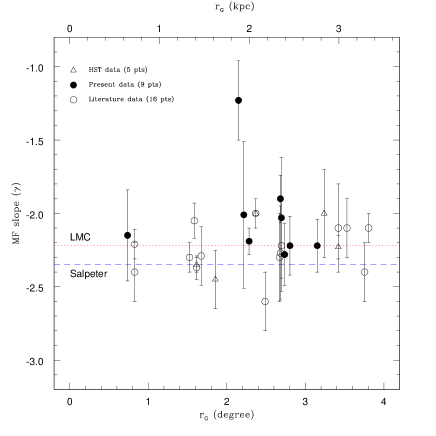
Our MF slopes for NGC 2006 and for SL 538 are consistent with the corresponding values of and derived by Dieball & Grebel (1998). Fig. 15, shows the variation of MF slopes with galactocentric distance for 26 young ( Myr) star clusters and associations in the LMC. This includes 9 clusters from the present work, while the data for other objects are taken from the Table 1 of Sagar (2000). For four clusters, we have two estimates for the MF slope and these points are also shown in Fig.15. Regarding NGC 1767 as an outlier, remaining sample of 25 has a mean MF slope indicating that the MF slope in LMC clusters are not significantly different from the Salpeter (1955) value. The scatter seen in Fig. 15 in MF slope is introduced by many factors, for example, data incompleteness and field star contamination, dynamical and stellar evolutionary state of star clusters, limited range in mass and assumed model to derive mass-luminosity relation and Poisson noise etc. (Kroupa, 2001; Sagar & Richtler, 1991; Sagar, 2002). The detailed analysis indicate that the cumulative effect of the various uncertainties could be as large as 0.4 dex for young rich LMC star clusters (Sagar, 2002). We therefore conclude that the scatter seen in Fig. 15 is real and it does indicate the limitations of MF slope determinations from the ground based observations. Despite being situated in different locations of LMC the studied sample of young clusters and associations supports the idea of some universal IMF as a consequence of star formation processes in star clusters and associations.
5 Summary
We present CCD data obtained from 3.5-meter ESO NTT/EFOSC2 observations for 9 young Large Magellanic Cloud star clusters namely NGC 1767, NGC 1994, NGC 2002, NGC 2003, NGC 2006, SL 538, NGC 2011, NGC 2098 and NGC 2136 and their nearby field regions reaching down to mag for 6400 stars altogether. They are the first accurate broad band CCD photometric data for all the clusters except for the binary cluster NGC 2006 and SL 538. The observations are made in a region of around the cluster center. The data were collected during Jan 10 to Jan 13, 1990 in good seeing conditions ranging from 07 to 10 and reduced using DAOPHOT and MIDAS softwares. Photometric calibrations are done using Landolt (1992) stars and the zero point accuracy is better than mag. Photometric errors become large (≳0.1 mag) for stars fainter than mag.
We examine radial density profiles, general features of the main sequence and estimate age and reddening for individual clusters using Padova isochrones. The various CMDs of the clusters under study were used to estimate their MF, age and reddening. In order to study radial variation in MF, the LFs are derived for inner, outer, and entire cluster regions. Due to compactness of the clusters, such study could not be carried out for the core regions of the clusters. The LFs are corrected for both data incompleteness and field contamination. The main conclusions of the present study are as follows.
-
1.
Seven of the nine clusters have ages Myr, while the remaining two clusters have ages of Myr (NGC 2098) and Myr (NGC 2136). Our age estimates for NGC 2006 and SL 538 were found to be consistent with the previous photometric estimate by Dieball & Grebel (1998). For NGC 2098, our estimates are lower by about 30 Myr than Kontizas et al. (1998). Thus, the ages of all the clusters in our sample are significantly lower than their typical dynamical ages of a few 100 Myrs.
-
2.
For younger ( 25 Myr) clusters, the age estimates based on a recent population synthesis models by Wolf et al. (2007) and integrated spectra are systematically lower by about 10 Myr than the present age estimates based on CMDs.
-
3.
Assuming an LMC distance modulus of 18.5 mag, the derived reddening for the clusters in our sample was found to be consistent with that derived from HI emission and 100 all sky dust maps.
-
4.
In the mass range of , the MF slopes for 8 out of 9 sample clusters were found to be similar with values of ranging from to . For NGC 1767 the slope was found to be significantly shallower with . The present MF values are consistent with those derived by Dieball & Grebel (1998) for NGC 2006 and SL 538. Selman & Melnick (2005) studied the star formation history and IMF of the field population of 30 Doradus super association and found that it has a Salpeter slope in the mass range of 7 to 40 .
-
5.
Mass function slopes of the inner and outer cluster regions indicates the presence of mass segregations in NGC 2002, NGC 2006, NGC 2136 and NGC 2098. For NGC 2098, Kontizas et al. (1998) derive the dynamical relaxation time, between 640 to 1050 Myr. This may indicate that the value of for LMC star clusters could be few hundreds of Myr. The ages of LMC star clusters under study are therefore significantly smaller than their dynamical relaxation time. Consequently, observed mass segregation in these clusters is probably primordial in nature. A compilation of both ground and space based observations of extremely young galactic and MC star clusters (cf. Hunter et al. 1995; Sagar et al. 1988; Hillenbrand & Hartmann 1998; Chen et al. 2007 and references therein) indicates presence of mass segregation in most of them, although to varying degrees. All these indicate that in most of the young star clusters located in different galaxies, mass segregation effects are observed and most likely they are imprint of star formation processes.
-
6.
A mean MF slope of derived for a sample of 25 young ( Myr) stellar systems in LMC provide support for the universality of IMF in the intermediate mass range . An IMF study of the 30 Doradus star forming region of LMC by Selman & Melnick (2005) also support this conclusion.
acknowledgments
Authors are thankful to the anonymous referee for constructive comments. Useful discussions with Drs. K.S. de Boer, P. Kroupa and T. Richtler are gratefully acknowledged. We thank Dr. Vijay Mohan for help in data reduction. One of us (RS) would like to thank the Alexander von Humboldt Foundation, Bonn for providing financial support to work at the Sterwarte/Argelander Institute of Astronomy in Bonn. BK acknowledge support from the Chilean center for Astrophysics FONDAP No. 15010003.
References
- Alves (2004) Alves, D. R., 2004, New A Rev., 48, 659
- Burstein & Heiles (1982) Burstein, D., Heiles, C., 1982, AJ, 87, 1165
- Bessell (1991) Bessell, M. S., 1991, A&A, 242, L17
- Bhatia (1992) Bhatia, R. K., 1992, Mem. Soc. Astron. Ital., 63, 141
- Bica & Schmitt (1995) Bica, E., & Schmitt, H. R., 1995, ApJS, 101, 41
- Bica et al. (1996) Bica, E., Clariá J. J., Dottori H., et al. 1996, ApJS, 102, 57
- Bica et al. (1999) Bica E., Schmitt H. R., Dutra C. M., et al. 1999, ApJ, 117, 238
- Böhm-Vitense & Canterna (1974) Böhm-Vitense, E., & Canterna, R., 1974, ApJ, 194, 629
- Brocato et al. (2001) Brocato E., Di Carlo E., & Menna G., 2001, A&A, 374, 523
- Chen et al. (2007) Chen L., De Grijs R., & Zhao J.L., 2007, AJ, 134, 1368
- Dieball & Grebel (1998) Dieball A., & Grebel E. K., 1998, A&A, 339, 773
- Dieball et al. (2002) Dieball A., Mueller H., & Grebel E. K., 2002, A&A, 391, 547
- Dirsch et al. (2000) Dirsch B., Richtler T., Gieren W. P., et al. 2000, A&A, 360, 133
- Elmegreen (2000) Elmegreen B. G., 2000, ApJ, 539, 342
- Elson & Fall (1985) Elson R. A. W., & Fall S. M., 1985, ApJ, 299, 211
- Girardi et al. (2002) Girardi, L., Bertelli, G., Bressan, A., et al. 2002, A&A, 391, 195
- Gouliermis et al. (2006) Gouliermis, D. A., Lianou, S., Kontizas, M., et al. 2006, ApJ, 652, L93
- Hilker et al. (1995) Hilker M., Richtler T., Stein D., 1995, A&A, 299, L37
- Hillenbrand & Hartmann (1998) Hillenbrand, L.A., & Hartmann, L.E., 1998, ApJ, 492, 540
- Hunter et al. (1995) Hunter, D. A., Shaya, E. J., Holtzmann, J. A., et al., 1995, ApJ, 448, 179
- Kjeldsen & Frandsen (1991) Kjeldsen, K., & Frandsen S., 1991, A&AS, 87, 119
- Kerber et al. (2007) Kerber, L. O., Santiago, B. X., & Brocato, E., 2007, A&A, 462, 139
- Kontizas et al. (1998) Kontizas M., Hatzidimitriou D., Bellas-Velidis I., et al. 1998, A&A, 336, 503
- Kroupa (2001) Kroupa P., 2001, MNRAS, 322, 221
- Kumar et al. (2004) Kumar, B., Sagar, R., Sanwal, B. B. & Bessell, M., 2004, MNRAS, 353, 991
- Landolt (1992) Landolt A. U., 1992, AJ, 104, 340.
- Larson (1998) Larson R. B., 1998, MNRAS, 301, 569
- Mackey & Gilmore (2003) Mackey, A. D., Gilmore, G. F., 2003, MNRAS, 338, 85
- Matteucci et al. (2002) Matteucci A., Ripepi V., Brocato E., et al. 2002, A&A, 387, 861
- Rolleston et al. (2002) Rolleston, W. R. J., Trundle, C., & Dufton, P. L., 2002, A&A, 396, 53
- Sagar (1987) Sagar R., 1987, MNRAS, 228, 483
- Sagar (1993) Sagar R., 1993, Current Science, 64, 293
- Sagar (1995) Sagar R., 1995, Bull. Astron. Soc. India, 23, 433
- Sagar (2000) Sagar R., 2000, Bull. Astron. Soc. India, 28, 55
- Sagar (2002) Sagar R., 2002, IAU Symp. 207, 515
- Sagar & Joshi (1978) Sagar R., & Joshi U.C., 1978, Bull. Astron. Soc. India, 6, 37
- Sagar et al. (1988) Sagar R., Myakutin, V.I., Piskunov, A.E., Dluzhnevskaya, O. B., 1988, MNRAS, 234, 831
- Sagar & Richtler (1991) Sagar R., Richtler T., 1991, A&A, 250, 324
- Sagar et al. (1991) Sagar R., Richtler T., de Boer K. S., 1991, A&AS, 90, 387
- Salpeter (1955) Salpeter E. E., 1955, ApJ, 121, 161
- Schaefer (2008) Schaefer, B. E., 2008, AJ, 135, 112
- Schlegel et al. (1998) Schlegel, D. J., Finkbeiner, D. P., & Davis, M., 1998, ApJ, 500, 525
- Searle et al. (1980) Searle, L., Wilkinson, A., & Bagnuolo, W. G., 1980, ApJ, 239, 803
- Selman & Melnick (2005) Selman, F.J. & Melnick, J., 2005, A&A, 443, 851
- Shapley & Lindsay (1963) Shapley H., & Lindsay E. M., Ir. Astron. J., 1963, 6, 74
- Stetson (1987) Stetson B., 1987, PASP, 99, 191.
- Stetson (1992) Stetson, P. B., 1992, JRASC, 86, 71
- Subramaniam & Sagar (1999) Subramaniam, A. & Sagar, R., 1999, AJ, 117, 937
- Sulentic et al. (1973) Sulentic J. W., & Tifft W. G., 1973, Revised New General Catalogue of Nonstellar Astronomical Objects, Univ. of Arizona Press, USA
- Wolf et al. (2007) Wolf, M. J., Drory, N., Gebhardt, K., et al. 2007, ApJ, 655, 179
- Yadav & Sagar (2001) Yadav R. K. S., Sagar R., 2001, MNRAS, 328, 370
| Bin | Bin | Ring 1 | Ring 2 | Total | Field Region | Ring 1 | Ring 2 | Total | ||||
|---|---|---|---|---|---|---|---|---|---|---|---|---|
| (V mag) | () | CF | NS | CF | NS | CF | NS | CF | NS | LF | LF | LF |
| (1) | (2) | (3) | (4) | (5) | (6) | (7) | (8) | (9) | (10) | (11) | (12) | (13) |
| NGC 1767 | ||||||||||||
| 15.25 | 10.83 | 1.00 | 2 | 1.00 | 1 | 1.00 | 3 | 1.00 | 0 | 2.00 | 1.00 | 3.00 |
| 15.75 | 10.19 | 1.00 | 5 | 1.00 | 2 | 1.00 | 7 | 1.00 | 1 | 4.80 | 1.42 | 6.22 |
| 16.25 | 9.45 | 1.00 | 4 | 1.00 | 2 | 1.00 | 6 | 1.00 | 2 | 3.60 | 0.84 | 4.44 |
| 16.75 | 8.56 | 1.00 | 10 | 1.00 | 5 | 1.00 | 15 | 1.00 | 1 | 9.80 | 4.42 | 14.22 |
| 17.25 | 7.57 | 1.00 | 9 | 1.00 | 3 | 1.00 | 12 | 1.00 | 3 | 8.40 | 1.26 | 9.66 |
| 17.75 | 6.52 | 1.00 | 9 | 1.00 | 6 | 1.00 | 15 | 1.00 | 4 | 8.21 | 3.68 | 11.88 |
| 18.25 | 5.50 | 0.99 | 22 | 1.00 | 6 | 0.98 | 28 | 1.00 | 4 | 21.43 | 3.68 | 25.45 |
| 18.75 | 4.56 | 0.97 | 16 | 1.00 | 13 | 0.96 | 29 | 0.99 | 20 | 12.48 | 1.26 | 14.46 |
| 19.25 | 3.74 | 0.94 | 19 | 0.99 | 19 | 0.94 | 38 | 0.97 | 25 | 15.10 | 4.21 | 20.33 |
| 19.75 | 3.06 | 0.89 | 8 | 0.90 | 24 | 0.88 | 32 | 0.88 | 23 | - | 11.48 | 15.99 |
| NGC 1994 | ||||||||||||
| 15.25 | 12.09 | 1.00 | 2 | 1.00 | 2 | 1.00 | 4 | 1.00 | 0 | 2.00 | 2.00 | 4.00 |
| 15.75 | 11.08 | 1.00 | 4 | 1.00 | 8 | 1.00 | 12 | 1.00 | 1 | 3.79 | 6.02 | 9.81 |
| 16.25 | 9.90 | 1.00 | 2 | 1.00 | 12 | 1.00 | 14 | 1.00 | 1 | 1.79 | 10.02 | 11.81 |
| 16.75 | 8.64 | 1.00 | 2 | 1.00 | 12 | 1.00 | 14 | 1.00 | 3 | 1.36 | 6.06 | 7.42 |
| 17.25 | 7.40 | 1.00 | 7 | 1.00 | 17 | 1.00 | 24 | 1.00 | 8 | 5.30 | 1.15 | 6.45 |
| 17.75 | 6.22 | 1.00 | 9 | 1.00 | 12 | 1.00 | 21 | 1.00 | 2 | 8.57 | 8.04 | 16.61 |
| 18.25 | 5.15 | 1.00 | 14 | 1.00 | 38 | 1.00 | 52 | 1.00 | 11 | 11.66 | 16.21 | 27.87 |
| 18.75 | 4.21 | 0.99 | 25 | 0.99 | 42 | 0.98 | 67 | 0.99 | 14 | 22.24 | 14.41 | 37.34 |
| 19.25 | 3.42 | 0.96 | 35 | 0.97 | 67 | 0.96 | 102 | 0.96 | 18 | 32.47 | 31.92 | 65.11 |
| 19.75 | 2.79 | 0.82 | 29 | 0.90 | 91 | 0.86 | 120 | 0.92 | 34 | 27.50 | 27.89 | 58.45 |
| NGC 2002 | ||||||||||||
| 15.25 | 11.99 | 1.00 | 4 | 1.00 | 6 | 1.00 | 10 | 1.00 | 5 | 3.67 | 2.88 | 6.55 |
| 15.75 | 11.24 | 1.00 | 8 | 0.96 | 6 | 1.00 | 14 | 1.00 | 3 | 7.80 | 4.38 | 11.93 |
| 16.25 | 10.29 | 1.00 | 4 | 1.00 | 13 | 1.00 | 17 | 1.00 | 7 | 3.53 | 8.64 | 12.17 |
| 16.75 | 9.19 | 0.99 | 3 | 1.00 | 16 | 0.99 | 19 | 1.00 | 15 | 2.03 | 6.65 | 8.84 |
| 17.25 | 8.02 | 0.96 | 14 | 0.98 | 15 | 0.98 | 29 | 0.96 | 13 | 13.68 | 6.87 | 20.24 |
| 17.75 | 6.85 | 0.90 | 11 | 0.88 | 23 | 0.88 | 34 | 0.94 | 11 | 11.44 | 18.84 | 30.56 |
| 18.25 | 5.75 | 0.80 | 16 | 0.82 | 31 | 0.80 | 47 | 0.88 | 19 | 18.55 | 24.35 | 43.85 |
| 18.75 | 4.74 | 0.58 | 17 | 0.62 | 40 | 0.62 | 57 | 0.82 | 36 | 26.37 | 37.15 | 61.63 |
| 19.25 | 3.87 | 0.45 | 11 | 0.56 | 65 | 0.54 | 76 | 0.76 | 67 | 18.54 | 61.12 | 79.89 |
| 19.75 | 3.16 | 0.40 | 13 | 0.46 | 63 | 0.45 | 76 | 0.62 | 64 | 25.59 | 72.62 | 97.64 |
| NGC 2003 | ||||||||||||
| 15.25 | 10.06 | 1.00 | 2 | 1.00 | 3 | 1.00 | 5 | 1.00 | 0 | 2.00 | 3.00 | 5.00 |
| 15.75 | 9.43 | 1.00 | 3 | 1.00 | 4 | 1.00 | 7 | 1.00 | 0 | 3.00 | 4.00 | 7.00 |
| 16.25 | 8.73 | 1.00 | 2 | 1.00 | 5 | 1.00 | 7 | 1.00 | 2 | 1.76 | 2.38 | 4.14 |
| 16.75 | 7.88 | 1.00 | 6 | 1.00 | 9 | 1.00 | 15 | 1.00 | 1 | 5.88 | 7.69 | 13.57 |
| 17.25 | 6.93 | 1.00 | 12 | 1.00 | 14 | 1.00 | 26 | 1.00 | 1 | 11.88 | 12.69 | 24.57 |
| 17.75 | 5.94 | 1.00 | 14 | 1.00 | 9 | 1.00 | 23 | 1.00 | 1 | 13.88 | 7.69 | 21.57 |
| 18.25 | 4.99 | 1.00 | 20 | 1.00 | 28 | 1.00 | 48 | 1.00 | 1 | 19.88 | 26.69 | 46.57 |
| 18.75 | 4.12 | 0.99 | 28 | 1.00 | 34 | 1.00 | 62 | 1.00 | 8 | 27.33 | 23.53 | 50.58 |
| 19.25 | 3.37 | 0.96 | 26 | 1.00 | 43 | 0.99 | 69 | 0.99 | 11 | 25.77 | 28.45 | 53.83 |
| 19.75 | 2.76 | 0.86 | 30 | 0.98 | 68 | 0.96 | 98 | 0.98 | 19 | 32.59 | 44.01 | 74.40 |
| 20.25 | 2.27 | 0.78 | 20 | 0.90 | 91 | 0.86 | 111 | 0.96 | 30 | - | 60.20 | 84.46 |
| NGC 2006 | ||||||||||||
| 15.25 | 9.88 | 0.99 | 3 | 0.99 | 3 | 0.99 | 6 | 1.00 | 2 | 2.91 | 2.66 | 5.57 |
| 15.75 | 9.27 | 0.94 | 5 | 0.96 | 1 | 0.95 | 6 | 1.00 | 3 | 5.14 | 0.48 | 5.58 |
| 16.25 | 8.52 | 0.91 | 7 | 0.92 | 2 | 0.92 | 9 | 1.00 | 6 | 7.33 | 1.06 | 8.30 |
| 16.75 | 7.65 | 0.88 | 8 | 0.91 | 5 | 0.90 | 13 | 0.99 | 4 | 8.85 | 4.74 | 13.45 |
| 17.25 | 6.68 | 0.85 | 13 | 0.88 | 4 | 0.84 | 17 | 0.99 | 14 | 14.44 | 1.91 | 16.75 |
| 17.75 | 5.70 | 0.80 | 8 | 0.83 | 8 | 0.82 | 16 | 0.98 | 7 | 9.57 | 8.31 | 17.75 |
| 18.25 | 4.76 | 0.73 | 16 | 0.80 | 17 | 0.76 | 33 | 0.96 | 26 | 20.28 | 16.20 | 36.74 |
| 18.75 | 3.92 | 0.68 | 10 | 0.78 | 11 | 0.73 | 21 | 0.92 | 26 | 13.00 | 8.84 | 21.79 |
| 19.25 | 3.21 | 0.61 | 12 | 0.70 | 23 | 0.66 | 35 | 0.88 | 39 | 17.00 | 24.60 | 42.09 |
| 19.75 | 2.64 | 0.45 | 10 | 0.64 | 20 | 0.54 | 30 | 0.82 | 44 | 18.98 | 21.25 | 42.31 |
| SL 538 | ||||||||||||
| 15.25 | 10.86 | 1.00 | 1 | 1.00 | 2 | 1.00 | 3 | 1.00 | 2 | 0.89 | 1.71 | 2.61 |
| 15.75 | 10.06 | 0.99 | 1 | 1.00 | 4 | 1.00 | 5 | 1.00 | 3 | 0.85 | 3.57 | 4.41 |
| 16.25 | 9.08 | 0.98 | 2 | 0.99 | 2 | 1.00 | 4 | 1.00 | 6 | 1.72 | 1.16 | 2.82 |
| 16.75 | 8.01 | 0.97 | 6 | 0.98 | 10 | 0.99 | 16 | 0.99 | 4 | 5.97 | 9.62 | 15.36 |
| 17.25 | 6.90 | 0.96 | 5 | 0.96 | 3 | 0.95 | 8 | 0.99 | 14 | 4.44 | 1.10 | 5.63 |
| 17.75 | 5.83 | 0.94 | 9 | 0.94 | 10 | 0.94 | 19 | 0.98 | 7 | 9.19 | 9.61 | 18.80 |
| 18.25 | 4.84 | 0.91 | 8 | 0.90 | 12 | 0.90 | 20 | 0.96 | 26 | 7.33 | 9.45 | 16.87 |
| 18.75 | 3.96 | 0.88 | 10 | 0.86 | 11 | 0.87 | 21 | 0.92 | 26 | 9.84 | 8.74 | 18.56 |
| 19.25 | 3.23 | 0.82 | 12 | 0.78 | 16 | 0.74 | 28 | 0.88 | 39 | 12.24 | 14.15 | 29.09 |
| NGC 2011 | ||||||||||||
| 15.75 | 10.16 | 1.00 | 5 | 1.00 | 9 | 1.00 | 14 | 1.00 | 2 | 4.72 | - | 11.18 |
| 16.25 | 9.20 | 1.00 | 5 | 1.00 | 5 | 1.00 | 10 | 1.00 | 2 | 4.72 | - | 7.18 |
| 16.75 | 8.14 | 1.00 | 3 | 1.00 | 5 | 1.00 | 8 | 1.00 | 4 | 2.44 | - | 2.37 |
| 17.25 | 7.04 | 0.99 | 6 | 1.00 | 10 | 1.00 | 16 | 1.00 | 5 | 5.36 | 3.66 | 8.96 |
| 17.75 | 5.96 | 0.98 | 2 | 1.00 | 12 | 1.00 | 14 | 1.00 | 4 | 1.48 | 6.93 | 8.37 |
| 18.25 | 4.95 | 0.96 | 10 | 0.99 | 20 | 0.99 | 30 | 1.00 | 6 | 9.58 | 12.60 | 21.86 |
| 18.75 | 4.06 | 0.95 | 10 | 0.98 | 30 | 0.98 | 40 | 0.99 | 9 | 9.25 | 19.09 | 28.02 |
| 19.25 | 3.31 | 0.90 | 19 | 0.95 | 39 | 0.95 | 58 | 0.98 | 14 | 19.11 | 22.94 | 40.94 |
| 19.75 | 2.71 | 0.87 | 18 | 0.91 | 54 | 0.93 | 72 | 0.96 | 33 | 15.88 | 15.77 | 29.03 |
| NGC 2098 | ||||||||||||
| 15.75 | 8.56 | 1.00 | 6 | 1.00 | 1 | 1.00 | 7 | 1.00 | 7 | 5.29 | - | 3.91 |
| 16.25 | 8.03 | 1.00 | 5 | 1.00 | 2 | 1.00 | 7 | 1.00 | 8 | 4.18 | - | 3.47 |
| 16.75 | 7.35 | 1.00 | 7 | 1.00 | 6 | 1.00 | 13 | 1.00 | 16 | 5.37 | - | 5.93 |
| 17.25 | 6.53 | 1.00 | 10 | 1.00 | 5 | 1.00 | 15 | 1.00 | 18 | 8.16 | - | 7.05 |
| 17.75 | 5.65 | 1.00 | 14 | 1.00 | 10 | 1.00 | 24 | 1.00 | 30 | 10.94 | - | 10.75 |
| 18.25 | 4.78 | 0.99 | 24 | 0.99 | 8 | 0.99 | 32 | 1.00 | 36 | 20.57 | - | 16.42 |
| 18.75 | 3.96 | 0.98 | 21 | 0.98 | 10 | 0.98 | 31 | 1.00 | 35 | 17.85 | - | 16.17 |
| 19.25 | 3.26 | 0.96 | 28 | 0.97 | 23 | 0.97 | 51 | 1.00 | 54 | 23.65 | - | 28.73 |
| 19.75 | 2.68 | 0.83 | 26 | 0.94 | 28 | 0.93 | 54 | 0.99 | 59 | 25.24 | - | 31.74 |
| 20.25 | 2.21 | 0.74 | 22 | 0.88 | 43 | 0.88 | 65 | 0.96 | 66 | 22.71 | - | 43.50 |
| NGC 2136 | ||||||||||||
| 16.75 | 5.29 | 1.00 | 12 | 1.00 | 4 | 1.00 | 16 | 1.00 | 0 | 12.00 | 4.00 | 16.00 |
| 17.25 | 5.02 | 1.00 | 14 | 1.00 | 18 | 1.00 | 32 | 1.00 | 3 | 13.75 | 16.19 | 29.94 |
| 17.75 | 4.65 | 1.00 | 33 | 1.00 | 20 | 1.00 | 53 | 1.00 | 3 | 32.75 | 18.19 | 50.94 |
| 18.25 | 4.19 | 0.99 | 49 | 1.00 | 41 | 1.00 | 90 | 1.00 | 2 | 49.33 | 39.79 | 88.63 |
| 18.75 | 3.65 | 0.96 | 65 | 0.99 | 55 | 0.98 | 120 | 1.00 | 6 | 67.21 | 51.94 | 118.33 |
| 19.25 | 3.12 | 0.94 | 70 | 0.97 | 74 | 0.97 | 144 | 0.98 | 8 | 73.78 | 71.37 | 142.85 |
| 19.75 | 2.63 | 0.86 | 59 | 0.96 | 111 | 0.94 | 170 | 0.97 | 21 | 66.79 | 102.58 | 165.99 |