Higgs self coupling measurement
Abstract
A measurement of the Higgs self coupling from e+e- collisions in the International Linear Collider is presented. The impact of the detector performance in terms of -tagging and particle flow is investigated.
1 Introduction
The trilinear Higgs self coupling, , is extracted from the measurement of the cross-section, , of the Higgs-strahlung process [2]. This study is performed in the standard model framework assuming at . At this centre-of-mass energy the W fusion process ( in t-channel) is negligible. It has been therefore established that . All the results are given for a luminosity of .
2 Monte Carlo simulation
The signal and background event samples have been generated with Whizard[3]. PYTHIA[4] has been used to perform the hadronisation of the primary partons. Table 1 summarizes the cross-section of the simulated processes. At GeV the dominant background processes involve top quarks. They are simulated, as well as final states with two and three bosons. 305 hhZ events are expected for an estimated background three orders of magnitude above.
The detector is simulated through a parametric Monte Carlo, [5] in which the subdetectors are characterized by their acceptance angles, resolutions and energy thresholds. The intrinsic energy resolutions, , of the electromagnetic (ECAL) and hadronic (HCAL) calorimeters are respectively of 10.2% and 40.5%.
The -tagging efficiency and -jet contamination are parametrized according to the full reconstruction [6]. In this study, a -tagging efficiency, , of has been chosen, value which is not necessarily the best working point (cf. section 4.2)
| Final state | hhZ | hZ | hZZ | ZZ | ZZZ | |||
|---|---|---|---|---|---|---|---|---|
| (fb) | 0.1528 | 14.1 | 0.5 | 45.12 | 1.05 | 35.3 | 0.287 | 10.09 |
| Nb. events | 20k | 110k | 10k | 110k | 20k | 130k | 10k | 60k |
| Final state | , | Z | h | |||||
| (fb) | 526.4 | 16.8 | 0.70 | 0.6975 | 0.175 | 0.141 | 1.083 | 3.627 |
| Nb. events | 1M | 240k | 20k | 20k | 20k | 20k | 20k | 30k |
For each event the boson masses are reconstructed according to a final state hypothesis. The -content of the event is obtained from an estimation of the number of the -like jets in the event.
3 Event Selection and cross section measurement
The hhZ final state is sorted into three channels that correspond to the three Z decay modes , and . In order to define the three samples representing these three channels, a preselection is applied on the signal and the background events, based on the following criteria:
-
•
Global content : only events with a minimal -content are selected. The criteria value used to select hh events (six jets topology) is different from the one used to select hh or hh events (four jets topology),
-
•
the visible energy is used to define two exclusive samples which correspond to hh events (visible energy below ) and hh + events (visible energy higher then ),
-
•
the identification of two isolated leptons compatible with a Z boson mass allows to separate hh from hh events.
Two variables are used to select the hhZ final state : a Neural Network (NN) [7] and the global event -tag. Three kinds of inputs are used to feed the NN:
-
•
event shape variables as, for instance, charged multiplicity, sphericity or thrust values,
-
•
combinations of the different di-jet masses assuming a given final state,
-
•
global -flavor content of the event.
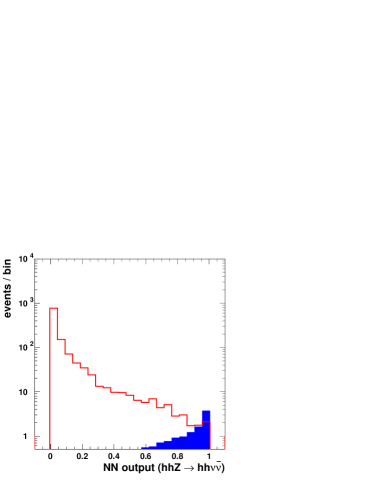
A Neural Network is designed for each of the hh, hh and hh final states. The neural networks are trained on large preselected samples of simulated events including all expected processes listed in Section 2. The output of the neural network for the hh selection is displayed on Figure 1.
For each channel, the cuts on NN and global -tag are defined in order to maximize the figure of merit . The combination of the three selections leads to 128 events expected from the background processes considered and 72 events from hhZ process corresponding to a value of 5.2.
In order to extract the cross section of the hhZ creation process, a Likelihood maximization method is used. It is based on the two dimensional NN -tag distribution. The expected precision on the cross-section measurement is 16%. Therefore, the expected precision on is 28%. This result is obtained for a particle flow resolution of and a -tag of 90%. A better working point for the -tag efficiency may be found, as it will be shown in next section.
4 Scan of the detector performance parameters
Two parameters have been investigated : the particle flow resolution and the -tagging . The full analysis described in section 3 has been performed and optimized for each hypothesis on the detector performance. The selection has been performed with different Neural Networks which combine the same input variables with adapted weights and re-optimized cuts.

4.1 Particle flow impact on the measurement
The particle flow uncertainty influences the jet pairing (based on di-jet masses) and propagates to the energies and momenta of the reconstructed bosons and then to the selection inputs. Then different efficiencies of the event selection are observed.
A fast simulation is used in order to determine the impact of the particle flow resolution on .
For each event, the stable and visible particles (i.e. all stable except neutrinos) are considered with their generated energies and momenta with no detector simulation. They are clusterized in jets. A jet by jet smearing of the calorimeter cluster energies is then applied in order to simulate the combined effect of the detector resolution and the particle flow algorithms.
This study investigates the direct impact of the calorimetric resolution and the particle flow algorithms on the precision independently of its impact on the jet clusterisation. A resolution range from to has been covered.
4.2 Event simulation with various -tag efficiencies
The measurement performance depends also on the -tag. For each jet as defined in section 4.1 consisting on -fragmentation products, a -tag is statistically defined assuming a given efficiency . For a given vertex detector (VDET) and a given jet energy, the values of is associated to a flavored contamination (quantified by ), namely the rate of -jets identified as -jets. Similary a rate of -jets identified as -jets is associated to and it has also been taken into account. was varied in the range to .
4.3 Results
The dependence of the precision on the measurement of , with respect to the particle flow uncertainty is displayed on Figure 2.
For a given -tag efficiency, the uncertainty on the measurement increases when increases. For , the best measurement is when a perfect particle flow is assumed while for higher resolution on particle flow the precision increases to . The improvement of the particle flow enhances the precision on the trilinear coupling by a factor . This gain is equivalent to a factor on the required luminosity.

The dependence of the precision on the Higgs self coupling measurement with respect to the -tag efficiency is displayed on Figure 3 where an optimum is observed around . This -tag efficiency corresponds, for a typical jet energy of 45 GeV, to which means that the hhZ final state measurement is optimized for pure -tagging .
5 Conclusion
The feasibility of the measurement was established. The expected statistical precision with a typical detector is about 28%. It was shown that an optimization of the -tagging allows to reduce this uncertainty to 19%.
References
-
[1]
Slides:
http://ilcagenda.linearcollider.org/contributionDisplay.py?contribId=155&sessionId=71&confId=1296 - [2] A. Djouadi, W. Killian, M. Muhlleitner and P. Zerwas, Eur. Phys. J. C10
- [3] W. Kilian, T. Ohl, J. Reuter, WHIZARD: Simulating Multi-Particle Processes at LHC and ILC, arXiv: 0708.4233 [hep-ph]
- [4] T. Sjostrand, S. Mrenna and P. Skands JHEP05 (2006) 026.
- [5] M. Pohl, H. J. Schreiber, SIMDET.3 A Parametric Monte Carlo for a TESLA Detector, DESY 99-030 (1999)
- [6] R. Hawkings, Vertex detector and flavour tagging studies for the Tesla linear collider, LC-PHSM/2000-026
-
[7]
J. Schwindling, MLPFit: A tool for Multi-Layer
Perceptrons,
http://home.cern.ch/~schwind/MLPfit.html