A search for rapid pulsations among 9 luminous Ap stars††thanks: Based on observations collected at the European Southern Observatory, Paranal, Chile, as part of programmes 075.D-0145 (A), 078.D-0080(A), 072.D-0138(A) and 077.D-0150(A).
Abstract
The rapidly oscillating Ap stars are of importance for studying the atmospheric structure of stars where the process of chemical element diffusion is significant. We have performed a survey for rapid oscillations in a sample of 9 luminous Ap stars, selected from their location in the colour-magnitude diagram as more evolved main-sequence Ap stars that are inside the instability strip for rapidly oscillating Ap (roAp) stars. Until recently this region was devoid of stars with observed rapid pulsations. We used the VLT UV-Visual Echelle Spectrograph (UVES) to obtain high time resolution spectroscopy to make the first systematic spectroscopic search for rapid oscillations in this region of the roAp instability strip. We report 9 null-detections with upper limits for radial-velocity amplitudes of and precisions of for combinations of Nd and Pr lines. Cross-correlations confirm these null-results. At least six stars are magnetic and we provide magnetic field measurements for four of them, of which three are newly discovered magnetic stars. It is found that four stars have magnetic fields smaller than kG, which according to theoretical predictions might be insufficient for suppressing envelope convection around the magnetic poles for more evolved Ap stars. Suppression of convection is expected to be essential for the opacity mechanism acting in the hydrogen ionisation zone to drive the high-overtone roAp pulsations efficiently. Our null-results suggest that the more evolved roAp stars may require particularly strong magnetic fields to pulsate. Three of the studied stars do, however, have magnetic fields stronger than 5 kG.
keywords:
stars: individual: HD 107107; HD 110072; HD 131750; HD 132322; HD 151301; HD 170565; HD 197417; HD 204367; HD 208217 – stars: magnetic fields – stars: oscillations – stars: variables: other1 Introduction
Why do some stars oscillate while others do not? This question is particularly relevant for the class of rapidly oscillating Ap (roAp) stars for which the discovery of high-frequency oscillations came as a surprise (Kurtz, 1982). The Scuti pulsations of stars in this area of the colour-magnitude diagram (CMD) were not theoretically predicted to produce the observed high-frequency, high-overtone modes. Subsequently, considerable observational and theoretical efforts have been able to describe most pulsation properties of roAp stars through i) the oblique pulsator model (Kurtz, 1982), ii) the probable driving mechanism of the pulsations (Balmforth et al., 2001) and iii) their link with the magnetic fields present in Ap stars (see, e.g., Cunha 2006; Saio 2005).
Ap stars are chemically peculiar stars that range from early-B to early-F spectral types with the majority having detectable magnetic fields with strengths of a few to a few G (Bychkov, Bychkova, & Madej 2003, according to whom per cent have mean longitudinal fields above 400 G). For the cool Ap stars (also called CP2 stars), abundance anomalies are typically visible in their spectra as abnormally strong absorption lines, particularly of rare-earth elements (REEs). Candidate roAp stars can therefore be selected photometrically due to the influence of these spectral features on narrow-band photometric indices such as those of the Strömgren filter system (Martinez 1993, see also Sect. 2.1).
The high-overtone roAp oscillations are thought to be driven by the opacity-mechanism acting in the partial hydrogen ionisation zone (Dziembowski & Goode, 1996; Balmforth et al., 2001; Cunha, 2002; Saio, 2005). The frequency range of the excited modes is related to the presence of strong magnetic fields in roAp stars that i) directly stabilise the low-frequency, low-order Scuti oscillations, excited by the -mechanism acting in the He ii partial ionisation zone (Saio, 2005), and ii) indirectly enhance the driving of high-order oscillations by the -mechanism acting in the partial hydrogen ionisation zone (Balmforth et al., 2001). In particular, the stabilisation of the Scuti modes can be explained by the dissipation of slow Alfvén waves (Saio, 2005) and by the suppression of turbulent motion in the outer layers of the magnetic pole regions of roAp stars, which speeds up gravitational settling of helium and drains it from the He ii ionisation zone (Theado et al., 2005). An implication of the high radial order of the observed modes of roAp stars is that the observable pulsation amplitudes become depth dependent. This pulsational structure provides a unique opportunity for studying the magneto-acoustic structure of the pulsations in 3D because of the element stratification in the atmospheres of these stars. Different elements, such as Fe, Pr, Nd, Eu and H, act as tracers for the pulsation structure due to their different properties regarding formation depth and extent of formation regions. Examples of depth-dependent measurements of pulsations are now numerous, such as Kurtz et al. (2005); Elkin, Kurtz, & Mathys (2005); Ryabchikova et al. (2007). The roAp stars are thus unique objects for studying the interactions among stellar pulsation, magnetic fields and atomic diffusion. The latter is important for, e.g., estimates of globular cluster ages where He settling is significant, pulsation driving mechanisms in sdB and Cephei stars where radiative levitation of Fe is needed for instability, and the Standard Solar Model where both He settling and radiative levitation of some metals are included.
Only 37 roAp stars are known at present (Kurtz et al. 2006b; Tiwari, Chaubey, & Pandey 2007) despite several searches for rapid pulsation in Ap stars, such as those by Nelson & Kreidl (1993); Martinez & Kurtz (1994); Handler & Paunzen (1999); Ashoka et al. (2000); Weiss et al. (2000); Dorokhova & Dorokhov (2005); Joshi et al. (2006). The selection of roAp candidates is mostly based on photometric indices pointing to chemical peculiarities in the spectra. There is at present no clear correlation between radial velocity (RV) amplitude and photometric amplitude in roAp stars (see Table 1 of Kurtz et al. 2006b). For a (non-exhaustive) list of spectroscopic studies of roAp stars, see Kurtz et al. (2006a). Cunha (2002) calculated a theoretical instability strip for roAp stars and compared it to locations of 16 known roAp stars. The region around the terminal age main-sequence is remarkably devoid of pulsators which, as Cunha points out, could be an observational bias. She predicted that more luminous and evolved Ap stars may pulsate with lower frequencies ( mHz) which makes it harder to detect them in the typically short high-speed observing runs. Note that this frequency range overlaps with the highest Sct frequencies, such as for HD 34282 (0.92 mHz, Amado et al. 2004). Alternatively, she proposed that this absence of known evolved roAp stars could reflect a real deficiency in the fraction of pulsators in that region of the HR diagram, resulting from the fact that the magnetic field is less likely to suppress envelope convection in more evolved stars. The photometric survey by Martinez & Kurtz (1994) was indeed less sensitive to low-amplitude roAp periods longer than 15 min and got a null-result for HD 116114 for which a 21-min oscillation was recently detected spectroscopically by Elkin et al. (2005). A dedicated survey of luminous Ap stars therefore seems pertinent.
Ap stars inside the roAp instability strip that do not exhibit any detectable variability are called non-oscillating Ap (noAp) stars. As seen in, e.g., the astrometric HR-diagram by Hubrig et al. (2005, their figure 2) for roAp and Ap stars, the apparent noAp stars occupy essentially the same regions as the roAp stars. However, the noAp stars appear to be systematically more evolved than the roAp stars (North et al., 1997; Handler & Paunzen, 1999; Hubrig et al., 2000). To fully understand the mechanism responsible for driving oscillations in roAp stars, it is essential to confirm and understand why so many stars with similar characteristics are apparently stable against pulsations. The apparent absence of oscillations in noAp stars does not, however, necessarily mean that oscillations are suppressed. For instance, detection of oscillations may depend on lifetimes of excited modes (may be days for some roAp stars, Handler 2004), on beating between multiple modes, on the geometry of the magnetic field’s orientation and the aspect in which the stellar surface is observed together with the surface distribution of the chemical elements used to detect the oscillations. Further, the signal-to-noise ratio () of the obtained photometry or spectroscopy may simply be too low to detect the typically low-amplitude roAp pulsations. Finding high precision null-results for a statistically significant sample of roAp candidates would be a safe basis for concluding whether noAp stars exist or whether the current lack of known luminous roAp stars is an observational bias. From a theoretical point of view, stars located inside the theoretical instability strip may be noAp stars if the magnetic field is too weak to effectively suppress convection in the stellar envelope. A good test sample should, therefore, also include stars with strong magnetic fields.
To try to answer the question of whether the absence of observed variability among the luminous Ap stars is an observational selection effect only, or in fact due to intrinsic properties, we have studied 9 such stars at high radial-velocity precision. Our immediate goal with UVES was to search these luminous Ap stars for roAp oscillations at high radial velocity precision. Table 1 lists the known properties of the 9 targets and gives an observing log for the collected spectra. We find no pulsation in any of the 9 stars; Tables 4 and 5 below present the null-results of the frequency analyses.
In the following sections, we describe selection and observation of the targets along with the data reduction in Sect. 2, then follows the data analyses including estimation of physical parameters and the radial-velocity analysis in Sect. 3. We show that our analyses reach the same precision as other radial-velocity studies of roAp stars in the literature and we then give the results for each target on a star-by-star basis. Finally we discuss the null-results in Sect. 4.
| Star | #spec | HJD obs | Time | S/N Lower | Upper | ||
|---|---|---|---|---|---|---|---|
| (h:m:s) | (∘: ′ : ′′ ) | (d) | (h) | ||||
| HD 107107 | 111 | 12:19:04.8 | -40:09:47 | 2453509.504 | 1.94 | 79 (77–82) | 62 (56–77) |
| HD 110072 | 69 | 12:39:50.2 | -34:22:30 | 2453509.591 | 2.06 | 50 (43–55) | 38 (32–49) |
| HD 131750 | 111 | 14:56:20.7 | -30:52:36 | 2453509.681 | 1.98 | 80 (74–87) | 66 (57–74) |
| HD 132322 | 111 | 15:01:36.0 | -63:55:35 | 2453510.519 | 2.03 | 151 (147–155) | 141 (132–152) |
| HD 151301 | 111 | 16:49:28.3 | -54:26:47 | 2453510.715 | 1.95 | 82 (76–84) | 67 (60–79) |
| HD 170565 | 85 | 18:30:08.2 | -02:35:26 | 2453509.778 | 2.50 | 89 (83–94) | 77 (69–86) |
| HD 197417 | 125 | 20:48:48.1 | -72:12:44 | 2453509.879 | 2.20 | 107 (94–113) | 93 (79–110) |
| HD 204367 | 111 | 21:28:41.2 | -25:38:39 | 2453510.798 | 1.96 | 113 (108–120) | 101 (93–115) |
| HD 208217 | 138 | 21:56:56.4 | -61:50:44 | 2453510.896 | 2.52 | 156 (142–165) | 148 (128–159) |
2 Selection of the candidates, observations and data reduction
2.1 Selection
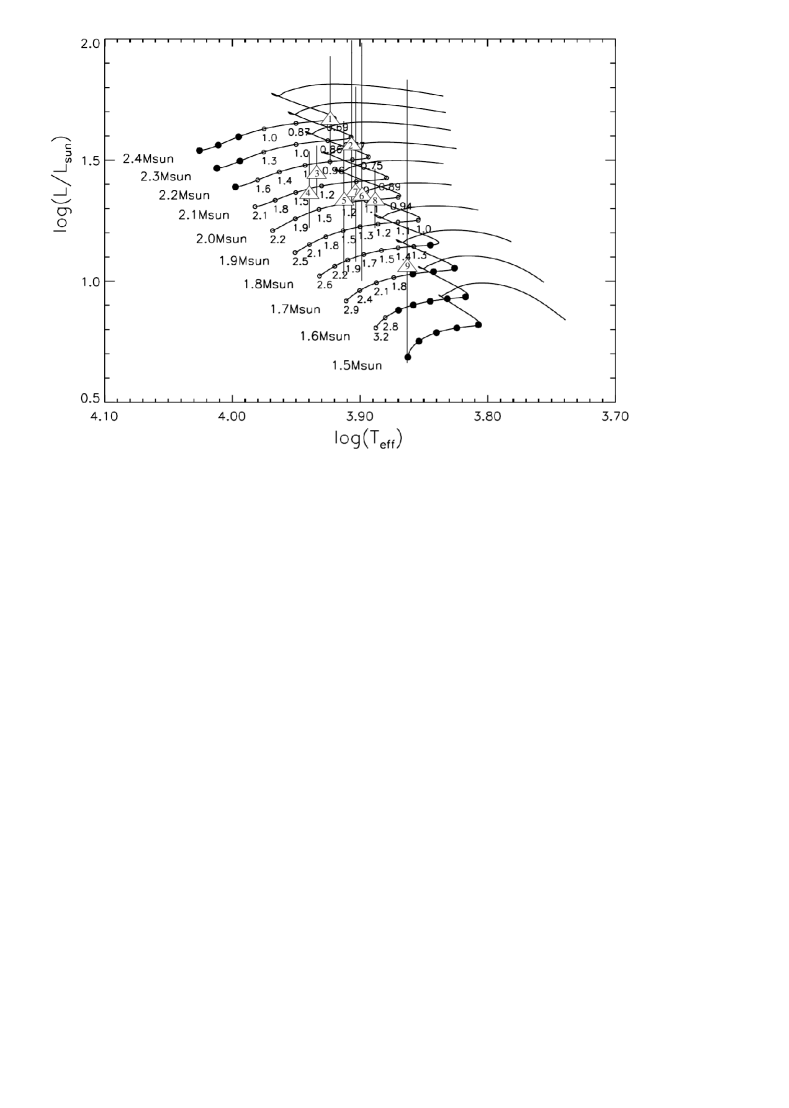
We selected 9 stars based on Strömgren and indices from the Cape catalogue of cool Ap stars by Martinez (1993), and luminosities from Hipparcos parallaxes. For Strömgren photometry, the index is normally an indicator of luminosity while is an indicator of metallicity. The index is sensitive to temperatures for stars in the range A3–F2. Also indicates temperature, but is influenced by reddening. The relative indices and indicate how a given star deviates in and from ‘normal’ zero-age main sequence stars (see also Crawford, 1979). A more negative value of indicates stronger metallicity. For normal stars is a luminosity indicator, while for Ap stars it is depressed by heavy line blocking and hence is not a reliable indicator of luminosity. A negative is, in fact, indicative of strong peculiarity. However, because increases with luminosity, luminous Ap stars may have positive which, without independent information on the luminosity, makes their chemical composition appear ‘normal’ in this index. A negative has frequently been used for target selection in previous searches for roAp stars; as a consequence, luminous Ap stars have seldom been tested for pulsation. Our sample of 9 roAp candidates was therefore hand-picked among Ap stars with Hipparcos parallaxes; their main physical properties are given in Table 2. Fig. 1 shows that the astrometric luminosities (Table 2, column 11) place the chosen sample among the more evolved Ap stars (towards the end of their core-hydrogen burning phase). The corresponding temperatures (column 9) are described in Sect. 3.1.1. The absolute magnitude in the -band and the stellar luminosity were derived using the standard relations:
| (1) |
where the trigonometric parallax is measured in arc seconds and the interstellar extinction in the -band is , and
| (2) |
where we used . Column 8 in Table 2 gives reddening read from the maps by Burstein & Heiles (1982) and columns 11 and 12 give the luminosities derived with and without reddening. The reddening maps have errors in of 0.01 mag or 10 per cent (whichever is the greatest) and resolution of 0.03 mag. HD 170565, HD 132322 and HD 151301 are near the galactic plane and outside these maps so a lower limit on reddening was used. These reddening estimates are in all cases conservative values but contribute little to the luminosities where errors are dominated by the errors from the parallaxes. The only exception is HD 132322 which has a precise distance. No Lutz-Kelker correction (Lutz & Kelker, 1973) was applied to the luminosities. The values for projected rotational velocities and magnetic fields in Table 2 are described further in Sects. 3.1.1 and 3.1.2.
| Star | /L⊙ | /L⊙ | Note | |||||||||||
| HD | mag | mag | mag | mag | mag | (mas) | mag | K | mag | EB-V0 | kG | |||
| 107107 | 8.734 | 0.074 | 0.234 | 0.835 | 2.864 | 0.10–0.14 | 8300 | 1.404 | 1.33 | 1.68 | #5 | |||
| 110072 | 10.104 | 0.227 | 0.281 | 0.487 | 2.759 | 0.06–0.09 | 7300 | 2.050 | 1.07 | 1.25 | #9 | |||
| 131750 | 8.549 | 0.121 | 0.260 | 0.710 | 2.847 | 0.06–0.12 | 8100 | 0.831 | 1.56 | 1.79 | #2 | |||
| 132322 | 7.357 | 0.129 | 0.227 | 0.943 | 2.894 | 0.21 | 8600 | 1.167 | 1.44 | 2.03 | #3 | |||
| 151301 | 8.541 | 0.222 | 0.244 | 0.666 | 2.827 | 0.21 | 8000 | 1.298 | 1.37 | 1.90 | #7 | |||
| 170565 | 9.130 | 0.269 | 0.253 | 0.628 | 2.825 | 0.21 | 7900 | 1.303 | 1.37 | 1.90 | N/Ab | #6 | ||
| 197417 | 8.009 | 0.038 | 0.233 | 0.939 | 2.877 | 0.03–0.06 | 8400 | 0.555 | 1.68 | 1.82 | #1 | |||
| 204367 | 7.830 | 0.039 | 0.220 | 0.996 | 2.899 | 0.03–0.06 | 8700 | 1.364 | 1.36 | 1.49 | #4 | |||
| 208217 | 7.199 | 0.102 | 0.274 | 0.626 | 2.816 | 7700 | 1.371 | 1.34 | 1.37 | #8 | ||||
| kG (Hubrig et al., 2006), kG (Kudryavtsev et al., 2006), | ||||||||||||||
| kG (Mathys et al., 1997) | ||||||||||||||
Fig. 1 shows the locations of these stars in a colour-magnitude diagram (CMD) superposed with evolutionary tracks by Christensen-Dalsgaard (1993) and locations indicated for stars that are predicted to be pulsationally stable or unstable (Cunha 2002). Luminosities are from distances based on Hipparcos measurements (ESA, 1997) with considerable errors from the parallaxes indicated. Temperatures were estimated from the grids by Moon & Dworetsky (1985) based on photometry (Martinez, 1993) alone.
2.2 Observations and data reduction
Our spectroscopic observations were obtained at the Very Large Telescope (VLT) using the Ultraviolet and Visual Echelle Spectrograph (UVES). The fast readout mode of 625 kpix s-1 was used for reading out the two CCD-mosaics on the red arm of UVES in the 4-port low gain mode. We observed our 9 targets about 2 h each (see the observing log in Table 1) on the two nights of May and May 2005 (JD2453509 and JD2453510), using exposure times of 40 s with s readout and overhead times, giving a mean time resolution of 64 s. However, for the faintest stars HD 110072 and HD 170565, exposure times were doubled to 80 s, which reduced the time resolution to 107 s. The total number of spectra per target ranges from 69 to 138. To ensure high count rates, an image slicer was used. The spectra were processed with the UVES pipeline and ESO MIDAS package to extract 1D spectra using nightly flatfield spectra and thorium-argon calibrations obtained at each telescope pointing. The spectra were extracted using the ‘average extraction’ option and the flatfielded spectra from the two CCDs on the mosaic were rebinned to same step size in wavelength and combined in one spectrum. The rectification was performed in 3 steps. First, all spectra from the same night were normalised with a spline-fit to a high- spectrum of that night, only considering large-scale patterns, such as slopes. Next an undulating continuum pattern that followed the spectral orders was fitted with splines using averaged spectra of all spectra each night and then applied to eliminate the undulations in individual spectra. Finally, all spectra of the same series (i.e. of the same star) were rectified relative to a mean spectrum of that series. Removal of effects from cosmic rays and CCD blemishes in the spectra was made in two steps: cosmic rays were identified and removed by comparing each 2D CCD image with the previous and subsequent one, and the final, rectified 1D spectrum was corrected by a routine that identified and removed sharp emission features of non-stellar origin. For all spectra, the region Å suffers from spectrum-to-spectrum variability on the level of 10 per cent. A gap occurs in the region Å and is caused by the gap between the two CCD mosaic halves (referred to as ‘lower’ and ‘upper’).
For unknown reasons, our UVES reductions resulted in an increased noise in the spectra redwards of the gap, which varies from star to star but is particularly pronounced for HD 110072. This affects the accuracy of , magnetic and radial-velocity measurements by increasing the noise for this spectral region, in some cases by 33 per cent. The effect is most clear when comparing the noise of cross-correlation results in the spectral regions bluer and redder than the gap (Table 5), or when comparing noise in co-added series of spectra of individual stars on both sides of the gap. The effect varies for individual stars and we suspect the origin of the problem to be found in the reduction of the spectra. During observations, it is more difficult to keep an object on the slicer when observing very close to zenith. This also affects the and was indeed the case for HD 110072 and HD 131750 that were both observed at about 10 degree distance from zenith. However, as the performed radial velocity analyses utilise regions on both sides of the gap, including the unaffected 1000 Å wide region below the gap, and do reach precisions comparable to those published in the literature for roAp stars, the current quality of the reductions suffice for the aims of this investigation.
The zero point of the absolute wavelength calibration is of little importance for the differential radial-velocity analysis, but was found accurate to the level of based on the telluric line list by Griffin & Griffin (1973). This is as good as one may expect from radial velocities of telluric lines that depend on conditions in the Earth’s upper atmosphere. Barycentric velocity corrections were recorded in the FITS headers of the reduced spectra for the later analysis of the velocity fields, and not included in the wavelength calibration.

3 Data analysis and results
Our aim with this study was to search the spectra of nine roAp candidates for rapid oscillations and through simple estimates of physical properties to characterise the detected noAp or roAp stars. For this purpose, we used the cross-correlation technique and centre-of-gravity procedure to search for rapid pulsation using, respectively, Doppler shifts of whole wavelength regions and of individual and combined line profiles. Stellar properties were estimated with photometry and/or by comparison of observed spectra to synthetic line profiles.
| Line | Wavelength (Å) |
|---|---|
| H i | 6562.852 |
| Li i | 6707.761 |
| Na i | 5895.924, 5889.951 |
| Ca i | 6122.217, 6162.173 |
| Cr ii | 5280.054, 5310.687 |
| Fe i | 5434.524, 6136.614, 6137.694 |
| Fe ii | 5061.718, 5284.109 |
| Ba ii | 5853.675, 6141.713 |
| Ce ii | 5077.854, 5117.946, 5147.565, 5459.193, 5468.371, |
| 5613.694, 5680.261, 5711.437, 5858.546 | |
| Pr ii | 5220.108, 5605.642, 6114.381 |
| Pr iii | 5208.507, 5284.693, 5299.993, 5844.408, 5956.043, 6053.003, |
| 6090.010, 6160.233, 6195.619, 6866.793 | |
| Nd ii | 5319.811, 5356.967, 5361.467, 5620.594, 6425.779, 6550.178 |
| Nd iii | 5085.001, 5203.902, 5286.764, 5825.857, 5845.068, |
| 6145.072, 6327.244, 6550.326 | |
| Eu ii | 6437.680, 6645.064 |
| Gd ii | 5860.727 |
For the purpose of spectral line identification, a synthetic comparison spectrum was produced with SYNTH (Piskunov, 1992) using a Kurucz stellar atmosphere model for K, turbulent velocity 2 km s-1, and slightly increased solar metal abundance . Atomic line data were taken from the Vienna Atomic Line Database (VALD, Kupka et al. 1999) for increased abundances mainly for the elements Nd, Pr, Sr, Cr, Eu, as given in Table 6. Other sources used for line data were the atomic database NIST111http://physics.nist.gov and the Database on Rare Earth Elements at Mons University (DREAM222http://w3.umh.ac.be/astro/dream.shtml) through its implementation in the VALD. This model’s temperature is less optimal for the coolest of the studied stars, but still appropriate for selecting lines for the radial-velocity analyses.
In the following section we describe the estimation of stellar physical parameters for the examined sample, the radial-velocity measurements and frequency analyses, and a performance test carried out on UVES data for two known roAp stars.
3.1 Analysis
The present study is a survey for variability, and therefore an analysis of abundances, temperatures, surface gravities and projected rotational velocities is outside the scope of this paper. Such an analysis must take the chemical element stratification, and possibly also temperature gradients, into account. We do, however, in Table 2 give estimates of , effective temperatures and magnetic fields of the studied sample.
3.1.1 Temperatures and rotational velocities
The spectra of Ap stars have flux distributions that are deformed by strongly peculiar elemental abundances. Calibrations based on Strömgren indices may therefore not provide reliable estimates of temperatures and surface gravity, . The index, however, remains largely unaffected by this. Effective temperatures were thus estimated with the grids by Moon & Dworetsky (1985) using from Table 2 (from Martinez 1993). We allowed the value of to be free in these grids, fixed and assumed . The resulting photometric temperatures are given in Table 2. An additional check on was made by comparing synthetic line profiles to the observed spectra. This method is sensitive to normalisation errors in the region (the above-mentioned undulations), and the core-wing anomaly in this line (Cowley et al., 2001) that prohibits fitting the atomic line profile with normal models. However, the average deviation of the photometric and spectroscopic temperatures is only 5 per cent, with the exception of HD 131750 which has a 17 per cent higher spectroscopic temperature. Moon & Dworetsky’s grids are furthermore ambiguous for K and in those cases the spectroscopic temperatures of HD 132322 and HD 204367 were K and K, respectively. The synthetic line profiles were based on Kurucz atmospheres (Castelli & Kurucz, 2003) and atomic line data from the VALD database using increased REE abundances (identical for all models). The grid of models had K in steps of 500 K with , 4.0 and, in a few cases, 4.5. Best fits were obtained for , mainly to the lower side of this range. Better estimates of require a detailed abundance analysis that takes stratification and magnetic fields into account, which will not be done here.
| Star | Nd ii | Nd iii | Ce ii | Pr ii | Pr iii | Nd,Pr | Eu ii | Telluric | H core | |||||||||||||||||
|---|---|---|---|---|---|---|---|---|---|---|---|---|---|---|---|---|---|---|---|---|---|---|---|---|---|---|
| n | n | n | n | n | n | n | n | |||||||||||||||||||
| HD | () | () | () | () | () | () | () | () | () | |||||||||||||||||
| 107107 | 28 | 82 | 4 | 28 | 108 | 6 | 32 | 118 | 6 | 44 | 133 | 2 | 16 | 59 | 10 | 12 | 39 | 25 | 23 | 88 | 2 | 20 | 62 | 2 | 20 | 65 |
| 110072 | 27 | 92 | 5 | 16 | 52 | 8 | 30 | 100 | 5 | 31 | 110 | 5 | 15 | 55 | 10 | 10 | 42 | 28 | 31 | 95 | 2 | 20 | 57 | 2 | 52 | 135 |
| 131750 | 38 | 132 | 4 | 30 | 102 | 5 | 40 | 150 | 6 | 59 | 177 | 2 | 29 | 112 | 12 | 18 | 58 | 23 | 48 | 161 | 2 | 20 | 57 | 3 | 21 | 72 |
| 132322 | 32 | 90 | 5 | 20 | 69 | 11 | N/A | N/A | 0 | 58 | 196 | 1 | 22 | 70 | 8 | 13 | 37 | 26 | 22 | 72 | 4 | 10 | 30 | 3 | 19 | 59 |
| 151301 | 24 | 84 | 3 | 11 | 35 | 9 | 62 | 237 | 1 | 41 | 136 | 2 | 12 | 39 | 9 | 8 | 24 | 25 | 20 | 86 | 4 | 13 | 42 | 4 | 19 | 54 |
| 170565 | 24 | 79 | 7 | 15 | 52 | 13 | 23 | 64 | 12 | 53 | 163 | 4 | 16 | 44 | 13 | 10 | 32 | 41 | 37 | 111 | 4 | 9 | 30 | 2 | 24 | 75 |
| 197417 | 49 | 181 | 3 | 41 | 114 | 6 | N/A | N/A | 0 | 67 | 228 | 1 | 25 | 96 | 9 | 20 | 65 | 19 | 54 | 185 | 2 | 17 | 59 | 4 | 17 | 52 |
| 204367 | 53 | 181 | 4 | 33 | 86 | 6 | N/A | N/A | 0 | 80 | 249 | 1 | 51 | 143 | 5 | 25 | 72 | 16 | 76 | 236 | 3 | 7 | 18 | 2 | 14 | 46 |
| 208217 | 10 | 34 | 7 | 5 | 17 | 12 | N/A | N/A | 0 | 20 | 69 | 4 | 7 | 29 | 13 | 4 | 15 | 37 | 14 | 70 | 6 | 10 | 33 | 6 | 13 | 40 |
| Star | 5150–5800 Å | 6035– 6273 Å | 6350–6700 Å | 6510– 6570 Å | 5888–5898 Å | 6873–6899 Å | ||||||
|---|---|---|---|---|---|---|---|---|---|---|---|---|
| HD | () | () | () | () | () | () | ||||||
| 107107 | 3.2 | 8.9 | 4.4 | 12.5 | 4.1 | 13.9 | 4.2 | 13.2 | 5.0 | 13.4 | 5.0 | 13.4 |
| 110072 | 3.2 | 12.3a | 4.7 | 12.7 | 5.0 | 12.8 | 5.4 | 14.2 | 5.9 | 17.3 | 5.2 | 16.7 |
| 131750 | 3.0 | 9.1 | 4.9 | 14.9 | 5.3 | 16.1 | 4.8 | 15.0 | 3.1 | 12.9b | 3.6 | 10.9 |
| 132322 | 2.0 | 6.3 | 6.2 | 20.9 | 5.4 | 13.5 | 6.7 | 16.4 | 1.4 | 5.4 | 1.2 | 3.4 |
| 151301 | 1.4 | 4.6 | 8.6 | 31.7 | 10.0 | 38.3 | 8.4 | 30.9 | 2.1 | 6.5 | 1.4 | 5.9 |
| 170565 | 4.7 | 9.7 | 6.9 | 26.1 | 6.6 | 27.7 | 5.4 | 19.8 | 2.2 | 7.9 | 1.8 | 7.7 |
| 197417 | 1.7 | 5.3 | 3.5 | 9.8 | 9.4 | 10.1 | 3.7 | 10.4 | 2.2 | 7.1 | 2.2 | 8.9 |
| 204367 | 2.0 | 5.3 | 17.5 | 53.0 | 16.2 | 48.9 | 9.3 | 27.1 | 3.4 | 11.0 | 2.4 | 6.3 |
| 208217 | 1.4 | 3.0 | 2.8 | 7.8 | 2.8 | 7.5 | 2.5 | 7.4 | 9.0 | 38.0c | 1.3 | 3.4 |
| a at 0.45 mHz, next-highest peak has | ||||||||||||
| b at 0.45 mHz, next-highest peak has | ||||||||||||
| c at 0.48 mHz, next-highest peak has | ||||||||||||
Projected rotation velocity estimates were made by measuring the Fe i lines 5434.52 and 5576.08 Å that are rather insensitive to magnetic broadening. Synthetic models for were compared to the spectra for a range of iron abundances and rotational broadening, using models corresponding in temperature to the individual stars. The macroturbulence was varied in the range . When strong line blending hampered the measurements, additional iron lines were used to constrain the estimates. The derived velocities were then refined with synthetic models that took magnetic broadening into account (SYNTHMAG) (Piskunov, 1999). The analyses of several, typically 20–30, iron lines that determine the mean quadratic magnetic fields also give precise rotation velocities (Mathys & Hubrig, 2006). These values are formally more precise than, but consistent with, the above estimates and are therefore given in Table 2, except for the case of HD 170565 where only the first estimate is given. It should be noted, though, that the values of the rotation velocities that are obtained as part of the analysis performed to determine the mean quadratic magnetic field are upper limits on the , since they may actually include contributions from other line broadening effects that are proportional to wavelength, such as micro- or macroturbulence. (Instrumental and thermal broadening are however duly isolated – see Mathys & Hubrig (2006) for details.) However these contributions are mostly negligible, except in the slowest-rotating stars.
3.1.2 Magnetic fields
Known roAp stars have strong magnetic fields (Kurtz et al., 2006a), and we therefore searched for magnetically resolved or broadened lines in the spectra of the roAp candidates. Many Ap stars have fields that are measurable only with polarimetry. It takes a strong field, typically exceeding kG, combined with a slow projected rotation rate (smaller than ) to produce magnetically resolved lines by the Zeeman effect (Mathys et al., 1997).
In the simplest cases of spectral lines corresponding to doublet or triplet Zeeman patterns, simple formulae can be applied to determine in a virtually approximation-free manner the mean magnetic field modulus from measurement of the wavelength separation of the resolved Zeeman components (Mathys, 1989). is the average of the modulus of the magnetic vector, over the visible stellar hemisphere, weighted by the local line intensity. For a triplet pattern, its value (in G) is obtained from the wavelength separation between the central component and either of the components, , by application of the formula:
| (3) |
where is the central wavelength of the line and is the effective Landé factor of the transition. Both and are expressed in Å. For a doublet pattern, the relation between the field modulus and the wavelength separation of the split components (each of which is the superposition of a and a component) is:
| (4) |
Note that Eq. 4 also describes the relation between and the wavelength separation of the red and blue components of a triplet.
Mainly due to smearing by rotational broadening, only one of the studied stars (HD 208217) has clearly resolved lines from magnetic splitting that can be used with Eqs. 3 or 4 to estimate the field strength directly. In one other star, HD 107107, magnetic splitting and rotational broadening are comparable for the lines with the highest magnetic sensitivity, so that it is possible to obtain an estimate of the surface magnetic field by fitting synthetic profiles to these lines. This estimate, which we shall denote by , should be of the same order of magnitude as the mean magnetic field modulus, but it is not entirely equivalent to the latter. (In particular, is model-dependent, while is not.)
For the other stars we estimated the surface magnetic field from consideration of the magnetic broadening and intensification of magnetically sensitive lines. By assuming that a line’s full-width at half maximum (FWHM) increases linearly with the separation of its (unresolved) Zeeman-split components, we used Eq. 4 to obtain an estimate of the magnetic field by comparing lines with different effective Landé factors (see also Preston, 1971). The assumption is justified as long as the magnetic splitting of the analysed lines is small compared to their overall width (in particular, due to rotational broadening); then, should typically be comparable to or (see below).
Other estimates of the magnetic fields were obtained by comparing the observed spectra to magnetically resolved or broadened line profiles to determine . These models were synthesised with SYNTHMAG for a temperature grid of , 8000 and 8500 K. For this comparison, Cr and Fe lines with low Landé factors were used to fix abundances and the rotation rate of the models prior to applying them to magnetically resolved or broadened lines. Instrumental broadening of 0.05 Å was adopted while the macroturbulence was fixed for each star within the range . This approach worked well for magnetically broadened lines because both the equivalent width and the FWHM are affected by magnetic broadening; when absorption in a line is intrinsically spread over a larger wavelength range, the absorption becomes more effective, increasing the equivalent width (magnetic intensification). Again, the quantity that is derived should be comparable to the mean magnetic field modulus, but in general is not exactly equal to it.
Finally, the values of the mean quadratic magnetic field, , were derived through application of the method described in Mathys & Hubrig (2006). Here is the mean square magnetic field modulus (the average over the stellar disk of the square of the modulus of the field vector, weighted by the local emergent line intensity), while is the mean square longitudinal field (the average over the stellar disk of the square of the line-of-sight component of the magnetic vector, weighted by the local emergent line intensity). The analysis was based on consideration of samples of reasonably unblended lines of Fe i and Fe ii; the number of analysed lines varies from star to star and ranges from 14 to 33. This approach could not be successfully applied to HD 170565, for which the number of usable diagnostic lines (9) proved insufficient to untangle the contributions of the magnetic field (probably fairly strong), non-negligible rotation, and a possibly inhomogeneous distribution of iron on the stellar surface. The mean quadratic magnetic field is typically a few percent greater than the mean magnetic field modulus.
For 3 stars, we also indicate in Table 2 values of the mean longitudinal magnetic field and the magnetic field modulus from the literature. is the average over the stellar disk of the component of the magnetic vector along the line of sight, weighted by the local emergent line intensity. This field moment strongly depends on the geometry of the observation, and contrary to, e.g., or , it typically varies considerably during a stellar rotation cycle. Accordingly, it is not well suited to characterise the strength of the magnetic field in a star, other than to give (through its absolute value) a generally very conservative lower limit of the latter. But significant measurements of at least provide definitive evidence that a star is magnetic.
3.1.3 Radial-velocity shifts
Precise radial velocity shifts were measured for several spectral lines with the centre-of-gravity method and by fitting with Gaussian profiles. We used the local continuum in the selected sub-regions of measured lines, which gave consistent amplitudes for both methods in tests on UVES spectra for known roAp stars (see below). The centre-of-gravity method was preferred due to its stability and better ability to deal with blended line profiles. For strong and isolated lines, the two methods were comparable. Table 3 gives the most important spectral lines used, but the actual selection of lines depended on line blending and composition for each stellar case.
Additionally, line shifts were determined by cross-correlating the spectra with averaged spectra of each series. The maxima of the correlation functions were determined with a spline fit, which was found more reliable and stable than with Gaussian or 4th-order polynomial functions. The cross-correlation regions were chosen to be free of static features: , , and Å. However, to check for non-stellar periodicities, we also used two regions dominated by telluric or the interstellar lines of Na d: and Å. Because the UVES pipeline produces merged spectra in the linear wavelength scale only, we rebinned the selected regions of the spectra to wavelength which is more appropriate (Tonry & Davis, 1979) when determining velocity shifts using large wavelength regions. For each region, the size of the bins was optimised according to pixel size and local spectral resolution.


Because of the stratification of Ap star atmospheres, high-order mode pulsation amplitude and phase may change from element to element. Therefore the amplitudes of cross-correlation velocities cannot be directly compared to measurements of individual lines. Nevertheless, cross-correlation is efficient for detecting pulsations by using long wavelength regions with numerous lines to obtain high .


IDL tools for line and cross-correlation measurements and analyses were developed and tested on UVES spectra of the known roAp stars 33 Lib and HD 154708, published by Kurtz et al. (2005) and Kurtz et al. (2006b), respectively. For 33 Lib, we confirm two frequencies, 2.015 mHz and 1.769 mHz (Fig. 3), that are in excellent agreement with the published frequencies, amplitudes and noise levels for lines of Eu ii and H. In particular, we also confirm the low-amplitude oscillation for Fe i 5434.52 ( ). Similarly, we find amplitudes of for Ca i and Ti ii lines and for Ba ii. A telluric line (6888.96 Å) shows only noise with a highest amplitude of . We also made cross-correlation measurements of the above-mentioned wavelength regions and recovered the 2.015 frequency with amplitudes in the range to . All cross-correlation and line measurements gave similar significance , although at very different amplitudes (see also Fig. 3).
The second test, the new roAp star HD 154708, was even stronger as this star pulsates with amplitudes that are among the smallest known for roAp stars. Kurtz et al. (2006b) needed to combine RV measurements for several lines of this star in order to detect its rapid oscillation. We confirm that no individual line (including ) shows signal on or above the 4 level. Yet, as seen in Fig. 4, we directly recover the known 2.088 mHz mode with cross-correlations in the lower region of the spectra, Å, with , and a marginal detection ( ) using the single line Pr iii 5299.99 Å.
3.1.4 Frequency analysis
Frequency analyses were performed using a Discrete Fourier Transform programme (Kurtz, 1985) and the PERIOD04 (Lenz & Breger, 2005) programme. Linear trends in the individual hr radial-velocity series were fitted and removed with linear least-squares fitting. The noise in the amplitude spectra (see Tables 4 and 5) is determined from least-squares fitting of harmonics to the data following Deeming (1975). Because the barycentric velocity correction is approximately linear for each series of spectra, and rather small (the correction varies per hr for the 9 stars), it was eliminated with other drifts by a linear fit before the frequency analysis. With the 0.3 arcsec slit and seeing conditions of arcsec, the centring error for UVES is according to Bouchy et al. (2004). Furthermore, a 1-mbar change in pressure may induce drifts of 90 . During each of our observing nights, the pressure changed mbar. We therefore expect instrumental drifts of up to 280 per night, depending on seeing and pressure, and less during a 2-hr series on a star. The drift during a series of spectra may be non-linear (which is what we actually see in some cases). We noticed that comparison lines or regions with non-stellar constant lines occasionally exhibit drifts that are not seen for other regions of the same spectra (such as in Fig. 28, panel ‘Tell’). This difference may be because the strong and sharp telluric lines result in higher sensitivity, and they are influenced by fast wind speeds in the high layers of the Earth’s atmosphere where telluric lines are formed.
The null-results are presented on a star-by-star basis in Sections 3.2–3.10. We emphasise the statistical fact that when calculating about 50 amplitude spectra for each of nine candidate roAp stars, the chance for a spurious peak to reach the 4 level increases. Furthermore, the analyses show several combined amplitude spectra with single, prominent peaks reaching . However, the reality of such peaks is that they often originate from shallow and blended lines. Our criteria for detecting rapid oscillations are therefore: i) a peak of 4 times the noise (see Breger et al. 1993; Kuschnig et al. 1997) in an amplitude spectrum, ii) confirmation in an amplitude spectrum for either a line, or combination of lines, of a different ionisation or element, or cross-correlation region, and iii) only frequencies above 0.4 mHz (42 min) are considered. The latter is because we have less control over drifts on these time scales in the wavelength calibration (i.e. we did not observe simultaneous reference spectra). Lower frequencies are not typical for known roAp stars and may be due to, e.g., stellar rotation and surface spots. As an upper limit of the studied frequency range we use 6 mHz. The sampling frequency is either 9.5 mHz or 15.6 mHz, and the Nyquist frequency is half of that but still above the frequencies in known roAp stars.
In the following sections, we comment case-by-case on the individual stars in our sample.
3.2 HD 107107


With a magnitude of , this star is one of the faintest in our sample. Martinez (1993) obtained 1.89 h photometry during a single night and excluded periodic variability above 0.3 and 0.7 mmag for frequencies higher than 1.0 and 0.4 mHz respectively. Based on his photometry (Table 2) the corresponding temperature from the grids by Moon & Dworetsky (1985) is 8300 K. The Hipparcos mission obtained 100 useful measurements; an amplitude spectrum of those has a noise level of 3.1 mmag and excludes peaks above 9 mmag. The distribution of Hipparcos data is, however, not well suited for detecting rapid oscillations, but may instead show rotation periods of spotted stars. The Michigan Spectral Catalogue (Houk & Cowley, 1975) classifies the star as Ap CrEuSr. No spectroscopy has been previously published for HD 107107.
Our observations of this star comprise 111 UVES spectra obtained over a time span of 1.94 hr with 63-s time resolution. The spectra are rotationally broadened to = 10.5 (Table 2) and have single and strong REE lines. The star is very peculiar with strong Nd iii and Pr iii lines, probably with a large ratio between abundances of singly- and doubly-ionised REEs. The latter could indicate ionisation disequilibria of REEs, a common feature among known roAp stars (Ryabchikova et al., 2004). The Na d 5889.95 and 5895.92 Å lines each have a stellar and two interstellar components that are sharper, stronger and red-shifted with respect to the stellar one.
Radial velocity shifts of 47 stellar lines were measured (Table 4) using the full line profiles where line blending permitted it. The core of is constant to 65 ( ) and other lines also exhibit no detectable variability in the considered frequency range ( mHz). Table 4 and Figure 21 show selected results of the atomic lines measured in the frequency analysis. As indicated in the table, radial velocity series for different lines of same species were combined following Kurtz et al. (2006a) to reduce the noise. Combining all line measurements, including different species, we reach and a maximum amplitude of 34 . One peak at 1.8 mHz (panel ‘HD 107107 all’) is just above the 4 detection limit, but originates from weak and blended Nd iii lines. Yet, this ion has some of the highest amplitudes in roAp stars and is excellent for detecting rapid pulsations. However, this peak cannot be confirmed by lines of other elements, so following the criteria in Sect. 3.1.4 we rather label it a possible detection that needs confirmation. Other lines (such as Eu ii) show peaks near the detection limit, but again the frequencies are unconfirmed elsewhere. This demonstrates the difficulty in reliable detection of signal at this noise level. Selected results of the cross-correlation analysis, presented in Table 5 and Fig. 5, strengthen this null-result. For the 5 stellar wavelength regions defined in Sect. 3.1.3, the noise in the cross-correlation radial velocity shifts is around 4 without significant peaks above 15 . This is comparable to the result for the stable telluric line region ( Å).

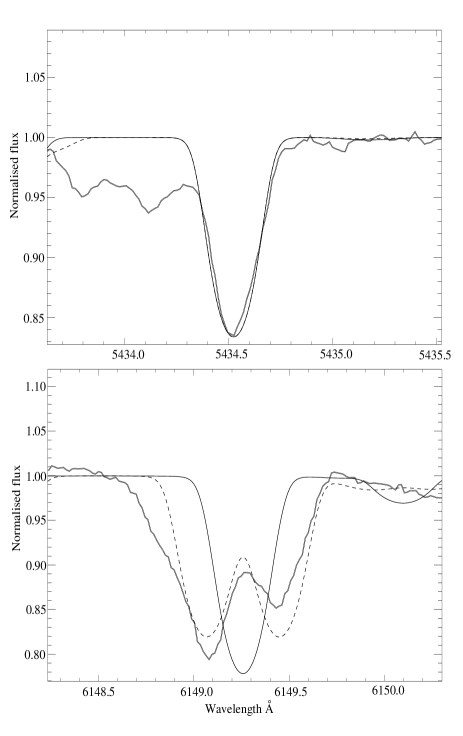
Some Cr ii and Fe ii lines are magnetically broadened or partially resolved and the mean quadratic field determined for 27 iron lines is kG. Using measured FWHM of 25 Fe lines, we derive (Fig. 6) a field strength of kG (1 error). Due to the combination of marginally resolved lines, rotational broadening and line blending, the use of apparently double lines gave less consistent results that, however, support existence of a strong magnetic field. SYNTHMAG synthetic profiles for different magnetic field strengths were computed and compared to Cr ii 5116.049, Cr ii 5318.382, Cr i 5247.566 and Fe ii 6149.25 Å. The best fit was obtained for a magnetic field strength of kG (estimated error). The magnetic field modulus was further estimated directly to be kG from separations of the partially resolved components of 5 Cr i, Cr ii and Fe i double lines using Gaussian fitting.
HD 107107 is, therefore, a chemically peculiar A star that is pulsationally stable above 39 ( ) for all Nd and Pr lines combined, and 9 ( ) for cross-correlations. The star is a new magnetic star, with marginally resolved Zeeman-split lines and a field of kG.
3.3 HD 110072
This is the faintest star in our sample. Martinez (1993) excluded photometric variability above about 1.4 and 0.8 mmag for frequencies above 0.4 and 0.9 mHz respectively, based on 67 min of photometry on a single night. The Hipparcos data show no significant peaks above 22 mmag at shorter frequencies. Houk & Cowley (1975) correctly note that HD 110072 is type Ap Sr(Cr) rather than K0 (SAO Staff 1966, classification source: M. W. Mayall).
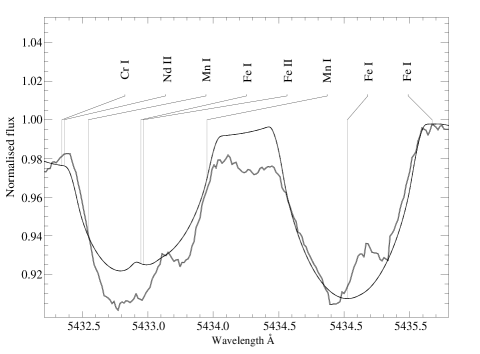
We collected 69 spectra with UVES in 2.06 hr with a time resolution of 107 s. The spectra are sharp lined: the estimated is only and many strong REE lines are visible, e.g., Pr, Nd, Y, Eu ii and Ce ii. Also Cr, Fe ii, Ni ii, Co i and Al ii are strong. In addition to a stellar component, the Na d lines each have 3 sharper and bluer (with respect to the stellar component) interstellar components of comparable strengths. The average spectrum is very similar to those of two known roAp stars 33 Lib and HD 176232 (Fig. LABEL:fig:110072cmproap). These have temperatures of and K respectively (Ryabchikova et al., 2004), which is supported by the indistinguishable shapes of the wings of 33 Lib and HD110072 ( K). All three stars have similar peculiarities for REEs, and Ba ii, Si i and Ca i are considerably weaker in HD 110072.
The profile is strongly asymmetric (see Fig. 2) with a dip blueward of the core. This dip is only per cent below the wing, but about 40 per cent broader (FWHM) than the core. We re-observed the star 2 yr later with FEROS at the ESO 2.2-m telescope and found this feature to have disappeared. This indicates that HD 110072 is a binary with a secondary star that may be less luminous than the primary. The broadness of the core of the secondary’s line can either be due to faster rotation ( ) or a later spectral type ( weakens toward G0). At other wavelengths, the UVES and FEROS spectra are largely identical and no secondary spectrum is seen (see also Fig. LABEL:fig:110072cmproap). However, a few lines appear only in the recent FEROS spectrum (resolution ) such as at locations of Sc i 6151.20 Å, O i 6156.77 Å, Sm ii 6157.53 Å, Nd ii 6549.52 Å and Fe ii 6552.33 Å. These lines have a broadening similar to the primary’s spectrum. We suspect they originate from this star and their appearance is a result of viewing different aspects of a magnetic field and/or spotted chemical surface distribution combined with line blending.
Radial velocity shifts were measured for 49 stellar lines (Table 4) and show no detectable signal. The blended H core is stable to 135 but the noise of in this radial velocity series is considerable, caused by fewer spectra and lower than obtained for the other roAp candidates. Highest significance () is seen for the combined Fe ii lines at 1.86 mHz, but iron is known in other roAp stars to have low amplitudes, and there is no support for this frequency from other lines. Combining all 49 lines (Fig. 22) reduces the noise to 8 m s-1, excluding peaks above 25 . The cross-correlations in Table 5, with examples in Fig. 7, result in flat amplitude spectra above 0.45 mHz. A 4 peak at 0.45 mHz is caused by non-linear drifts. The telluric line region is stable to 17 .


The mean quadratic field determined for 33 iron lines is kG. Comparison of 14 Cr and Fe lines with SYNTHMAG models indicates broadening by a magnetic field of kG, in particular for lines such as Cr ii 5246, Cr i 5247, Fe i 5324 and Fe ii 6149.25 Å. Measurements of FWHM of 27 iron lines with IRAF’s onedspec.splot task give (Fig. 8) a mean magnetic field modulus of kG (1 error).
HD 110072, the coolest star in our sample, with K, is thus a sharp-lined, double-lined binary with strongly peculiar lines of, e.g., Nd, Pr and Eu. HD 110072 is a new magnetic star with a field of kG and has spectral features very similar to the roAp stars 33 Lib and HD 176232. It is therefore intriguing that the star is pulsationally stable to 42 ( ) for all Nd and Pr lines combined, and 12 ( ) for cross-correlations. The slow rotation of HD 110072, its peculiar abundances and the rare combination of a magnetic field and its binary status makes it an important case for studying stellar evolution and diffusion processes.
3.4 HD 131750
For this star, Houk & Cowley (1975)’s classification is Ap CrEuSr. Martinez (1993) observed it h on each of three nights. The first night showed a clear peak around 8.5 mHz (which is outside the range we consider), but the other nights showed no variability above 0.6 mmag for mHz. Strohmeier, Fischer, & Ott (1966) listed an unconfirmed 0.35 mag variability from photographic plates (no period given). Hipparcos data do not support this.
Our 111 spectra, obtained in 1.98 hr with a time resolution 64 s, show HD 131750 to be rotating with = 25.3 with strong lines of Nd, Eu and Pr. The Na d doublet is strong with multiple sharp interstellar components.


Radial velocity shifts of 40 stellar lines were measured (Table 4). The noise in the radial-velocity measurements is relatively high due to the rotation rate. The core of H is stable to 72 ( ), while all measured lines combined (Fig. 23) reveal no rapid pulsation above 39 ( ). The cross-correlations provide an upper limit of to the averaged radial velocity shifts of the measured regions. Flat amplitude spectra of two of these regions are given in Fig. 9. The Na d region has a significant peak at 0.45 mHz caused by non-linear instrumental drifts in the data. Elsewhere, the amplitude spectra are flat, devoid of significant peaks.
Some of the stellar line profiles have flat ‘squared’ cores, such as Cr ii 5613.18 and Fe ii 5854.19, and others have apparently split cores such as Fe ii 5457.73, Cr ii 5472.60 and Fe i 5862.35. Magnetically resolved lines require a Zeeman splitting at least comparable to rotational broadening, in this case around kG. The mean quadratic field was derived to kG by using 9 iron lines. It is our impression that the upper limit on any magnetic field modulus (at this rotation phase) is 8 kG.
HD 131750 is thus an Ap star with strong REEs, no rapid oscillations above 58 ( ) amplitude for all Nd and Pr lines combined, and 9 ( ) for cross-correlations. The rotation rate = 25.3 results in considerable line blending and the star may have a magnetic field of a few kG.
3.5 HD 132322
Houk & Cowley (1975) classify this star as ‘Ap SrCrEu, A1’ and note that Sr is extremely strong. Photometric Strömgren indices also indicate strong peculiarity. Martinez (1993) examined the star during a single night and excluded rapid photometric variability above 0.4 mmag for the frequency range mHz. Levato et al. (1996) obtained 2 spectra of the star and found = 85 , a somewhat high value for an Ap star. Additionally, Hubrig et al. (2006) discovered a mean longitudinal magnetic field of G.
HD 132322, mag, is the second brightest star in our sample and the individual spectra have well above 100. A total of 111 spectra were obtained in 2.03 hr, providing a 66-s time resolution. The spectra appear to show splitting of all lines, such as Ba, Fe and Cr lines, and also of all REEs, such as Nd and Eu ii. Surprisingly, even lines with small Landé factors are double (Fig. 10) which would indicate a spotted surface distribution rather than splitting of lines by a magnetic field. It is, however, improbable that all elements, in particular Fe, are split due to a spotted surface. In the course of the 2 hr of observations, we do not find any systematic change in the radial velocity difference of the components, nor in their centre of gravity. The estimated rotational broadening is = 25–35 , based on the full double profiles, and from the quadratic magnetic field analysis, which together with the peculiarity results in considerable blending. Lines of Pr are not very strong but may also be double. The otherwise useful lines of Ce ii are absent. For some roAp stars this ion has the highest pulsation amplitude, such as for CrB (Kurtz, Elkin & Mathys 2007). The Na d doublet is strong with a broad and a sharp (interstellar) component.
Radial velocity shifts measured for 34 stellar lines put an upper limit of 24 ( ) to rapid pulsation when combining all lines (Fig. 24). The core of H is stable to 59 ( , Table 4). All amplitude spectra are flat, except for that of combined Cr ii which has a non-significant peak at 1.31 mHz. The cross-correlation analysis (see, e.g., Fig. 11) shows flat amplitude spectra down to amplitudes of without any significant peaks.
Using 14 iron lines, the mean quadratic field could only be constrained to a maximum intensity of kG. This weak constraint results from the fact that, because of the considerable broadening and distortion of the spectral lines, only a small number of them could be identified as sufficiently free from blends to be used in the analysis. Indeed many of the lines, including those that are magnetically insensitive, show double structures, which typically consist of a component separated from a redder and per cent weaker component (in equivalent width). The FWHM of the weaker component is per cent less than for the other. This pattern is similar for lines of REEs, Cr and Fe (cf. Figs. 20 and Fig. 10). A comparison of the profile to a synthetic spectrum, shifted in wavelength corresponding to the separation in the double structures, firmly excludes a secondary spectrum of a star of comparable brightness as it would have introduced a strong asymmetry. New high-resolution spectra are required to understand these double structures.
HD 132322 is a magnetic Ap star with projected rotation velocity = 34 . All lines, even those of REEs, are double except for . This can partly, but not fully, be explained by abundance spots or a secondary spectrum. Pulsations are excluded down to 37 ( ) for all Nd and Pr lines combined, and 6 ( ) for cross-correlations.


3.6 HD 151301
The star is classified Ap SrCrEu by Houk & Cowley (1975). Martinez (1993) observed it on 6 nights for hr each, and excluded pulsations down to mmag for frequencies above 0.5 mHz.
We obtained 111 UVES spectra in 1.95 hr at a time resolution of 63 s. The lines of REEs are strong (Nd, Pr, Eu) and many are double (see also Fig. 2) indicating abundance spots. The Na d lines have a stellar component and a sharp, strong, interstellar line at longer wavelength. The photometric temperature is K and the spectroscopy provides an upper limit K for . With the astrometric luminosity of the star, this agrees with HD 151301 being more than halfway through its main sequence lifetime.
Radial velocity shifts of 39 stellar lines were measured (Table 4). Lines of Pr ii, Ce ii and Nd ii are weak with considerable scatter in their radial-velocity series. When combining all 39 lines, we find an upper limit on rapid pulsation of 18 ( ), while the core of is stable to 54 ( ). Each double component of the two strongest Eu ii lines was measured and the combined amplitude spectrum (Panel ‘EuII’, Fig. 25) shows a significant () peak at 2.22 mHz. It is equally significant for the individual Eu ii lines and when combining three available Eu ii lines. No other line or combination of lines confirm this peak, including a few weak lines of La ii and Ce ii added to the analysis. Even cross-correlation of the whole Eu ii profiles did not recover the 2.22 mHz frequency and it is therefore considered a probable, but unconfirmed detection. The spectrum of HD 151301 is rich in lines, and the cross-correlations reach a low noise level (Table 4), in particular in the bluer spectrum below the 6000 Å gap (1.4 , Fig. 12). The spectrum region above the 6000 Å gap results in considerably larger noise ( ) but also excludes significant rapid pulsations. The rotational broadening is . Some Fe i and Fe ii lines show additional broadening or asymmetric profiles. An upper limit of the mean quadratic field is found to kG, using 18 Fe lines. SYNTHMAG fitting to Cr ii 5313.56, Fe i 6137.69 and Fe i 5266.55 rejects magnetic fields stronger than 2 kG. However, from line-width measurements of magnetic broadening of 13 Fe lines, a weak, possibly insignificant relation () indicates kG.
HD 151301 is a strongly chemically peculiar star possibly having a magnetic field of up to 2 kG. The surface distribution of REEs is spotted. No pulsations are seen down to amplitudes of 24 ( ) for all Nd and Pr lines combined, and 5.4 ( ) for cross-correlations.


3.7 HD 170565
Martinez (1993) observed this star on 5 nights. In general, no pulsations are seen down to 0.7 mmag for frequencies above 0.5 mHz. However, the last two nights show two peaks around 1.7 and 2.6 mHz at times the noise. The first of these is also present on the first and most intensively observed night. Kudryavtsev et al. (2006) detected a magnetic field in this star with a mean longitudinal field of kG.
We obtained 85 spectra of the star in 2.50 h with a time resolution of 106 s. The star is highly peculiar and has = 18 . There are many strong REE lines, such as those of Eu ii, Ce ii and Nd that are all double, indicating abundance spots. Pr ii is less strong, but also double. As a result line-blending is considerable. Radial velocity shifts of 41 stellar lines were measured and reject pulsations down to 32 ( ) when combining all lines (Fig. 26 and Table 4). The core of shows stability to 75 ( ). There are no confirmed significant peaks in periodograms for any combination of radial velocity series. Cross-correlations show stability down to (Table 5 and Fig. 13). Only the Å region shows a significant (4.2 ) peak at 2.59 mHz (the same as the second ‘transient’ photometric period). No other line measurements or cross-correlations support this unconfirmed detection. Cr is double or broadened while Fe is broadened in several cases. Magnetic measurements were tried with three methods: mean quadratic field measurements, SYNTHMAG fitting to 4 Cr and Fe lines, and from widths of 22 Fe lines. However, due to the rotation, line blending, and a possible inhomogeneous stellar surface distribution of iron, it is not possible to constrain the known magnetic field with these data.
This star is a known magnetic star which is consistent with the present data. It is a chemically peculiar Ap star with a spotted surface distribution of Cr and REEs, and is pulsationally stable down to 32 ( ) for all Nd and Pr lines combined, and 10 ( ) for cross-correlations.


3.8 HD 197417
The classification for this object is Ap CrEu(Sr) (Houk & Cowley, 1975), and the star has been investigated earlier due to its chemical peculiarities and photometric variability associated with its rotation period. Martinez (1993) observed the star on two nights. The corresponding amplitude spectra are flat and place an upper limit of 0.6 mmag on photometric variability. Floquet et al. (1984) studied this star and found a photometric rotation period of d. With spectra obtained at 12 Å mm-1 dispersion, they used Balmer and Ca ii lines to determine K and , and from Mg ii 4481 Å they measured = 23. A strong variability was noticed in the intensity and profile of Ca ii 3922.6 Å and by assuming an oblique rotator geometry and a spotted surface distribution of elements, they proposed an inclination of ∘(angle of the stellar rotation axis to the line of sight) and that Ca ii, Eu ii and Sr ii in particular seemed located in a common spot. From 156 Hipparcos measurements we do not find this period significant, but cannot reject it based on the noisier Hipparcos data alone. Based on 4 spectra, Levato et al. (1996) listed the star as probably single (25 per cent chance for random velocity distribution). Paunzen et al. (2005) list the star as a confirmed chemically peculiar star with and .


HD 197417 has the second-highest (0.015) of our sample, and the 125 UVES spectra, obtained in 2.20 h at 63-s time resolution, show weak lines of REEs; Pr ii, Pr iii and, e.g., Nd iii 6550.32, 6145.07 and 6327.24 Å are almost absent ( per cent below the continuum). Both Eu ii 6437.68 and 6645.06 Å lines are weak (less than 5 per cent below the continuum). Some REE lines are partially split, e.g. Pr iii 6866.80, Eu ii 6437.64 and Eu ii 6645.06 Å, which may indicate that the stellar surface is spotted. This may in combination with the rotation = 25.5 partly explain the weak REE lines of this Ap star. Lines of Co i, Fe ii and La ii are strong, while a weak Ca i supports the high photometric temperature, K. Ce ii is absent. The Na d lines have a stellar component and a sharper interstellar component at longer wavelengths.
Radial velocity shifts of 33 stellar lines were measured (Table 4 and Fig. 27). The noise is considerable due to the low peculiarities and line blending due to rotational broadening, but the radial-velocity series for the core of alone, or all 33 lines combined, exclude rapid pulsation to 48 (). Cross-correlations result in flat amplitude spectra down to (see, e.g., Fig. 14). Magnetically sensitive lines, such as Cr ii 5116.04, Fe ii 6149.25, and Fe i 6232.64 Å, are not magnetically resolved. Comparison of 8 Fe and Cr lines with magnetically broadened SYNTHMAG profiles, and also an attempt to measure the mean quadratic field using 20 lines, exclude magnetic fields above kG. Due to considerable line blending, smaller fields cannot be quantified without polarimetric measurements.
HD 197417 does not appear to have strong REE abundances in the wavelength regions we cover. This may, however, be an effect from a spotted surface distribution of REEs and rotational broadening. The existence of an inhomogeneous surface distribution of REEs is supported by the star’s known (rotational) photometric period and the many double REE lines. A spotted surface on Ap stars can often be related to presence of a magnetic field, for which we in this case put an upper limit at 2 kG. The star is stable to 65 ( ) for all Nd and Pr lines combined, and 5 ( ) for cross-correlations. The significant rotation = 25.5 does, combined with blending from the many double lines, limit the lines available for analysis.
3.9 HD 204367
The Michigan Spectral Catalogue lists the star as A(p SrEuCr) and notes that it is either a weak Ap star, or a normal star of spectral type A0IV/Vs. Supposedly due to this, Martinez (1993) did not make any time series photometry of this object. The star has the highest (0.020 mag) and index in our sample. Because HD 204367 is one of the least evolved of the studied stars (Fig. 1), the high indices rather indicate a less peculiar spectrum rather than a higher luminosity. Manfroid et al. (1998) obtained 21 measurements (one per night) in the Geneva photometric system of this Ap candidate and found no variability (mmag level) over a 23-night run. With 90 Hipparcos measurements, we find the star stable to 6.5 mmag for periods longer than a day.
We obtained 111 spectra of this moderate rotator ( = 10.8 ) in 1.96 hr at a time resolution of 64 s. The spectra revealed the least chemically peculiar star in this study, with considerably fewer lines and longer continuum windows than any of the other stars. Lines of Nd, Pr, Ce and Cr are either absent or much weaker than in the other studied stars. The absorption of Eu ii is in all cases less than 2 per cent below the continuum and only a few REE lines could be used in the velocity analysis. Lines of Ni, Si, S, Na, Ba and Zn are strong.


Radial velocity shifts of 38 stellar lines were measured. The noise is considerable, but when combining all lines (Fig. 28), we can exclude rapid pulsation with amplitudes above 36 ( ), and 46 ( ) for the line core alone (Table 4). There are no significant peaks in the periodograms. Cross-correlations produce similar ‘flat’ amplitude spectra (Table 5 and Fig. 15). An upper limit of the mean quadratic field is found with 27 Fe lines to kG, while SYNTHMAG models compared to 16 Cr and Fe lines gave an upper limit of kG. Further, line width measurements of 33 iron lines showed a weak relation (Fig. 16) that would indicate a rather weak field of kG (1 error). This fit is, however, barely significant as a significance test only gave while is required. Polarimetry is therefore needed for verification.

This star shows no detectable periodic variability down to 72 ( ) for all Nd and Pr lines combined, and 5 ( ) for cross-correlations. Rotation is slow ( = 10.8 ), the spectrum is nearly devoid of REEs, and the star may have a small magnetic field of 0.8 kG.
3.10 HD 208217
This known magnetic and peculiar star, classified as Ap SrEuCr, A1 (Houk & Cowley, 1975) has been previously examined in several studies. Martinez (1993) spent nearly 13 h on the star on 8 separate nights. With it is strongly peculiar. The high-speed photometry excludes periodicities above 0.4 mmag (frequencies above 0.8 mHz) and 0.8 mmag (frequencies above 0.5 mHz). With spectroscopic observations, Mathys et al. (1997) detected a mean magnetic field modulus varying with a semi-amplitude of nearly 1000 G about a mean value of 7958 G ( G) over a rotation period of 8.44475 d (Manfroid et al., 1997). For this period, the epoch of our spectroscopic observations occurs near a negative extremum of the longitudinal field (Mathys, unpublished observations). For roAp stars, maximum pulsation amplitude occurs when one of the stellar magnetic poles come into sight. In this case the negative magnetic pole, and our chances for detecting roAp pulsations should therefore be optimal. Mathys et al. furthermore found the star to be a single-lined binary with a most likely orbital period of at least 2 yr.


With a typical of 150 per spectrum, this set of 138 UVES spectra obtained in 2.52 h with a 66-s time resolution has the highest quality of this study. The spectra show strong lines of Nd, Pr and Eu ii, while Ca i is weak which could indicate a higher temperature than the K from photometry, but the wings of agree well with models for in the range K. Lines of REEs such as Nd ii 6549.52 are mostly single; Eu ii 6437.64 Å is double while the single Eu ii 6437.64 appears broadened. The lines of Ce ii are absent.
Radial velocity shifts of 52 lines were measured (Table 4) and show for all lines combined no rapid oscillations above 14 ( ). The core of is stable to 40 ( ). However, lines of Pr iii and Eu ii show peaks of and respectively but for different frequencies and are rejected. The cross-correlations produce flat amplitude spectra reaching the lowest noise level in this study: the integrated radial-velocity noise is only and no peaks appear above . Lines of REEs are in general single, however Eu ii 6437.64 is broadened while Eu ii 6437.64 is double. Also Fe ii 6149.25 and Fe ii 6432.68 Å are double, and iron lines are generally broadened, consistently with the strong magnetic field known for this star. The rotation is low ( = 10.8 ), but the spectrum is distorted by the magnetic field and blends from the abundant peculiar elements, so line identification and analysis is complicated. Using 16 Fe lines, the mean quadratic field is found to kG. With SYNTHMAG fitting of 17 lines of different Landé factors (see examples in Fig. 18) the field strength is found to be kG, while the Zeeman splitting of Fe ii 6149.25 and Cr ii 5318 Å gives a magnetic field modulus of kG.
Summarising, this star has strongly peculiar REE abundances, a (known) strong magnetic field of kG and is stable to 15 ( ) for all Nd and Pr lines combined, and 3 ( ) for cross-correlations.
4 Discussion
The class of roAp stars is notoriously difficult to supplement with new members, as demonstrated by several photometric and spectroscopic studies before this one. But motivated by the recent discovery of the luminous roAp star HD 116114 (Elkin et al., 2005), we have spectroscopically tested a sample of 9 luminous Ap stars for rapid pulsations. Using lines known to show pulsations in roAp stars, we reach typical upper amplitude limits in radial velocity of: ( ) for the line core of , ( ) when combining all measured Nd and Pr lines, and ( ) when combining all measured lines. With cross-correlations, using large wavelength regions, we typically reach upper amplitude limits of ( ). In spite of a clear theoretical prediction (Cunha, 2002) and empirical (HD 116114) evidence for roAp pulsations in this part of the Hertzsprung–Russell diagram, we end up with 9 null-results, or noAp stars. A number of questions are therefore pertinent to discuss.
How well does our test sample resemble known roAp stars?
All studied stars have strong REE lines, except for HD 204367 and possibly also HD 197417. They have the core-wing anomaly typical for roAp stars, and Hipparcos luminosities with our temperature estimates place them inside the predicted roAp instability strip. Several appear to have spotted surface distributions of REEs (such as HD 170565, HD 151301, HD 132322 and perhaps also HD 197417) which is typically associated with the strong magnetic fields common in known roAp stars. Indeed most of the stars are magnetic, and cover a range in magnetic field strengths of kG, comparable to that of known roAp stars (Kurtz et al., 2006b). In the case of the sharp-lined HD 110072, we compared its spectrum in detail with those of two known roAp stars, and found remarkable similarities for the REEs. However, HD 110072 and HD 208217 are double-lined and single-lined binaries, respectively, which might indirectly influence their stability to high-frequency pulsations by reducing the magnetic field intensity (see Cunha 2002 and references therein). Still, the orbits are probably too wide in both cases for tidal interaction to occur and HD 208217 has a known strong magnetic field ( kG). The known roAp stars have cases of wide binaries, such as CrB (spectroscopic binary), HR 3831, Cir, Equ and HD 99563 (visual binaries). In these regards, the studied sample has the characteristics of roAp stars.
Could pulsations have been overlooked?
Kurtz et al. (2006b) published radial velocity amplitudes for the cores of 16 roAp stars. Of these, only 3 have amplitudes below 75 (HD 116114, HD 154708 and HD 166473, of which two have amplitudes above 3 ), while the rest range from . Further, radial velocity series for Pr and Nd line measurements in UVES spectra of these 16 roAp stars (Kurtz et al., partly unpublished), show that about 75 per cent of the measured and significant (3 ) amplitudes are within the range . Five of these stars have very small Nd and Pr amplitudes ( ): HD 166473, HD 116114, CrB, 33 Lib and HD 154708. In such difficult cases, other lines or combinations of several lines makes detection of pulsations possible. We successfully tested our procedures on the two latter roAp stars in Sect. 3.1.3, and also used combinations of several lines, including of different elements. More of the other 19 known roAp stars have low amplitudes, such as 10 Aql, but our tests and analyses show that we reach these amplitude levels and should have detected such rapid pulsations if present in the studied sample.
A complication for our analyses is typical combined with double lines due to either spots on the stellar surface and/or magnetic splitting, which results in considerable line blending and makes line identification and analysis more difficult. However, our radial-velocity analysis was based partly on cross-correlations that are more robust than line measurements (as shown by our tests for two roAp stars) and this method similarly results in flat amplitude spectra that exclude rapid oscillations to relatively small roAp-amplitude levels. It also seems improbable that, e.g., unfavourable viewing angles of the global pulsations or short mode lifetimes could explain a momentary lapse of detectable pulsation amplitudes simultaneously in all nine stars. In fact, we know independently that HD 208217 was observed near its magnetic negative extremum where roAp pulsations are expected to have maximum amplitudes. Future surveys like this one may benefit from being repeated at different rotation phases. We also note that the near-normal REE abundances of HD 197417 and HD 204367 reduce the probability that they are roAp stars, given the strong peculiarity of all known roAp stars.
Do these stars really not pulsate?
In pulsators such as roAp stars oscillations are intrinsically unstable. Their excitation depends on the balance between the driving and damping of the oscillations over each pulsation cycle. In roAp stars this balance is thought to be particularly delicate. On one hand, the amount of energy input through the opacity mechanism acting on the hydrogen ionisation region depends strongly on the interaction between the magnetic field and envelope convection, being maximal in the regions where envelope convection is suppressed (Balmforth et al., 2001; Cunha, 2002). On the other hand, the direct effect of the magnetic field on pulsations can introduce significant energy losses, through slow Alfvén waves in the interior and through acoustic waves in the atmosphere, both resulting from mode conversion in the magnetic boundary layer (Cunha & Gough, 2000; Saio, 2005). Due to this delicate balance, it is not too surprising that roAp and noAp stars occupy the same locus in the HR diagram. Despite the developments in theoretical studies of linear non-adiabatic pulsations in models of roAp stars, we still lack a theoretical study that takes into account all these phenomena simultaneously and, thus, cannot firmly predict the conditions under which pulsations should be expected in roAp stars. In fact, both studies of Cunha (2002) and Saio (2005) considered the extreme case in which envelope convection is fully suppressed. Moreover, the first of these studies did not consider the direct effect of the magnetic field on pulsations and neglected the energy losses as a result of mode conversion, and the second study, while considering mode conversion, assumed the waves are fully reflected at the surface, hence neglecting energy losses through acoustic running waves in the atmosphere.
As discussed by Cunha (2002), the condition for suppression of envelope convection, which seems necessary to make the high frequency modes unstable, is in principle harder to fulfil in evolved stars due to the increase with age of the absolute value of the buoyancy frequency in the region where hydrogen is ionised. Hence, it is likely that in evolved stars oscillations are excited only if the magnetic field is relatively strong. Unfortunately, the complexity of the interaction between magnetic field and convection makes it impossible to derive a global convective stability criterion, even if local criteria for convective stability may be established (Gough & Tayler, 1966; Moss & Tayler, 1969) (see also Theado et al., 2005, for an extensive discussion on this subject). Thus, the magnetic intensity needed to suppress convection at a given age, for a given mass, is very hard to establish. The more evolved roAp star HD 116114, in which a relatively low frequency oscillation was found well in agreement with theoretical predictions, has a magnetic field modulus of kG. In contrast with this, most stars in our sample have estimated mean magnetic field moduli around or below 2 kG. The clear exceptions are HD 107107, HD 131750 and HD 208217. Of these three, the latter is clearly an important test case to check the theoretical predictions. It has the strongest confirmed magnetic field in our sample and is strongly peculiar. However, we observed HD 208217 when one of its magnetic poles were almost visible, so pulsation should have been near its maximum amplitude.
From the observational point of view, one way to investigate the conditions under which roAp star oscillations are excited, and thus test theoretical models, is by identifying systematic differences between roAp and noAp stars. This study would have been able to detect pulsations in all the known roAp stars, and any missed rapid pulsations must have amplitudes lower than these. Hence we conclude that based on the obtained data, most stars in our sample are indeed noAp stars, and also excellent roAp candidates. Despite this conclusion, it is premature to state that we can confirm the evidence that noAp stars are in average more luminous and more evolved than roAp stars, as indicated by earlier studies based on photometric surveys for pulsations in roAp candidates (North et al., 1997; Handler & Paunzen, 1999; Hubrig et al., 2000). To conclude that, we would also need to search for rapid pulsations in a control group of less evolved roAp stars with lower luminosity and compare the frequency of null-results in the two cases. Such a survey has been started and results are expected in the near future. The next step is to analyse the noAp stellar atmospheres in detail, taking temperature gradients and the abundance stratification into account.
New spectra are needed of HD 132322 to clarify the origin of its double line structures, and of HD 110072 to verify its secondary spectrum and to test for the ‘spurious’ absorption lines in the recent FEROS spectrum. Polarimetry of HD 110072 and HD 204367 is needed to confirm the detected magnetic fields.
Acknowledgments
LMF, DWK, JDR and VGE acknowledge support for this work from the Particle Physics and Astronomy Research Council (PPARC). MSC is supported by by the EC’s FP6, FCT and FEDER (POCI2010) through the HELAS international collaboration and through the project POCI/CTE-AST/57610/2004FCT-Portugal. LMF received support from the Danish National Science Research Council through the project “Stellar structure and evolution: new challenges from ground and space observations” carried out at Aarhus University and Copenhagen University. We acknowledge resources provided by the electronic data bases (VALD, VizieR, SIMBAD, NASA’s ADS)
References
- Amado et al. (2004) Amado P. J., Moya A., Suárez J. C., Martín-Ruíz S. et al. 2004, MNRAS, 352L, 11
- Ashoka et al. (2000) Ashoka B. N., Seetha S., Raj E., Chaubey U. S. et al., 2000, BASI, 28, 251
- Babcock (1958) Babcock H. W., 1958, ApJ, 128, 228
- Balmforth et al. (2001) Balmforth N. J., Cunha M. S., Dolez N., Gough D. O., Vauclair S., 2001, MNRAS, 323, 362
- Bouchy et al. (2004) Bouchy F., Lovis C., Mayor M., Pepe F., Queloz D., Udry S., Melo C., Santos N., 2004, ASPC, 321, 15
- Breger et al. (1993) Breger M., Stich J., Garrido R., Martin B., Jiang S. Y. et al. 1993, A&A, 271, 482
- Burstein & Heiles (1982) Burstein, D., Heiles, C., 1982, AJ, 87, 1165
- Bychkov, Bychkova, & Madej (2003) Bychkov V. D., Bychkova L. V., Madej J., 2003, A&A, 407, 631
- Castelli & Kurucz (2003) Castelli F., Kurucz, R. L., 2003, IAUS, 210, A20C
- Christensen-Dalsgaard (1993) Christensen-Dalsgaard J., 1993, in Baglin A., Weiss W. W., eds, ASP Conf. Ser. Vol. 40, Proc. IAU Coll. 137, Inside the stars. ASP, San Francisco, 483
- Cowley et al. (2001) Cowley C. R., Hubrig S., Ryabchikova T. A., Mathys G. et al. 2001, A&A, 367, 939
- Crawford (1979) Crawford D. L., 1979, AJ, 84, 1858
- Cunha (2002) Cunha M. S., 2002, MNRAS, 333, 47
- Cunha (2006) Cunha M. S., 2006, MNRAS, 365, 153
- Cunha & Gough (2000) Cunha M. S., Gough, D. O., 2000, MNRAS, 319, 1020
- Deeming (1975) Deeming, T. J. 1975, Ap&SS 36, 137
- Dorokhova & Dorokhov (2005) Dorokhova T., Dorokhov N., 2005, JApA, 26, 223
- Dziembowski & Goode (1996) Dziembowski W. A., Goode P. R. 1996, ApJ, 458, 338
- Elkin, Kurtz, & Mathys (2005) Elkin V. G., Kurtz D. W., Mathys G., 2005, MNRAS, 364, 864
- Elkin et al. (2005) Elkin V. G., Riley J. D., Cunha M. S., Kurtz D. W., Mathys G. 2005, MNRAS, 358, 665
- ESA (1997) ESA 1997, The Hipparcos and Tycho Catalogues. ESA SP-1200
- Flower (1996) Flower, B. J., 1996, ApJ, 469, 355
- Floquet et al. (1984) Floquet M., Chauville J., Gerbaldi M., Faraggiana, R. et al. 1984, A&A, 131, 215
- Gough & Tayler (1966) Gough, D.O., Tayler, R.J., 1966, MNRAS 133, 85
- Griffin & Griffin (1973) Griffin R. and Griffin R., 1973, MNRAS, 162, 255
- Handler (2004) Handler G., 2004, Commun. Asteroseismol., 145, 71
- Handler & Paunzen (1999) Handler G., Paunzen E., 1999, A&AS, 135, 57
- Houk & Cowley (1975) Houk N., Cowley A.P., 1975, University of Michigan Catalogue of Two-Dimensional Spectral Types for the HD Stars, Vol. 1, Univ. of Michigan,
- Hubrig et al. (2000) Hubrig S., Kharchenko N., Mathys G. & North P., 2000, A&A, 355, 1031
- Hubrig et al. (2005) Hubrig S., Nesvacil N., Schöller M. et al., 2005, A&A, 440, L37
- Hubrig et al. (2006) Hubrig S., North P., Schöller M., Mathys G., 2006, Astr.Nachr, 327, 289
- Joshi et al. (2006) Joshi S., Mary D. L., Martinez P., Kurtz D. W. et al. 2006, A&A, 455, 303
- Kudryavtsev et al. (2006) Kudryavtsev D. O., Romanyuk I. I., Elkin V. G., Paunzen E., 2006, MNRAS, 372, 1804
- Kupka et al. (1999) Kupka F., Piskunov N., Ryabchikova T. A. et al., 1999, A&AS, 138, 119 (http://www.astro.uu.se/vald/)
- Kurtz (1982) Kurtz D. W., 1982, MNRAS, 200, 807
- Kurtz (1985) Kurtz D. W., 1985, MNRAS, 213, 773
- Kurtz et al. (2006b) Kurtz D. W., Elkin V. G., Cunha M. S., Mathys G. et al. 2006, MNRAS, 372, 286
- Kurtz et al. (2005) Kurtz D. W., Elkin V. G. and Mathys G., 2005, MNRAS 358, L6
- Kurtz et al. (2006a) Kurtz D. W., Elkin V. G., Mathys G., 2006, MNRAS, 370, 1274
- Kurtz, Elkin, & Mathys (2007) Kurtz D. W., Elkin V. G., Mathys G., 2007, MNRAS, 380, 741
- Kuschnig et al. (1997) Kuschnig R., Weiss W. W., Gruber R., Bely, P. Y. et al., 1997, A&A, 328, 544K
- Lenz & Breger (2005) Lenz P., Breger M., 2005, Communications of Asteroseismology, 146, 53
- Levato et al. (1996) Levato H., Malaroda S., Morrell, N., Solivella, G. et al. 1996, A&AS, 118, 231L,
- Lutz & Kelker (1973) Lutz T. E., Kelker D. H. 1973, PASP, 85, 573
- Manfroid et al. (1998) Manfroid J., Burnet M. & Renson P. 1998, A&AS, 127, 201
- Manfroid et al. (1997) Manfroid J., Mathys G. 1997, A&A, 320, 497
- Martinez (1993) Martinez P., 1993, Univ. of Cape Town, PhD thesis
- Martinez & Kurtz (1994) Martinez, P., & Kurtz D. W., 1994, MNRAS, 271, 129
- Mathys (1989) Mathys G., 1989, Fundam. Cosmic Phys., 13, 143
- Mathys & Hubrig (2006) Mathys G., Hubrig S., 2006, A&A, 453, 699
- Mathys et al. (1997) Mathys G., Hubrig S., Landstreet J.D., Lanz T., Manfroid J., 1997, A&AS, 123, 353
- Moon & Dworetsky (1985) Moon T.T. & Dworetsky M.M., 1985, MNRAS, 217, 305
- Moss & Tayler (1969) Moss, D.L., Tayler, R.J., 1969, MNRAS 145, 217
- Nelson & Kreidl (1993) Nelson M. J., & Kreidl T. J. 1993, AJ, 105, 1903
- North et al. (1997) North, P., Jaschek, C., Hauck, B., Figueras, F., Torra, J. & Kunzli, M., 1997, Hipparcos-Venice 97, Venice, ESA SP-402, 239
- Paunzen et al. (2005) Paunzen E., Stütz Ch., Maitzen H. M., 2005, A&A, 441, 631
- Piskunov (1992) Piskunov N. E., 1992, Stellar Magnetizm, ed. Yu. V. Glagolevsky, & I. I. Romanjuk (St. Petersburg, Nauka), 92
- Piskunov (1999) Piskunov N. E., 1999, in 2nd International Workshop Kluwer Acad. Publ. ASSL, 243, 515
- Preston (1971) Preston G. W., 1971, ApJ, 164, 309
- Ryabchikova et al. (2004) Ryabchikova T., Nesvacil N., Weiss W. W., Kochukhov O., Stütz C., 2004, A&A, 423, 705
- Ryabchikova et al. (2007) Ryabchikova T., Sachkov M., Weiss W. W., Kallinger T. et al., 2007, A&A, 462, 1103
- Saio (2005) Saio H., 2005, MNRAS, 360, 1022
- SAO Staff (1966) Smithsonian Astrophysical Observatory Star Catalog J2000
- Strohmeier, Fischer, & Ott (1966) Strohmeier W., Fischer H., Ott H., 1966, IBVS, 120, 1
- Tiwari, Chaubey, & Pandey (2007) Tiwari S. K., Chaubey U. S., Pandey C. P., 2007, IBVS, 5787, 1
- Theado et al. (2005) Théado, S., Vauclair, S., Cunha, M. S.,2005, A&A, 443,627
- Tonry & Davis (1979) Tonry J., Davis M., 1979, AJ, 84, 1511
- Weiss et al. (2000) Weiss W. W., Ryabchikova T. A., Kupka F., Lueftinger T. R., Savanov I. S., Malanushenko V. P., 2000, ASPC, 203, 487
Appendix A Supplementary material
A.1 Additional tables
| H | 0.91 | He | -1.05 | Li | -10.88 | Be | -10.89 | B | -9.44 |
| C | -3.48 | N | -3.99 | O | -3.61 | F | -7.48 | Ne | -3.95 |
| Na | -5.71 | Mg | -4.46 | Al | -5.57 | Si | -4.89 | P | -6.59 |
| S | -4.83 | Cl | -6.54 | Ar | -5.48 | K | -6.82 | Ca | -5.88 |
| Sc | -8.94 | Ti | -6.50 | V | -8.04 | Cr | -3.57 | Mn | -6.65 |
| Fe | -3.57 | Co | -5.52 | Ni | -5.59 | Cu | -7.83 | Zn | -7.84 |
| Ga | -9.16 | Ge | -8.63 | As | -9.67 | Se | -8.69 | Br | -9.41 |
| Kr | -8.81 | Rb | -9.44 | Sr | -9.14 | Y | -9.80 | Zr | -9.54 |
| Nb | -9.62 | Mo | -9.12 | Tc | -20.00 | Ru | -9.20 | Rh | -9.92 |
| Pd | -9.35 | Ag | -11.10 | Cd | -9.18 | In | -9.58 | Sn | -9.04 |
| Sb | -11.04 | Te | -9.80 | I | -10.53 | Xe | -9.81 | Cs | -9.92 |
| Ba | -8.91 | La | -9.82 | Ce | -10.49 | Pr | -8.83 | Nd | -8.94 |
| Pm | -20.00 | Sm | -10.04 | Eu | -9.93 | Gd | -10.92 | Tb | -9.94 |
| Dy | -9.34 | Ho | -11.78 | Er | -9.01 | Tm | -12.04 | Yb | -10.06 |
| Lu | -10.28 | Hf | -9.16 | Ta | -11.91 | W | -10.93 | Re | -11.77 |
| Os | -10.59 | Ir | -10.69 | Pt | -10.24 | Au | -11.03 | Hg | -10.95 |
| Tl | -11.14 | Pb | -10.19 | Bi | -11.33 | Po | -19.00 | At | -19.00 |
| Rn | -19.00 | Fr | -19.00 | Ra | -19.00 | Ac | -19.00 | Th | -10.92 |
| Pa | -19.00 | U | -10.51 | Np | -19.00 | Pu | -19.00 | Am | -19.00 |
| Cm | -19.00 | Bk | -19.00 | Cf | -19.00 | Es | -19.00 |

A.3 Amplitude spectra for combined line measurements
These figures show star-by-star amplitude spectra calculated for combined radial-velocity series for elements as indicated by top labels: ‘all’ indicates all available lines, ‘NdPr’ all lines for neodymium and praseodymium. For centre-of-gravity line measurements. Note that for double lines, both components were measured separately and included. Compare with Table 4.


