The frequency distribution of the height above the Galactic plane for the novae
)
In order to examine the hypothesis of the existence of two different kinds of nova populations in the Galaxy– ’disk’ novae and ’bulge’ novae – the frequency distribution in the z-direction was obtained for 64 novae. The fact that large number of fast novae related to disk novae are found at a significant distance from the Galactic plane (up to pc) can’t result from photometric measurements errors. Slow novae considered to belong to bulge novae show more close concentration to the Galactic plane ( pc). A Kolmogorov-Smirnov test run on the data showed that the two populations hypothesis probability amounts to 95.56%.
PACS: 90.97.30.-b; 90.97.30.Qt; 90.97.80.Gm
Key words: novae, disk novae, bulge novae, spatial distribution
Send offprint requests to M.Burlak, e-mail: mburlak@sai.msu.ru
Hypothesis of the existence of two different kinds of nova populations: disk and bulge novae.
Traditionally the study of novae has been based on the assumption that different kinds of stellar populations have different spatial distributions in the galaxies. This idea has been used to find out what kind of population novae progenitors belong to. The nova population appeared to possess discordant features: by the concentration towards the Galactic center it is similar to Population II objects, but by the concentration towards the Galactic plane it resembles Population I objects. As a result novae have been considered either disk objects or bulge/thick disk objects alternately.
Last years almost every study of the spatial distribution of novae in the Galaxy and in neighbouring star systems have been carried out in terms of the concept proposed by Dürbeck (1990) that assumes the existence of two physically different kinds of nova populations with differing galactic distributions and whose progenitors probably differ from each other in a qualitative sense. Bright and fast novae refer to disk population, slow and faint novae belong to bulge (or thick disk). The differences between the classes of novae account for the different nature of the nova progenitors. Bright and fast novae are believed to be associated with relatively massive white dwarfs () whereas faint and slow novae have less massive progenitors (). From the physical point of view the matter is that the more massive the white dwarf, the smaller the mass of the accreted envelope required to produce a TNR, the more violent the outburst (i.e. higher luminosity and expansion velocities, shorter – the time required to decline by 3 magnitudes from maximum), the larger the mass fraction ejected as a discrete shell, the smaller the mass ejected in the form of subsequent wind.
Della Valle et al.(1992) showed that the nova rate of decline related to the mass of an underlying white dwarf correlates with the nova location in the Galaxy. Using rates of decline and outburst amplitudes for 93 galactic novae Della Valle et al.(1992) found that fast (and bright) novae tend to concentrate towards the direction of galactic anti-center, and slow (and faint) novae are more frequently observed in the direction of the galactic center: disk novae contribute more significantly when counting novae in the direction of the galactic anti-center and bulge novae are more numerous in the opposite direction. Besides, 19 novae with well established distances were used to determine the frequency distribution of the height above the galactic plane which showed that fast novae more closely concentrating to the galactic plane are found mainly at the heights pc. Whereas the concentration of slow novae is not so close and they extend up to pc. From this the classification of novae in two different classes, ’disk’ novae and ’bulge’ novae, follows. Sometimes the latter are referred to by ’thick disk’ novae obviously taking into consideration the fact that bulge is implied to be a more compact system that not expands to the radius where novae are found. However in spite of some discrepancy these objects are more often called bulge novae to emphasize their concentration to the galactic center.
Later Della Valle & Livio (1998) found that there are spectroscopic differences between disk and bulge novae and that the classification of novae based on the galactic distribution nearly coincides (%) with the spectral classification introduced by Williams (1992), i.e. disk novae usually belong to He/N class, whereas bulge novae are among Fe II class members.
The two-nova-populations concept is widely used while the spatial distribution of novae in other galaxies is analyzed. It predicts that in bulge-dominated galaxies the percentage of faint slow novae has to be larger whereas in disk-dominated galaxies bright fast novae are more likely to erupt. So, Shafter & Irby (2001) consider the greater part of novae in M31 to belong to bulge population (up to 70% and not less than 50%). For the Galaxy the upper limit for the percentage of disk novae is thought to be 30% (Della Valle & Dürbeck, 1993).
It’s worth mentioning that the conclusion that classical novae divide into two different classes has been drawn by various authors on considering a little number of well-studied classical novae whose light curves, distances, extinction, spectral evolution are known. Such stars are not numerous. As a rule these ones are close objects for which it became possible to measure the angular expansion of the envelope. Having examined a sample of 27 novae Della Valle & Livio (1998) pointed out the existence of systematic spectroscopic differences between disk novae and bulge novae. 10 of them were classified as He/N novae or hybrid objects with mixed characteristics, and the residuary 17 were ascribed to Fe II class. Della Valle & Livio (1998) applied a Kolmogorov-Smirnov test of the uniformity of two samples to verify the existence of two populations of novae with different z-distributions. Significance level of the assumption appeared to be . Interestingly enough, in earlier paper presented by the same research group (Della Valle et al, 1992) where the z-distribution for only 19 novae was investigated the difference in the distributions was significant at a level higher than 99%.
Single researchers do not confirm the existence of significant difference between two groups of novae with various rates of decline. The overwhelming belonging of novae in M31 to bulge was questioned (Hatano et al, 1997). Sharov (1993) for the sample of 117 novae in M31 demonstrated that it is early to consider the given hypothesis to be proven and that further study is required.
Construction of z-distribution for novae
Present paper is the final part of the research of the galactic novae exploded in 1986-2006. The first and the second stages were described in papers published earlier: Burlak & Henden (2008) where the nova photometric parameters determination with the use of visual light curves is discussed and Burlak (2008) which concerns the calculation of distance and interstellar light extinction for the given objects. The aim of the present study is to analyze the frequency distribution of the height above the Galactic plane for the novae. The calculations carried out in the papers mentioned above yielded distance estimates for 64 galactic novae. The height above the galactic plane was obtained using distance and galactic latitude. In Table 1 the absolute values of z are demonstrated. The estimates taken from Burlak & Henden (2008) are present here too. In order to examine the question of whether the hypothesis of two nova populations holds the stars were divided into two groups according to their rate of decline: the group of fast novae consisted of 17 objects with days, the rest 47 objects constituted the group of slow novae. Given classification doesn’t coincide with the classification of Payne-Gaposchkin (1957), who places objects with days ( is the time it takes a nova to decline by 2 magnitudes from maximum) among fast novae, but fits the contemporary understanding of the nova phenomenon better and therefore makes the comparison with other authors’ results more illustrative.
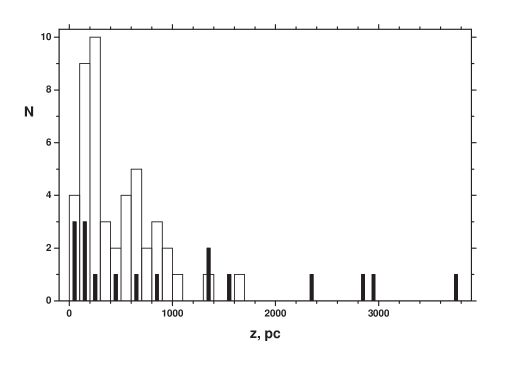
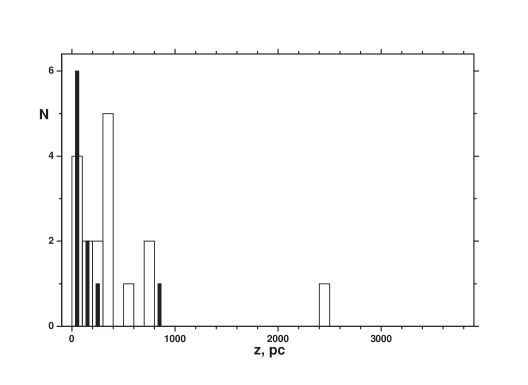
The histogram in Figure 2 presents the frequency distribution for the novae of two samples relative to the height above the galactic plane. Filled area refers to the fast novae, empty area corresponds to the slow novae. For comparison the z-distribution for He/N and Fe II novae obtained by Della Valle & Livio (1998) is presented in Figure 2. Though Della Valle & Livio (1998) plot this histogram to prove the spectroscopic difference between disk and bulge novae the authors conclude that speed classes actually correspond to the spectroscopic classes.
Discussion
One cannot say that the histogram in Figure 2 agrees well with the two-nova-population hypothesis. Fast novae do not concentrate closely to the Galactic plane, only 6 of 17 fast novae are found inside the pc strip, while the rest fast novae are distributed homogeneously enough up to pc. And slow novae concentrate more close to the Galactic plane and are not found at the heights pc. Obtained Z-distribution for slow novae corresponds with the predictions of the discussed hypothesis to a greater extent.
Lets try to find out how the choice of interstellar light extinction made in Burlak (2008) affected the form of histogram. For novae located at pc light extinction and distance values obtained with the maps of Schlegel et al. (1998) were adopted. These maps yield the maximum light extinction in the line of sight. Thus, if nevertheless interstellar extinction for a given nova appears to be smaller than the maximum value then distance for it will be greater than the adopted value. Correspondingly the height above the Galactic plane will turn out to be larger and the star will move to the right on the histogram of z-distribution. So, the possible overestimation of the extinction does not reduce the concentration to the Galactic plane for the fast novae. The question arises then if the extinction obtained with the maps of Sharov (1963) that take into account the increase of interstellar extinction with distance appeared to be underestimated for fast novae. Having compared the sets of distances obtained according to the maps of Sharov (1963) and the maps of Schlegel et al. (1998) one can see that there are only two fast novae for which such a possibility exists, namely V 1494 Aql and V 1187 Sco. But even though to adopt larger distances for both novae they will only move from the range pc to the range pc. The general form of the distribution for the fast novae will not change. As follows from the above the form of z-distribution for the fast novae does not change in a qualitative sense when one set of distances is replaced by the other in spite of significant differences between two sets of distance values obtained with the aid of the interstellar extinction maps derived by Sharov (1963) and by Schlegel et al. (1998).
On the other hand incorrect distance modulus may lead to incorrect distance value. Burlak & Henden (2008) used the empirical relation obtained by Cohen (1985)
to get the absolute maximum magnitude. According to this formula a 20% error in yields absolute magnitude error of that changes distance by only 10%. If there is a detailed light curve for a given fast nova it is unlikely to make a mistake larger than 1 day while estimating and such a mistake will slightly affect the form of z-distribution for fast novae. While estimating for slow novae some uncertainties arise because of the light curve features. In exceptional cases the discrepancy in the estimates of different researchers may rise to hundreds of days. For example for V 723 Cas the following rate of decline values were derived: days (Chochol & Pribulla, 1997), days (Evans et al., 2003), days (Iijima, 2006), days (Burlak & Henden, 2008). If there are no flashes and deep light drops in the light curve then it is possible to estimate and/or with adequate accuracy. One could say that errors in deriving rate of decline do not influence the general form of z-distribution for slow novae.
Underestimating the observed maximum brightness has the most considerable effect on the distance value and therefore on the z-distance value. The missing of the maximum brightness is particularly unwanted in the case of fast novae but exactly fast novae suffer from this more often. In Figure 2 7 fast novae are found at the height pc, namely V 838 Her, V 2295 Oph, DD Cir, V 4332 Sgr, V 4160 Sgr, V 4739 Sgr, V 2487 Oph. Their light curves generated from visual observations of AAVSO members (Burlak & Henden, 2008) do not rule out that the maximum brightness may have been lost. For V 838 Her we managed to find a detailed enough V light curve (Woodward et al., 1992) that yields for the observed magnitude of maximum luminosity for the nova. From the AAVSO light curve the observed maximum magnitude for V 838 Her is equal to . In the case of V 838 Her the AAVSO observers proceeded to monitoring the star one or two days past maximum but as V 838 Her was one of the fastest novae its brightness declined by more than in this period. If to adopt the maximum visual brightness for V 838 Her equal to then the distance and hence z-distance reduce by a factor of 3. Underestimating the nova maximum brightness by even increases the distance by a factor of 1.5. So the omission of maximum light influence strongly the form of z-distribution for fast novae. In the case of slow novae a delay of 1-2 days or even more will hardly affect the maximum light estimate and therefore will not have an impact on the form of spatial distribution.
The omission of maximum not only causes underestimate of the maximum brightness. As fast novae decline not uniformly just after maximum but reduce the rate of decline then if to miss light maximum then the time turns out to be overestimated. Woodward et al. (1992) measured the time for a two-magnitude fading and found days for V 838 Her whereas the AAVSO light curve yields days. Woodward et al. (1992) used the same empirical maximum magnitude - rate of decline relation as Burlak & Henden (2008) and obtained for the absolute magnitude of maximum luminosity (Burlak & Henden (2008) obtained ). Thus if to adopt that AAVSO observers missed the maximum light then Burlak & Henden (2008) have overestimated the observed distance modulus for V 838 Her by since maximum brightness underestimate and overestimate have partially compensated each other. As a result distance for V 838 Her and z-distance as well turn out overestimated by a factor of 1.5 that affects substantially the position of the nova in the histogram in Figure 2. If distance for V 838 Her is reduced by 1.5 times then z-distance turns out to be 850 pc but nevertheless the star does not fall into a thin layer close to the Galactic plane. For the rest 6 stars located higher than 1000 pc above the Galactic plane it is not possible to estimate the accuracy of photometric parameters determination. But all of them being very fast novae are subjected to both of the effects mentioned above. Fortunately one of them increases observed distance modulus and another reduces it, so there is no reason to suppose the distance error caused by observational incompleteness to be large. Assuming distance modulus to be overestimated by for all fast novae will reduce z-distances for them only by a factor of 2.5 but nevertheless the stars will remain in the range pc.
It’s necessary to point out one more effect caused by the omission of maximum light and the overestimate of . For a fast nova with true days overestimate of will change its speed class from the fast one to the slow. There is a large number of slow novae in the range pc. If some of them prove to be fast novae in fact then the form of z-distribution for fast novae may change noticeably in the vicinity of the Galactic plane. But this can’t reduce the number of fast novae at large heights. On the other hand if some of the slow novae at small z-distance turn out fast novae the general form of z-distribution for slow novae will not change.
So, observational uncertainties have little impact on z-distribution for slow novae whereas the characteristics of z-distribution for fast novae depend strongly on photometric parameters estimation accuracy. But photometric measurements errors fail to explain the fact that there is a large number of fast novae far from the Galactic plane.
It’s interesting to note that seven fast novae mentioned above have Galactic latitude larger than . All other fast novae (except very bright V 382 Vel) are located lower than and experience considerable interstellar light extinction. A great amount of fast novae at low Galactic latitudes must remain undetected because of high star density and high column density of interstellar medium close to the Galactic plane. In other words the matter is not that the obtained z-distribution contains too many fast novae at a large height above the Galactic plane but that there are too little of them close to it. This fact in its turn accounts for strongest observational selection.
To make up final conclusion if the obtained results agree with the two-nova-populations hypothesis a Kolmogorov-Smirnov test was performed (Hollander & Wolfe, 1983). It showed the difference in z-distributions to be significant at a level of 95.56% that coincides with the value obtained by Della Valle & Livio (1998) for a sample of 27 novae. But the test just points out non-identity of two samples and says nothing about the distribution laws features and the observational data is not enough to find them out.
Conclusions
-
1.
Z-distribution for Galactic novae exploded after 1986 did not show significant concentration of fast novae to the Galactic plane. On the contrary large part of them (7 of 17) was found higher than 1000 pc above the plane.
-
2.
The z-distribution form for fast novae depends strongly on photometric parameters estimation accuracy. But a large amount of fast novae at a considerable distance from the Galactic plane can’t be accounted for inaccuracy of photometric measurements alone.
-
3.
Relatively small number of fast novae located close to the Galactic plane arises from strong observational selection effect caused by interstellar light extinction.
-
4.
A Kolmogorov-Smirnov test supports the hypothesis of two novae populations with different z-distributions at a significant level of 95.56%.
REFERENCES
-
1.
Burlak, M.A., Henden, A.A. 2008, PAZh, in press
-
2.
Burlak, M.A. 2008, PAZh, in press
-
3.
Chochol, D., Pribulla, T. 1997, Contrib. Astron. Obs. Skalnatè Pleso, 27, 53
-
4.
Cohen, J.G. 1985, ApJ, 292, 90
-
5.
Della Valle, M., Bianchini, A., Livio, M., Orio, M. 1992, A&A, 266, 232
-
6.
Della Valle, M., Dürbeck, H.W. 1993, A&A, 271, 175
-
7.
Della Valle, M., Livio, M. 1998, ApJ, 506, 818
-
8.
Dürbeck, H.W. 1990, in ’The Physics of Classical Novae’, eds. A. Cassatella and R. Viotti (Springer-Verlag Berlin Heidelberg New York)
-
9.
Evans, A., Gehrz, R.D., Geballe, T.R. 2003, AJ, 126, 1981
-
10.
Hatano, K., Branch, D., Fisher, A., Starrfield, S. 1997, ApJ, 487, L45
-
11.
Hollander, M., Wolfe, D.A. 1983, in ’Nonparametric Statistical Methods’ (Moscow: Finances & Statistics)
-
12.
Iijima, T. 2006, A&A, 451, 563
-
13.
Payne-Gaposchkin, C. 1957, in ’The Galactic Novae’, Amsterdam: North-Holland Co
-
14.
Shafter, A.W., Irby, B.K. 2001, ApJ, 563, 749
-
15.
Sharov, A.S. 1963, AZh, 5, 900
-
16.
Sharov, A.S. 1983, PAZh, 19, 18
-
17.
Schlegel, D.J., Finkbeiner, D.P., Davis, M. 1998, ApJ, 500, 525
-
18.
Williams, R.E. 1992, AJ, 104, 725
-
19.
Woodward, C.E., Gehrz, R.D., Jones, T.J., Lawrence, G.F. 1992, ApJ, 384, L41
| Nova | , days | , pc | Nova | , days | , pc |
|---|---|---|---|---|---|
| V 4739 Sgr | 3.5 | 2900 | V 1419 Aql | 33 | 290 |
| V 2361 Cyg | 610 | V 1663 Aql | 34 | 31 | |
| V 838 Her | 8.7 | 1300 | V 2264 Oph | 38 | 670 |
| V 2275 Cyg | 10 | 73 | V 4157 Sgr | 41 | 290 |
| V 4160 Sgr | 10 | 2800 | V 4169 Sgr | 44 | 850 |
| V 2487 Oph | 10 | 3700 | V 5116 Sgr | 45 | 1300 |
| V 4332 Sgr | 10 | 2300 | V 1141 Sco | 46 | 490 |
| V 5115 Sgr | 14 | 820 | V 1186 Sco | 46 | 640 |
| V 4643 Sgr | 14 | 18 | QV Vul | 47 | 270 |
| V 4444 Sgr | 14 | 490 | V 1974 Cyg | 48 | 200 |
| V 382 Vel | 15 | 110 | V 868 Cen | 48 | 130 |
| DD Cir | 15 | 1500 | V 842 Cen | 49 | 51 |
| V 1494 Aql | 16 | 170 | V 2274 Cyg | 50 | 170 |
| V 2295 Oph | 16.3 | 1300 | V 2574 Oph | 640 | |
| V 1187 Sco | 18 | 180 | V 888 Cen | 54 | 240 |
| CP Cru | 18 | 89 | V 475 Sct | 55 | 320 |
| V 4171 Sgr | 20 | 280 | V 4633 Sgr | 62 | 760 |
| V 4743 Sgr | 22 | 1050 | V 827 Her | 64 | 840 |
| V 4742 Sgr | 23 | 170 | V 1039 Cen | 71 | 160 |
| V 2362 Cyg | 23 | 280 | V 2214 Oph | 80 | 670 |
| V 444 Sct | 23 | 950 | V 574 Pup | 85 | 170 |
| V 463 Sct | ¿23 | 1600 | V 4361 Sgr | 86 | 120 |
| V 5114 Sgr | 24 | 930 | V 705 Cas | 96 | 130 |
| V 1142 Sco | 270 | V 2573 Oph | 99 | 500 | |
| V 1493 Aql | 26 | 170 | BY Cir | 101 | 150 |
| V 4741 Sgr | 28 | 530 | V 1425 Aql | 119 | 220 |
| V 1188 Sco | 28 | 220 | V 4642 Sgr | 125 | 240 |
| V 2576 Oph | 29 | 780 | V 443 Sct | 135 | 220 |
| V 4327 Sgr | 30 | 830 | V 351 Pup | 284 | 47 |
| V 4740 Sgr | 30 | 470 | V 2540 Oph | 305 | 570 |
| LZ Mus | 32 | 510 | V 445 Pup | 320 | 92 |
| V 2313 Oph | 32 | 690 | V 723 Cas | 779 | 390 |