Correspondence Between the Phase Diagrams of TIP5P Water
and a Spherically Symmetric Repulsive Ramp Potential
Abstract
We perform molecular dynamics simulations of a well-known water model (the TIP5P pair potential) and a simple liquid model (a two-scale repulsive ramp potential) to compare the regions of anomalous behavior in their phase diagrams. We select the parameters of the ramp potential by mapping it to an effective pair potential derived from the TIP5P model. We find that the regions of anomalous behavior in the phase diagrams of both systems can be mapped onto each other if (i) pressure and temperature are replaced by and , respectively, where are the coordinates of the liquid-liquid critical point of the corresponding system; and (ii) a single ramp particle corresponds to two TIP5P molecules. We present heuristic arguments supporting point (ii). We also argue that the water-like anomalies in the ramp potential are due to the ability of the particles to reproduce, upon compression or heating, the migration of water molecules from the second shell to its first shell.
Liquid water is peculiar as reflected by its thermodynamic and dynamic anomalies pablogene ; jeffrey01 , such as the density decrease upon isobaric cooling (density anomaly) and the increase of diffusivity upon isothermal compression (diffusion anomaly). It has been proposed that these anomalies may arise from a liquid-liquid critical point (LLCP) in the deeply supercooled state of water poole92 . Several other liquids (e.g., silica, silicon, carbon, and phosphorous) with local tetrahedral order angellPCCP ; shell02 ; molinero06 also may show water-like anomalies. These anomalies of water and the LLCP can be reproduced by simple liquids interacting via core-softened spherically symmetric potentials which lack the strong orientational interaction expected in tetrahedral liquids Stell70 ; cho96 ; stillinger97 ; sadr98 ; Jagla99 ; predp05 ; wilding02 ; xu06 ; zyan ; sharma06 ; olive06 ; errington06 .
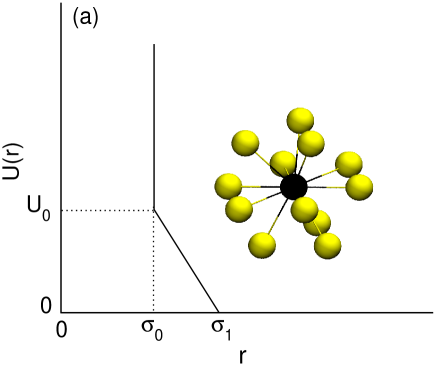
Water also possesses structural anomalies which occur when metrics describing both translational and orientational order decrease upon compression, as found in both the SPC/E and TIP5P water models jeffrey01 ; zyan2007 . Water’s structural anomaly is also reproduced by a family of core-softened spherically symmetric potentials possessing two characteristic length scales and (see the ramp potential in Fig. 1(a)) zyan . In order to exhibit a water-like structural anomaly, the ratio must lie within a small interval around 0.62, the ratio of the distances to water’s first and second neighbor shells, nm/ nmzyan .
A quantitative connection between the ramp potential and water’s pair potential has not been established, as well as the relation between the regions of anomalies in their respective phase diagrams. In this work, we show that the effective pair potential derived from the TIP5P water model tip5p can be approximated by a two-scale spherically symmetric repulsive ramp potential, allowing us to assign physical units to the temperature and pressure of the ramp model. We perform molecular dynamics simulations using both the TIP5P and ramp potentials and compare the regions of anomalies in the corresponding phase diagrams. We find that the regions of anomalies in both phase diagrams are quantitatively similar if (i) pressure and temperature are measured in terms of and , respectively, where are the coordinates of the liquid-liquid critical point of the corresponding system; and (ii) a ramp particle corresponds to two TIP5P molecules. We present quantitative arguments supporting point (ii) and provide a simple picture to explain the similarities observed in the TIP5P and ramp potentials. A ramp liquid particle corresponds effectively to two water molecules, one molecule plus of each of its four neighbors. The water-like anomalies in the ramp potential are due to the ability of the particles to reproduce, upon compression or heating, the migration of water molecules from the second shell to its first shell.
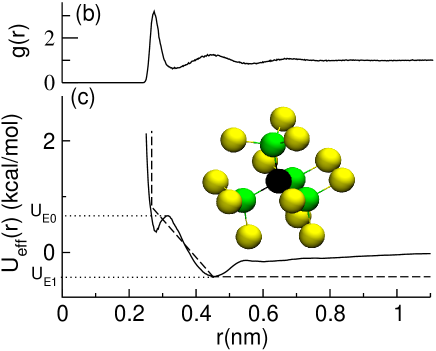
The TIP5P model is a well-known water model and its parameters are defined in physical units, so values of and from simulations can be compared directly with experiments tip5p . Instead, thermodynamic properties in the ramp potential are given in terms of potential parameters, such as , and the particle mass, . To compare the phase diagrams of the ramp potential to that of the TIP5P model, we will define and in units of ‘nm’ and ‘kcal/mol’, respectively, and in units of ‘g/mol’. We do this by calculating , the effective spherically symmetric pair potential between water molecules from the TIP5P model simulations. is obtained from the oxygen-oxygen pair correlation function , by solving the Ornstein-Zernike equation and using the hypernetted chain approximation stillinger93 . The resulting depends on and density johnson07 , but has no significant change for different state points in the anomalous region. For the TIP5P model, the range of anomalies is approximately K K and g/cm3 g/cm3 zyan2007 . We select a state point located in the middle of the anomalous regions, at K and g/cm3, and calculate and [see Fig. 1(b) and Fig. 1(c)]. We find that is similar to the effective pair potential obtained from the experimental stillinger93 , and shows a hard-core-like steep repulsion at nm and an approximately linear repulsive region covering the distance spanned by the second shell of a central water molecule, approximately nm nm. The shallow minimum at nm is caused by hydrogen-bonding attraction and corresponds to the first peak of , while the minimum at nm [ nm) kcal/mol] corresponds to the second peak of . also shows a maximum at nm [ nm) kcal/mol] that corresponds to the first minimum of .
Figure 1(c) also shows that a ramp potential is a good approximation to . In the figure we set nm and define the ramp part of the potential such that it intersects the plot of at . The intersection of the ramp part of the potential with the hard core of is used to define and . This results in nm, which is located between 0.28 nm, the first peak position of and 0.26 nm, roughly the infinite repulsion part of . Therefore, and kcal/mol. is approximately the energy barrier that water molecules need to overcome to migrate from the second shell to the first shell positions in terms of the effective potential. It is also roughly the energy that ramp particles need to overcome to reach the hard core distance.
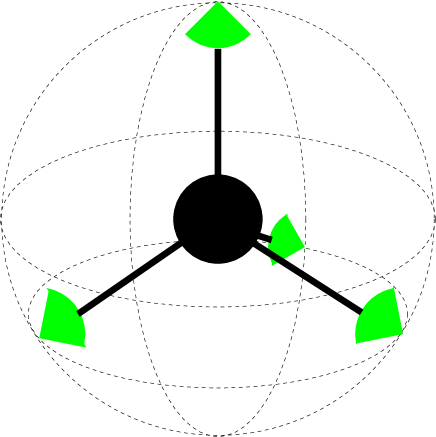
To define in physical units, we argue that the ramp particle corresponds to two water molecules. This is based on the crystalline phases of water (hexagonal ice) and ramp potential (hcp) [see Fig. 1]. The hexagonal ice can be formed by combining units such as that shown in Fig. 2. Each of this units is formed by a central water molecule and of its four neighbors, which are tetrahedrally arranged. To form the hexagonal ice, such units must form an hcp network. Therefore, if the crystalline structure of the ramp potential model is identified with that of hexagonal ice, a ramp particle must be identified, on average, to the unit shown in Fig. 2. The mass of a water molecule is g/mol, thus, the mass of a ramp particle is g/mol. Alternatively, the present argument implies that the number density of the ramp potential model corresponds to twice the number density of water, and this will be relevant when comparing the pressures of the ramp and TIP5P models footnoteMassDouble . To test the idea that a ramp particle corresponds approximately to two water molecules, we calculate the average number of neighbors, , that a water molecule has within a distance of nm. Using the from Fig. 1 we get (here, is the number density), in agreement with our view. The correspondence between one ramp particle and two water molecules is also supported by computer simulations of the ramp potential with and an attractive part wilding02 ; xu06 . Such a ramp potential model has both liquid-gas (LG) and liquid-liquid (LL) critical points. Application of the values for , , and that we use here to the data from wilding02 ; xu06 results in and g/cm3. These values approximately coincide with the experimental critical density of water critp1 and the LL critical density of TIP5P water g/cm3 critp2 .
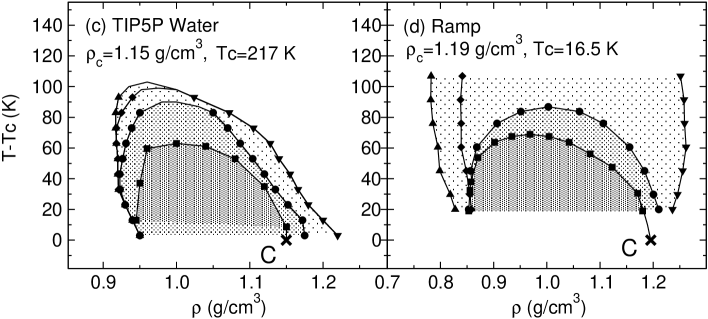
To compare the regions of anomalies in the phase diagrams of the TIP5P and ramp potentials, we first obtain the LLCP coordinates, . The LLCP in the TIP5P model is accessible in MD simulations and is located at K, MPa, and g/cm3 yamada02 ; paschek . Instead, for the ramp potential of Fig. 1(a), the LLCP is located at temperatures below those accessible in simulations predp05 . In this case, the LLCP can be located by extrapolating the isochores in the phase diagram to low- (the isochores cross each other at the LLCP). This procedure indicates that the LLCP is located at K, MPa, and g/cm3.
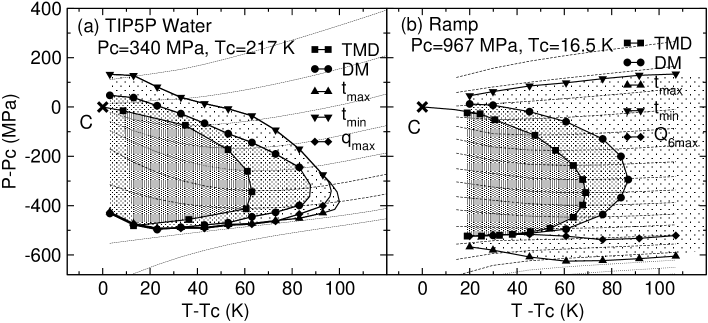
Figure 3 shows the phase diagrams of the TIP5P and ramp potential models, obtained by MD simulations (for details see zyan2007 ; predp05 ; zyan ). To emphasize the quantitative similarities of these diagrams we place the origins of and axes at the LLCP of the corresponding models. In both models, the density anomaly region is within the diffusion anomaly region, which is enclosed by the structure anomaly region. A comparison of panels (a) and (b), or (c) and (d), shows quantitative similarities in the regions of anomalies of both models. The density anomaly region covers approximately the ranges MPa, K, and g/cm3, for the TIP5P model, and MPa, K, and g/cm3 for the ramp potential model. Similarly, the diffusion anomaly region covers approximately the ranges MPa, K, and g/cm3 for the TIP5P model, and MPa, K, and g/cm3 for the ramp potential model. The structure anomaly region, defined by the loci of the order parameter extrema and for the TIP5P and ramp potential models respectively, covers approximately the range MPa and g/cm3, for the TIP5P model, and MPa and g/cm3, for the ramp potential model. However, the shape of the structural anomaly region is different in these models. It expands up to K for the TIP5P model, while for the ramp potential it expands to much higher temperature outside the graph.
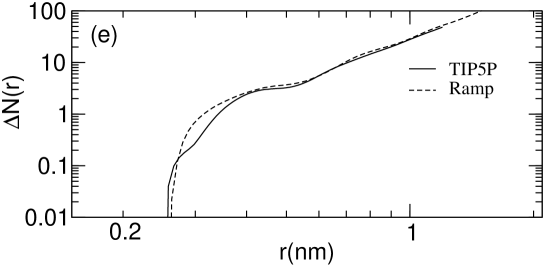
A possible reason for the quantitative similarities in the regions of anomalies of water and ramp potential model is that this model is able to reproduce quantitatively the observed migration of water molecules from the second shell toward the first shell upon compression or heating ssitta03 ; zyan2007 ; scio90 . We discuss first the probability distribution, , of the distance between a ramp particle and its nearest-neighbor. Figure 4(a) shows the evolution of upon isothermal compression. As density increases, the maxima of shifts from , at low density, to , at high density. Figure 4(b) shows that a similar but less pronounced changes in occur upon isobaric heating. Thus, upon compression or heating, particles move from the soft-core distance (corresponding to water’s second shell) toward the hard-core distance (corresponding to water’s first shell) of the ramp potential. Similar structural changes occur in water ssitta03 ; zyan2007 ; scio90 . In particular, Figures 4(a) and 4(b) can be compared with the corresponding Figs. 4(c) and 4(f) of ref. zyan2007 obtained for the TIP5P model. The probability distribution, , of the orientational order parameter, zyan , of the ramp potential particles is shown in Figs. 4(c) (upon isothermal compression) and 4(d) (upon isobaric heating). Upon compression or heating, the maximum shifts to small values of , i.e. orientational order decreases. Similar structural changes occur in the orientational order of water’s second shell; Figs. 4(c) and 4(d) can be compared with the corresponding Figs. 4(b) and 4(e) of ref. zyan2007 obtained for the TIP5P model. For a quantitative comparison of the structural changes in the ramp and TIP5P models, we calculate the number of neighbors, , as a function of the distance from a central water molecule/ramp particle in both models. The increase of with density, , is shown in Fig. 4(e). We see that for both models are remarkably similar and overlap for approximately nm. Thus, the ramp potential reproduces quantitatively the migration of water molecules from the second shell toward the first shell upon compression or heating.
In summary, our study makes a microscopic quantitative connection between a ramp potential and TIP5P water model and shows that orientational interactions, such as hydrogen bonding, are not necessary to reproduce water-like anomalous properties. In general, the ramp potential provides an understanding of the anomalous features of tetrahedral liquids. These features are caused by a large empty space around the tetrahedrally coordinated molecules, which is reduced as temperature and pressure increase. In the ramp liquid, this empty space is created by the repulsive soft core.
We thank NSF for support with grants CHE 0096892. SVB gratefully acknowledges the partial support of this research through the Dr. Bernard W. Gamson Computational Laboratory at Yeshiva College. We are thankful to P. G. Debenedetti for enlightening discussion and for comments on the manuscript.
References
- (1) P. G. Debenedetti and H. E. Stanley, Physics Today 56, 40 (2003).
- (2) J. R. Errington and P. G. Debenedetti, Nature 409, 318 (2001).
- (3) P. H. Poole et al., Nature 360, 324 (1992).
- (4) C. A. Angell et al., Phys. Chem. Chem. Phys. 2, 1559 (2000).
- (5) M. S. Shell et al., Phys. Rev. E. 66, 011202 (2002).
- (6) V. Molinero et al., Phys. Rev. Lett. 97, 075701 (2006).
- (7) P. C. Hemmer and G. Stell, Phys. Rev. Lett. 24, 1284 (1970).
- (8) C. H. Cho et al., Phys. Rev. Lett. 76, 1651 (1996).
- (9) F. H. Stillinger and D. K. Stillinger, Physica A 244, 358 (1997).
- (10) M. R. Sadr-Lahijany et al., Phys. Rev. Lett. 81, 4895 (1998).
- (11) E. A. Jagla, Phys. Rev. E 58, 1478 (1998).
- (12) P. Kumar et al., Phys. Rev. E 72, 021501 (2005).
- (13) N. B. Wilding and J. E. Magee, Phys. Rev. E 66, 031509 (2002).
- (14) L. Xu et al., PNAS 102, 16558 (2005); Phys. Rev. E 74, 031108 (2006).
- (15) Z. Yan et al., Phys. Rev. Lett. 95, 130604 (2005); Phys. Rev. E. 73, 051204 (2006).
- (16) A. B. de Oliveira et al., J. Chem. Phys. 125, 124503 (2006).
- (17) R. Sharma et al., J. Chem. Phys. 125, 204501 (2006).
- (18) J. R. Errington et al., J. Chem. Phys. 125, 244502 (2006).
- (19) Z. Yan et al., Phys. Rev. E 76, 051201 (2007).
- (20) M. W. Mahoney and W. L. Jorgensen, J. Chem. Phys. 112, 8910 (2000).
- (21) T. Head-Gordon and F. H. Stillinger, J. Chem. Phys, 98, 3313 (1993).
- (22) M. E. Johnson et al., J. Chem. Phys. 126, 144509 (2007).
- (23) The pressure is defined as , where is the virial expression and is the number density [see, e.g., M. P. Allen and D. J. Tildesley, Computer simulations of liquids, Oxford University Press., New York, 2004]. Therefore, since in the present case the ramp potential number density doubles, the values of pressure also doubles.
- (24) See data from IAPWS (http://www.iapws.org/relguide/fundam.pdf).
- (25) H. E. Stanley et al., Physica A 315 281 (2002); S. B. Kiselev and J. F. Ely, J. Chem. Phys. 116 5657 (2002).
- (26) M. Yamada et al., Phys. Rev. Lett. 88, 195701 (2002).
- (27) D. Paschek, Phys. Rev. Lett. 94, 217802 (2005).
- (28) F. Sciortino et al., Phys. Rev. Lett. 65, 3452 (1990); Nature 354, 218 (1991).
- (29) A. M. Saitta and F. Datchi, Phys. Rev. E. 67, 020201(R) (2003).
- (30) G. E. Walrafen, J. Chem. Phys. 40, 3249 (1964).