An extreme IMF as an explanation for high M/L ratios in UCDs? The CO index as a tracer of bottom heavy IMFs.
Abstract
A new type of compact stellar systems, labelled “ultra-compact dwarf galaxies” (UCDs), was discovered in the last decade. Recent studies show that their dynamical mass-to-light ratios (M/L) tend to be too high to be explained by canonical stellar populations, being on average about twice as large as those of Galactic globular clusters of comparable metallicity. If this offset is caused by dark matter in UCDs, it would imply dark matter densities as expected for the centers of cuspy dark matter halos, incompatible with cored dark matter profiles. Investigating the nature of the high M/L ratios in UCDs therefore offers important constraints on the phase space properties of dark matter particles. Here we describe an observational method to test whether a bottom-heavy IMF may cause the high M/L ratios of UCDs. We propose to use the CO index at 2.3 – which is sensitive to the presence of low-mass stars – to test for a bottom heavy IMF. In the case that the high M/L ratios are caused by a bottom-heavy IMF, we show that the equivalent width of the CO index will be up to 30% weaker in UCDs compared to sources with similar metallicity that have canonical IMFs. We find that these effects are well detectable with current astronomical facilities in a reasonable amount of time (a few hours to nights). Measuring the CO index of UCDs hence appears a promising tool to investigate the origin of their high M/L ratios.
Subject headings:
galaxies: clusters: individual: Virgo – galaxies: dwarf – galaxies: fundamental parameters – galaxies: nuclei – globular clusters: general1. Introduction
Within the last decade, a new class of compact stellar systems has been discovered: the so-called “ultra-compact dwarf galaxies” (UCDs, Phillips et al. 2001; see also Hilker et al. 1999; Drinkwater et al. 2000 & 2003; Mieske et al. 2004, 2006, 2007; Haşegan et al. 2005). UCDs are characterised by old stellar populations, absolute magnitudes mag, half-light radii and masses . Hence they are larger, brighter and more massive than the biggest Milky Way globular clusters (GCs), but at the same time significantly more compact than typical dwarf galaxies of comparable luminosity.
There are three main hypotheses on the origin of UCDs: 1. They are remnant nuclei of tidally stripped dwarf galaxies (Zinnecker et al. 1988; Bassino et al. 1994; Bekki et al. 2003). 2. UCDs are merged star cluster complexes created in galaxy mergers (Fellhauer & Kroupa 2002 and 2005). 3. UCDs are genuine compact dwarf galaxies originating from small-scale peaks in the primordial dark matter power spectrum (Drinkwater et al. 2004). In the latter case, UCDs may be expected to still be dark matter dominated.
2. High M/L ratios of UCDs
A powerful way to investigate the nature of UCDs is to measure their dynamical mass-to-light ratios (M/L). Contrasting the measurements with predictions from stellar population models, one can estimate the amount of unseen mass in UCDs, potentially constraining their formation scenarios. In the Virgo cluster, Haşegan et al. (2005) have found several UCDs with M/L ratios well above the ranges predicted by stellar population models that assume a canonical IMF (Kroupa or Chabrier). Evstigneeva et al. (2007) investigate a disjunct sample of 6 Virgo UCDs and find that within the errors, their M/L ratios are compatible with canonical SSP models. Hilker et al. (2007) study the internal dynamics of 5 Fornax UCDs and the 6 Virgo UCDs from Evstigneeva et al. (2007). They arrive to the conclusion that the UCD M/L ratios tend to be above predictions from SSP models assuming a canonical Kroupa or Chabrier IMF, but are consistent with a Salpeter IMF, which is characterised by being more bottom-heavy than the canonical IMF (Kroupa 2001).
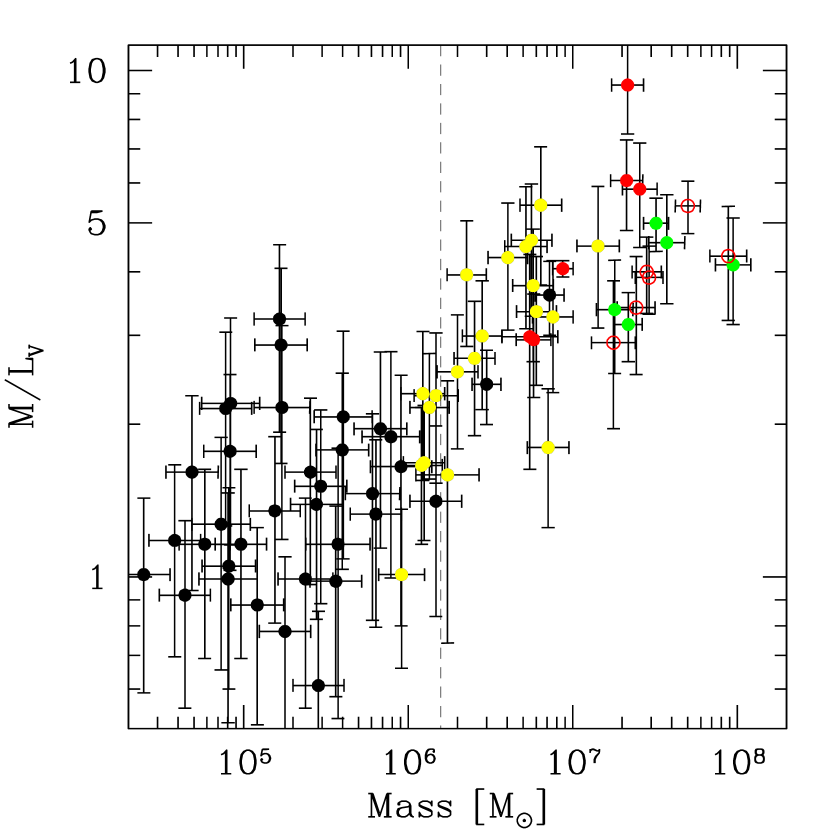
In Fig. 1 we plot the available literature M/LV measurements for compact stellar systems vs. their mass, ranging from low-mass globular clusters up to the most massive UCDs. This sample spans a mass range of 4 decades. Clearly, starting at a mass of 2 M☉, the data show a trend of increasing M/L with increasing mass (this trend has also been noted by Evstigneeva et al. 2007 and Rejkuba et al. 2007).
In this context it is important to stress that stellar population models predict an increase of M/LV ratio with increasing metallicity, as noted previously in several studies (e.g. Haşegan et al. 2005, Hilker et al. 2007, Evstigneeva et al. 2007). Therefore, a possible increase of metallicity with mass among the sample of compact objects investigated will naturally create a trend of M/LV with mass as seen in Fig. 1. In order to remove such a possible effect from the data, we normalise the M/LV ratio values in Fig. 1 to the same metallicity. The result of this exercise is shown in Fig. 2. For normalising, we use the M/L predictions as a function of [Fe/H] for a 13 Gyr population from the two model sets of Bruzual & Charlot (2003, Chabrier IMF) and Maraston (2005, Kroupa IMF) (see also Dabringhausen et al. 2008). To each of the two sets of model predictions we fit a function of the form
| (1) |
The parameters of the fits are shown in Table 1. For each of the two model sets, we then normalise the literature M/L values in the following way:
| (2) |
where is the theoretical prediction for [Fe/H]=0, i.e. solar metallicity.
| Model | a | b | c |
|---|---|---|---|
| Bruzual & Charlot (2003) | 1.98 | 1.245 | 1.72 |
| Maraston (2005) | 3.21 | 0.739 | 1.29 |
Some details on the metallicities of the literature data: the values for Galactic GCs are direct measurements, including isochrone fitting and spectroscopy (McLaughlin & van der Marel 2005). The [Fe/H] values for the CenA sources from Rejkuba et al. (2007) are derived from their (V-I) and (B-V) colours. For this we adopted the mean [Fe/H] derived from applying the calibration relations from Kissler-Patig et al. (1998) for (V-I) and from Barmby et al. (2000) for (B-V). The [Fe/H] values from Evstigneeva et al. (2007) are derived from their measurement of the MgFe Lick line index, applying the corresponding calibration relation used in Mieske et al. (2007). The [Fe/H] values for the sources from Haşegan et al. (2005) are taken from their paper, and are based on broad-band colours. For 3 out of 5 Fornax UCDs from Hilker et al. (2007), spectroscopic [Fe/H] estimates from Mieske et al. (2006) are used. For the 2 remaining UCDs, [Fe/H] is estimated based upon their (V-I) colours using Kissler-Patig et al. (1998). In Table 2 we list the adopted [Fe/H], M/L and M/Lnorm for the compact objects in CenA, Fornax and Virgo.
| Source | M/L | [Fe/H] | (M/L)norm,BC | (M/L)norm,M | Environment |
|---|---|---|---|---|---|
| (M/L) | (M/L) | ||||
| HGHH92-C7 | 3.26 | 1.30 | 5.75 | 5.89 | CenA1 |
| HGHH92-C11 | 5.42 | 0.46 | 7.07 | 6.82 | CenA1 |
| HHH86-C15=R01-226 | 2.28 | 0.75 | 3.38 | 3.27 | CenA1 |
| HGHH92-C17 | 3.76 | 1.30 | 6.62 | 6.77 | CenA1 |
| HGHH92-C21 | 4.62 | 1.20 | 7.92 | 7.99 | CenA1 |
| HGHH92-C22 | 2.99 | 1.20 | 5.14 | 5.19 | CenA1 |
| HGHH92-C23 | 1.80 | 1.50 | 3.30 | 3.46 | CenA1 |
| HGHH92-C29 | 4.27 | 0.67 | 6.12 | 5.92 | CenA1 |
| HGHH92-C36=R01-113 | 2.54 | 1.50 | 4.62 | 4.83 | CenA1 |
| HGHH92-C37=R01-116 | 1.66 | 0.95 | 2.64 | 2.59 | CenA1 |
| HHH86-C38=R01-123 | 1.68 | 1.20 | 2.91 | 2.95 | CenA1 |
| HGHH92-C41 | 2.16 | 0.65 | 3.07 | 2.97 | CenA1 |
| HGHH92-C44 | 3.95 | 1.60 | 7.33 | 7.79 | CenA1 |
| HCH99-2 | 4.49 | 1.50 | 8.15 | 8.51 | CenA1 |
| HCH99-15 | 3.34 | 1.00 | 5.45 | 5.39 | CenA1 |
| HCH99-16 | 2.70 | 1.90 | 5.25 | 5.88 | CenA1 |
| HCH99-18 | 4.50 | 0.98 | 7.23 | 7.12 | CenA1 |
| HCH99-21 | 1.59 | 2.00 | 3.10 | 3.49 | CenA1 |
| R01-223 | 2.30 | 1.10 | 3.86 | 3.86 | CenA1 |
| R01-261 | 1.01 | 0.98 | 1.62 | 1.60 | CenA1 |
| S314 | 2.94 | 0.50 | 3.91 | 3.77 | Virgo2 |
| S417 | 5.83 | 0.70 | 8.46 | 8.19 | Virgo2 |
| S490 | 4.06 | 0.18 | 3.58 | 3.69 | Virgo2 |
| S928 | 6.06 | 1.30 | 10.7 | 11.0 | Virgo2 |
| S999 | 9.36 | 1.40 | 16.7 | 17.2 | Virgo2 |
| H8005 | 2.98 | 1.30 | 5.18 | 5.27 | Virgo2 |
| VUCD1 | 4.00 | 0.76 | 5.94 | 5.76 | Virgo3 |
| VUCD3 | 5.40 | 0.01 | 5.44 | 5.43 | Virgo3 |
| VUCD4 | 3.40 | 1.00 | 5.55 | 5.50 | Virgo3 |
| VUCD5 | 3.90 | 0.36 | 4.83 | 4.68 | Virgo3 |
| VUCD6 | 2.90 | 1.00 | 4.70 | 4.65 | Virgo3 |
| VUCD7 | 4.30 | 0.66 | 6.14 | 5.94 | Virgo3 |
| UCD1 | 4.99 | 0.67 | 7.17 | 6.93 | Fornax4 |
| UCD2 | 3.15 | 0.90 | 4.93 | 4.82 | Fornax4 |
| UCD3 | 4.13 | 0.52 | 5.54 | 5.35 | Fornax4 |
| UCD4 | 4.57 | 0.85 | 7.02 | 6.85 | Fornax4 |
| UCD5 | 3.37 | 1.20 | 5.80 | 5.87 | Fornax4 |
1 Rejkuba et al. (2007). [Fe/H] from broad-band colours, see text.
2 Haşegan et al. (2005). [Fe/H] from broad-band colours, see text.
3 Evstigneevae et al. (2007). [Fe/H] from spectroscopy, see text.
4 Hilker et al. (2007). [Fe/H] from spectroscopy for UCD1, UCD3, UCD4, from (V-I) for UCD2 and UCD5.
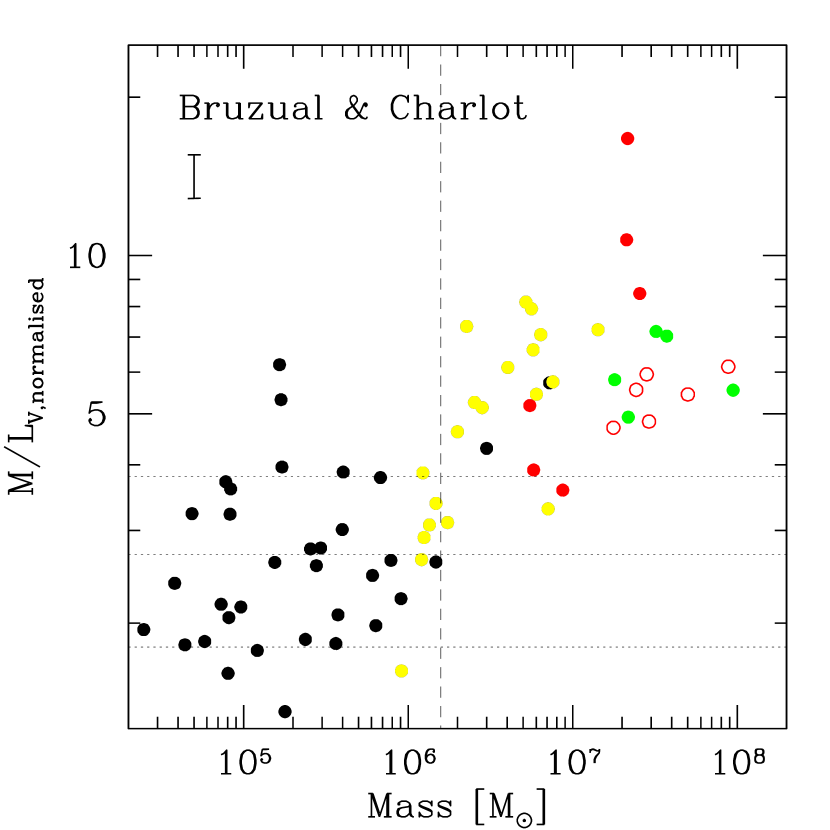
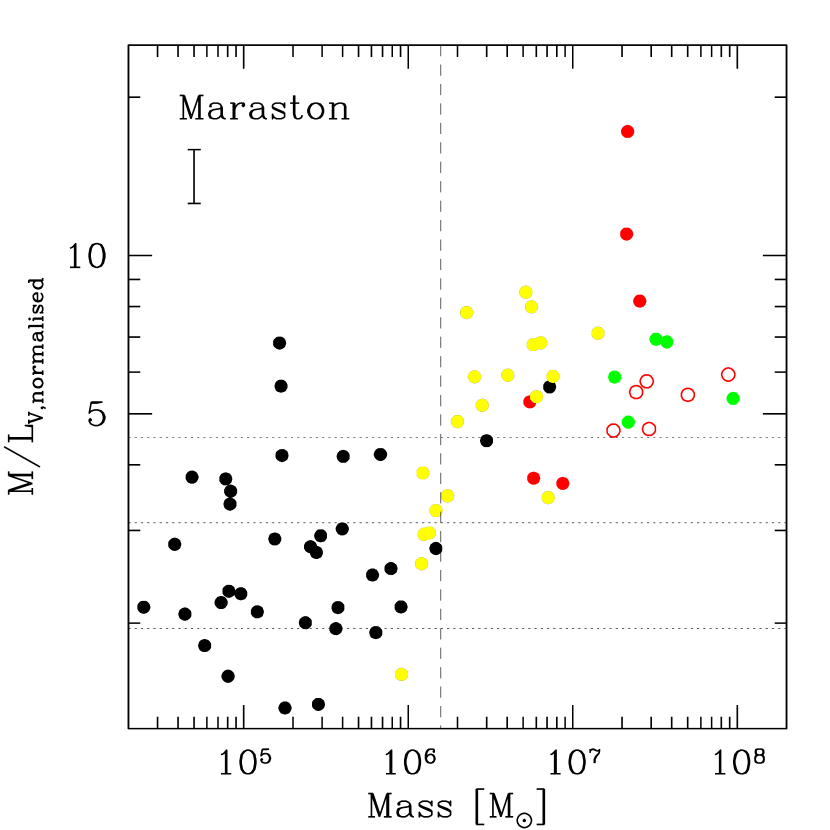
In Fig. 2 we show the normalised M/L ratios, in separate plots for the two model sets chosen for normalisation. We note that the normalisation to solar metallicity is of course an arbitrary choice, but we prefer this particular choice in order to have a well defined reference that is independent on the actual metallicity of the investigated population. In Fig. 2, a change of the normalisation would change nothing but the scale of the y-axis. The location of the data with respect to the M/L ratios expected from the models is independent on the choice of normalisation.
For both model choices plotted in Fig. 2 it is clear that the distribution of mass vs. M/L ratios does exhibit a very interesting separation at about 2106 M☉: sources with lower masses have M/L ratios in line with canonical stellar populations, whereas sources with higher masses have M/L ratios that tend to be above those for canonical stellar populations. The ratio of the average M/L ratio between low- and high-mass sources is 2.3 0.2 for both choices of normalisation. The occurence of this break at 2106 M☉ is in line with previous findings of breaks in terms of size (Haşegan et al. 2005, Mieske et al. 2006) and metallicity (Mieske et al. 2006) at about the same mass. It hence strengthens the proposed separation between canonical globular clusters and ultra-compact dwarf galaxies at this mass (Haşegan et al. 2005, Mieske et al. 2006). Interestingly, the separation mass corresponds to the mass range where the relaxation time of compact stellar systems is comparable to a Hubble time (Dabringhausen et al. 2008).
The high M/L ratios for UCDs can be explained by the presence of dark matter, which would have to be at very high densities ( pc-3 within 20 pc). This is comparable to central density values expected for cuspy dark matter halos (Walker et al. 2007). However, it is incompatible with recent claims of cored dark matter halos with low central densities in dwarf spheroidal galaxies (e.g. Gilmore et al. 2007), which are the most dark matter-dominated systems known (see however Metz & Kroupa 2007 for an entirely different interpretation). Investigating the nature of the high M/L ratios in UCDs therefore offers important constraints on the phase space properties of dark matter particles.
3. An extreme IMF as the reason for high M/L?
Here, we describe a method to test whether a bottom heavy stellar initial mass function (IMF) causes the high M/LV ratios of UCDs. Such steep low-mass stellar IMFs may result if the radiation field, stellar winds and supernova explosions in UCDs were so intense during their formation, that pre-stellar cloud cores were ablated before they could fully condense to stars (Kroupa & Bouvier 2003). By confirming such an overabundance of low-mass stars with respect to a canonical IMF (Kroupa 2001), we would for the very first time have unambiguous evidence for a radically different star-formation process under extreme physical conditions when UCDs formed.
By excluding this scenario we would know that the high M/LV ratios are probably due to dark matter. This could be in the form of stellar remnants, perhaps as a result of a top-heavy IMF in primordial and pristine star formation regions (POP III, Jimenez & Haiman 2006, Tornatore et al. 2007, Dabringhausen et al. 2008). Alternatively, it could be due to non-baryonic dark matter, which in turn would open new avenues towards studying the phase-space properties of dark matter particles (see above). We note that tidal heating (Fellhauer & Kroupa 2006) may increase the measured M/L ratio of individual UCDs after a very close passage (pc) next to the host galaxy’s center. However, this can certainly not explain the existence of the general and very clear trend of M/L with mass (Fig. 2).
3.1. The CO index as a tracer of a bottom-heavy stellar IMF
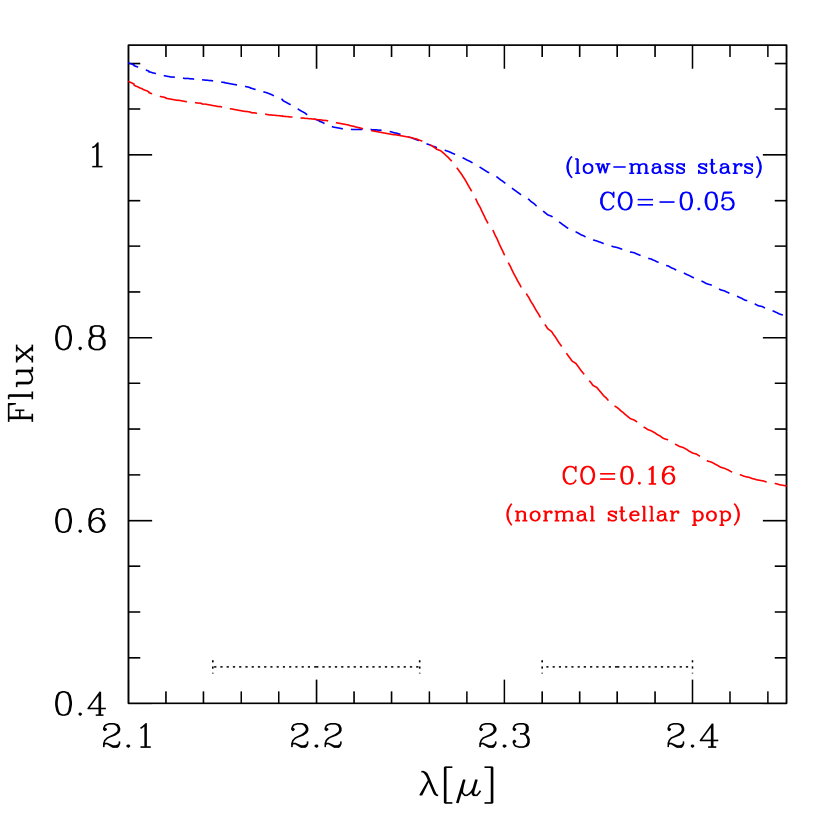
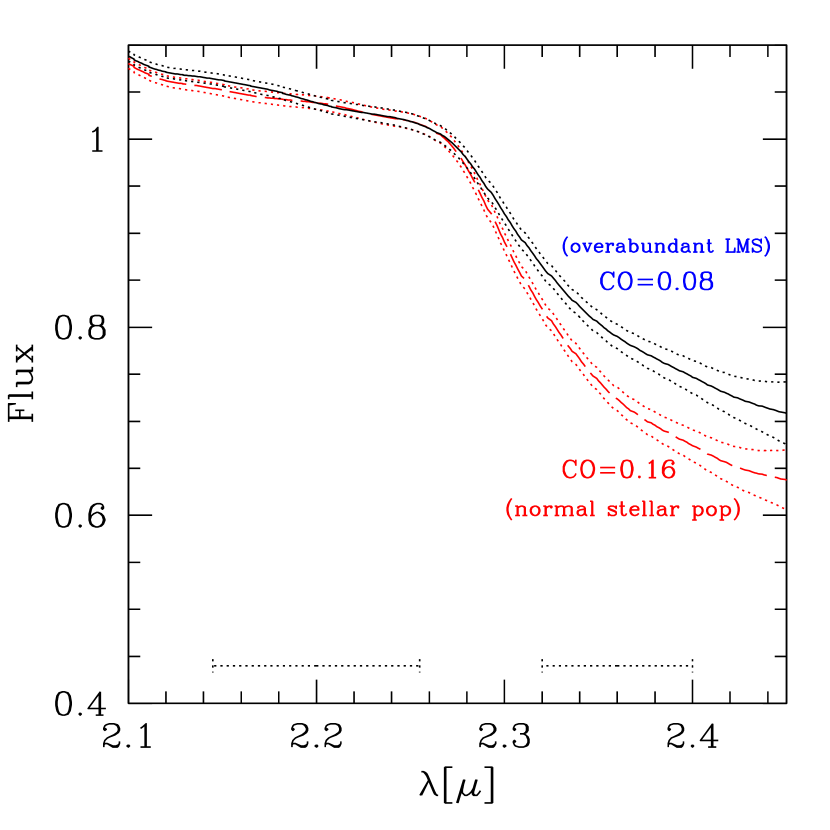
For diagnosing a bottom heavy IMF, we propose to study a portion of the spectrum where the hypothetical overabundant population of low-mass (main sequence) stars contributes significantly to the integrated spectrum. In this region, the shape of the spectral energy distribution (SED) emitted by these unevolved dwarf stars must be different to that of the evolved giant stars. This is the case for the near-infrared wavelength region of the CO band (, see Fig. 3). For intermediate to high metallicities, late type giant stars have a very strong CO absorption feature, while late type dwarf stars have a much weaker feature (see Figs. 3 and 4), independent of metallicity (e.g. Frogel et al. 1978). At a given metallicity, the strength of the CO absorption feature anti-correlates with the fraction of low-mass stars present in a stellar population. One thus expects a weaker CO index for high M/L ratio sources, if the high M/L ratios are caused by low-mass stars.
Our working hypothesis is that the stellar population of a high M/L ratio UCD consists of a canonical part with a ’normal’ M/L and IMF, plus an additional population of low mass stars. Kroupa & Gilmore (1994) present a detailed analysis of such a scenario. They quantify which luminosity fraction of the composite overall luminosity is contributed by this additional population of low-mass stars in the CO wavelength region, which is close to the K-band. In the context of this paper this fraction can be written in terms of luminosities as
| (3) |
Obviously, for a normal stellar population without additional low-mass stars. In terms of masses and M/L ratios we re-write
| (4) |
The term ranges between 1.4 and 0.66 for [Fe/H] between -2 and 0 dex, assuming a 12 Gyr population (Worthey et al. 1994). Introducing the ratio , we get
| (5) |
The ratio can be expressed as . As we assume the mean normalised M/L ratio of compact stellar system less massive than 2106 M☉ (see Fig. 1), which is 2.75. For example, we get for the highest ratio UCD (object S999 with normalised =17). The term in depends on the slope and cutoff mass in the mass distribution of the additional low-mass-star population. From Kroupa & Gilmore (1994) we find a range of for the parameter space and .
We can now express the CO index as a function of , and hence as a function of ,
| (6) |
From Fig. 3 and Kroupa & Gilmore (1994) we adopt mag. The choice of requires a brief discussion. The CO index of old stellar populations with canonical IMF is dominated by giant stars. Since the dominant stellar type in the integrated light changes towards earlier types for lower metallicitiy, and because the CO index anticorrelates with surface temperature, the CO index anticorrelates with integrated metallicity (e.g. Frogel et al. 2001). We use the linear calibration between [Fe/H] and CO by Frogel et al. (2001) (see also Fig. 4) derived from Galactic globular clusters in order to determine at a given [Fe/H].
For each of the compact stellar systems from Fig. 2, we can now calculate the expected CO index, under the hypothesis that a M/L ratio offset above the average value for Galactic globular clusters is explained by an additional population of low-mass stars. For this we assume the mean of the CO indices corresponding to the two extreme values of from above. The result of this exercise is shown in Fig. 4. In the left panel we plot [Fe/H] against the expected CO index. We show both the photometric index (Fig. 3) and the spectroscopic one (feature band between 2.291 and 2.302, see Frogel et al. 2001 for the exact pass-band definitions), using the well defined linear relation between both indices (Frogel et al. 2001). We overplot the calibration relation between [Fe/H] and CO from Frogel et al. (2001).
There can be substantial offsets mag due to the higher M/L ratios, corresponding to 30% of the equivalent with of the CO absorption feature. As aid for the eye we also indicate in Fig. 3 the offset relation for two different fractions of additional low-mass stars. The dashed curve corresponds to a mass fraction of 55% contributed by additional low-mass stars, which is representative of the average M/L ratio offset between UCDs and GCs in Fig. 1. The dotted curve indicates a mass fraction of 75%, corresponding to the most extreme observed UCDs. In the right panel of Fig. 4, we plot the expected offset from the Frogel et al. [Fe/H]CO relation vs. mass of the compact stellar systems. The largest offsets are expected for high masses, given the increase of M/L ratios in the UCD regime.
In the next section we assess the observational detectability of these offsets.


3.2. Observability of the change in CO as f(M/L)
Looking at Fig. 4, there are three minimum requirements for detecting a drop in the CO index in a single source due to a high M/L ratio. First, one requires an accurate calibration between CO and [Fe/H], applicable to 0.1 dex precision. Second, one requires an [Fe/H] measurement of a single source accurate to 0.1 dex. Third, one requires measurement of the CO index to an accuracy of 0.010.02 mag, or 5-10% in terms of equivalent width. We note that the existing calibration between CO and [Fe/H] by Frogel et al. (2001) is performed with Galactic GCs, and has a cluster-to-cluster dispersion of the order 0.15 dex. It is reasonable to assume that future calibration attempts including population synthesis models (e.g. Brodie et al. 2007) will reach accuracy levels down to 0.10 dex. Still, even with an accurate calibration, an offset in a single object measurement may be detected with very accurately measured CO and [Fe/H] only for the largest expected CO offsets.
The more efficient way to detect a change in CO are relative measurements of statistically significant samples (1020 objects) covering a broad range in metallicities. Sources with M/L ratios consistent with canonical IMFs have to be observed in parallel to UCDs with high M/L ratios. The aim is to arrive at a comprehensive sample of precise measurements of M/L, CO and [Fe/H], obtained with identical or similar instrument settings. This changes the requirements on [Fe/H] from 0.1 dex accuracy to 0.1 to 0.2 dex relative precision. This is well possible with moderately high S/N optical spectroscopic measurements of [Fe/H] (e.g. Mieske et al. 2006), requiring on-source integration times of a few hours at 6-10m class telescopes. To cover a substantial portion of the known UCD population, only a few pointings of multi-object spectroscopy with moderately large FOV (0.25 to 0.5 degree) would be required. See a map of all known Fornax and Virgo UCDs in Fig. 5. That is, within a few nights of observations, the required precision of [Fe/H] can be reached for the known UCD population.
What about the necessary integration time for precisely measuring the CO feature depth? In the right panel of Fig. 3 we show a smoothed NIR spectrum around the CO regions, indicating the 1 envelope for a S/N=150 per 0.04 resolution element at 2.2. Integrating over the feature and continuum regions, the precision of measuring the CO index is about 0.01 mag. To calculate the integration time needed to achieve this S/N, we use the Exposure Time Calculator (ETC) of ISAAC on the VLT (Version 3.2.1). We assume V=20.0 mag as object magnitude, which is at the faint end of the observed UCD magnitude range in Fornax and Virgo, and thus gives an upper limit on the required integration time. As input for the ISAAC ETC we adopt =2.5 (Worthey 1994 for a 12 Gyr population of [Fe/H]=-0.7 dex), hence K=17.5 mag. Assuming a K-band seeing of 0.7′′, a slit-width of 1′′, a black-body curve of 4000K, and the low-resolution spectroscopy mode, we require 7 hours on-source integration time to achieve S/N=150 per 0.04 at 2.2. As comparison objects with canonical M/L ratios, one will want to choose bright objects, requiring much shorter integration times. Those could be massive GCs in more nearby galaxies, for which M/L ratios and metallicities are available (e.g. GCs in NGC 5128, see Rejkuba et al. 2007).
The ideal way to measure the CO index for a comprehensive sample of UCDs certainly is wide-field imaging with purpose-build narrow-band (NB) filters covering the CO feature and continuum, each of width 0.1 (Fig. 3). In Fig. 5 we indicate the projected distribution of UCDs in the Fornax and Virgo cluster relative to the respective central cluster galaxies. For comparison we show the FOV of available IR imagers on 4-8m class telescopes. This plot shows that most of the UCDs in either cluster are contained within one WFCAM or VISTA pointing. For the above example of a UCD with K=17.5 mag, we can estimate the required amount of integration time necessary to achieve S/N=100 for a point-source image in the CO continuum and feature pass-band. For this we use the VISTA ETC (http://www.ast.cam.ac.uk/vdfs/etc) and calculate the required time for S/N=100 with the Ks filter, which is centred on 2.15 with FWHM=0.3. For K=17.5 mag, the required integration time using this Ks filter is about 5400 seconds, or 1.5 hours. To convert this into the time required for the same S/N with a NB CO filter, two things need to be taken into account. First, the CO feature bands are 3 times narrower than the Ks filter. Second, the sky brightness in the CO feature band (2.35) is about 2.5 times higher than at 2.15 (see ISAAC ETC). Taking these two differences into account, one requires on-source integration of 5.6 hours for the CO continuum band and 27 hours for the CO feature band.
4. Conclusions
We conclude that measuring the depth of the CO feature (2.35) in the near-IR SED of old extragalactic systems is a promising tool to constrain the low-mass slope of the IMF, provided that precise metallicity estimates (0.15 dex) are available. For the case of UCDs, such observations offer an important test as to whether their high M/L ratios are caused by very bottom heavy IMFs. Given that an alternative explanation for these high M/L ratios is dark matter at very high densities, the study of the IMF in UCDs will allow important constraints on the phase space properties of dark matter particles.
To demonstrate the feasibility of the method proposed here, the first step is to obtain low resolution spectroscopy of the UCDs with largest expected drop in CO, and reference sources of comparable metallicity with normal M/L ratios. As a next step, wide-field NIR imaging with appropriate narrow-band filters will allow to probe large representative samples of UCDs within a few nights of telescope time. With such observations it will also be possible to investigate spatial variations in the IMF in early-type giant and dwarf galaxies, provided that spatially resolved information on their [Fe/H] abundances are available from IFU or long-slit spectroscopy. In the context of the tidal stripping scenario, an important aspect in that context will be to compare the CO index in nuclear regions of dwarf galaxies with those in UCDs.
References
- (1) Barmby, P., Huchra, J. P., Brodie, J. P. et al. 2000, AJ, 119, 727
- (2) Bassino, L. P., Muzzio, J. C., & Rabolli, M. 1994, ApJ, 431, 634
- (3) Bekki, K., Couch, W.J., Drinkwater, M.J., Shioya, Y., 2003, MNRAS, 344, 399
- (4) Brodie, J. P., Cenarro, A. J., Beasley, M., Strader, J., & Cardiel, N. 2007, NOAO Proposal ID #2007A-0203
- (5) Bruzual, G., & Charlot, S. 2003, MNRAS, 344, 1000
- (6) Dabringhausen, J., Hilker, M., & Kroupa, P. 2008, submitted to MNRAS
- (7) Drinkwater M.J., Jones J.B., Gregg M.D., Phillipps S., 2000, PASA 17, 227
- (8) Drinkwater, M.J., Gregg, M.D., Hilker, M. et al., 2003, Nature, 423, 519
- (9) Drinkwater M.J., Gregg M.D., & Couch W.J. et al. 2004, PASA, 21, 375
- (10) Evstigneeva, E. A., Gregg, M. D., Drinkwater, M. J., Hilker, M. AJ, 133, 1722
- (11) Fellhauer, M., & Kroupa, P. 2002, MNRAS, 330, 642
- (12) Fellhauer, M., & Kroupa, P. 2005, MNRAS, 359, 223
- (13) Fellhauer, M., & Kroupa, P. 2006, MNRAS, 367, 1577
- (14) Frogel, J. A., Persson, S. E., Matthews, K., & Aaronson, M. 1978, ApJ, 220, 75
- (15) Frogel, J. A., Stephens, A., Ramirez, S., & DePoy, D. L. 2001, AJ, 122, 1896
- (16) Gilmore, G., Wilkinson, M., I.; Wyse, R. F. G., Kleyna, J. T., Koch, A., Evans, N. W., Grebel, E. K. 2007, ApJ, 663, 948
- (17) Goldader, J. D., Joseph, R. D., Doyon, R., & Sanders, D. B. 1997, ApJS, 108, 449
- (18) Haşegan, M., Jordán, A., Côté, P. et al. (VCS team) 2005, ApJ, 627, 203
- (19) Hilker, M., Infante, L., Vieira, G., Kissler-Patig, M., & Richtler, T. 1999, A&AS, 134, 75
- (20) Hilker, M., Baumgardt, H., Infante, L., Drinkwater, M., Evstigneeva, E., & Gregg, M. 2007, A&A, 463, 119
- (21) Ivanov, V. D., Rieke, G. H., Groppi, C. E., Alonso-Herrero, A., Rieke, M. J., & Engelbracht, C. W. 2000, ApJ, 545, 190
- (22) Jimenez, R. & Haiman, Z. 2006, Nature, 440, 501
- (23) Kroupa, P., & Gilmore, G. F. 1994, MNRAS, 269, 655
- (24) Kroupa, P., 2001, MNRAS, 322, 231
- (25) Kroupa, P,, & Bouvier, J. 2003, MNRAS, 346, 369
- (26) Lancon, A., & Rocca-Volmerange, B. 1992, A&AS, 96, 593
- (27) Maraston, C. 2005, MNRAS, 362, 799
- (28) McLaughlin, D. E., van der Marel, R. P. 2005, ApJS, 161, 304
- (29) Metz, M., & Kroupa, P. 2007, MNRAS, 376, 387
- (30) Mieske, S., Hilker, M., Infante, L. 2004, A&A, 418, 445
- (31) Mieske, S., Hilker, M., Infante, L., & Jordán, A. 2006, AJ, 131, 2442
- (32) Mieske, S., Hilker, M., Jordán, A., Infante, L., & Kissler-Patig M. 2007, A&A, 472, 111
- (33) Phillipps S., Drinkwater M.J., Gregg M.D., Jones J.B., 2001, ApJ 560, 201
- (34) Rejkuba, M., Dubath, P., Minniti, D., & Meylan, G. 2007, A&A, 469, 147
- (35) Tornatore, L., Ferrara, A., & Schneider, R. 2007, MNRAS in press, arXiv:0707.1433
- (36) Walker, M. et al. 2007, ApJ, 667L, 53
- (37) Worthey, G. 1994, ApJS, 95, 107
- (38) Zinnecker, H., Keable, C. J., Dunlop, J. S., Cannon, R. D., & Griffiths, W. K., 1988, Proceedings of the 126th Symposium of the International Astronomical Union, Edited by Jonathan E. Grindlay and A. G. Davis Philip. Kluwer Academic Publishers, Dordrecht, 1988., p.603