Gemini/GMOS Spectroscopy of the Spheroid and Globular Cluster System of NGC 3923
Abstract
We present a technique to extract ultra-deep diffuse-light spectra from the standard multi-object spectroscopic observations used to investigate extragalactic globular cluster (GC) systems. This technique allows a clean extraction of the spectrum of the host galaxy diffuse light from the same slitlets as the GC targets. We show the utility of the method for investigating the kinematics and stellar populations of galaxies at radii much greater than usually probed in longslit studies, at no additional expense in terms of telescope time. To demonstrate this technique we present Gemini/GMOS spectroscopy of 29 GCs associated with the elliptical galaxy NGC 3923. We compare the measured stellar population parameters of the GC system with those of the spheroid of NGC 3923 at the same projected radii, and find the GCs to have old ages 10 Gyr, [/Fe]0.3 and a range of metallicities running from [Z/H] = -1.8 to +0.35. The diffuse light of the galaxy is found to have ages, metallicities and [/Fe] abundance ratios indistinguishable from those of the red GCs.
keywords:
galaxies: general - galaxies: abundances - galaxies: individual: NGC 3923 - galaxies: stellar content - globular clusters: general1 Introduction
In recent years great strides have been made in the spectroscopic study of globular clusters (GCs), and we have begun to build up large samples of spectroscopically determined ages, metallicities and alpha-element abundances with the aim of using these data to infer star formation histories for their host galaxies (Kissler-Patig et al., 1998; Kuntschner et al., 2002; Puzia et al., 2004, 2005; Strader et al., 2005; Pierce et al., 2006a, b; Cenarro et al., 2007; Strader et al., 2007). GCs are particularly suitable for this analysis because they can be assumed to be simple stellar populations (SSP) where all of their stars formed at one epoch from a single cloud of gas with an almost uniform metallicity. This makes them much simpler to model than the integrated stellar populations of the diffuse light of galaxies, where many star formation events at different epochs greatly complicate analysis of the spectra.
The great promise of this approach to simplify the examination of the star formation history of galaxies is however dependent on one critical assumption: that the stellar populations of GCs are representative of the field stars that form the bulk of a galaxies’ stellar population. This would occur naturally if GCs form with some fixed proportion to those stars that form in unbound star forming regions during a star formation event and with similar element abundances. There are several observations that appear to bear out this assumption, including observations by Larsen & Richtler (2000) that show that the number of Young Massive Clusters (YMCs) correlates with the star formation rate per unit area in the galaxies that host them. These YMCs are believed to be the low redshift analogues to the star clusters that survived for a Hubble time to form the mostly old GC populations seen in galaxies today. The almost constant value observed for the number of GCs normalized to the total baryonic mass of a galaxy (McLaughlin, 1999) also provides strong support for the idea that GCs closely trace the major star formation events of a galaxy.
A more direct way to approach this issue is to examine the ensemble parameters of large numbers of GCs and compare them with those measured for the host galaxies’ diffuse light. If the GCs do indeed act as a faithful tracer of the different star formation events in a galaxy’s history, then the average GC stellar population should closely resemble that of the overall galaxy.
To date little work has been done in comparing the stellar population parameters measured from line index analyses for GCs with those determined for the host galaxy diffuse stellar component. Principally this is because at the galactocentric radii where the GCs selected for spectroscopic analysis are found, the surface brightness of the underlying galaxy halo light is very faint. In Norris et al. (2006) the stellar populations along the major and minor axes of the isolated S0 galaxy NGC 3115 were compared to the stellar populations of the GC population of NGC 3115 taken from Kuntschner et al. (2002). For this galaxy it was found that the stellar population along the minor axis at 2Re, was indistinguishable from that of the more metal rich GCs in terms of age (12 Gyr), [Z/H] (-0.5 dex) and [/Fe] (0.3 dex). Furthermore, at larger radii along the minor axis the stellar population became more metal-poor, implying that if it were possible to observe the halo stellar population at even larger radii it may begin to resemble the more metal poor GCs. These results hint at a strong connection between the formation of the spheroid of NGC 3115 and its GC system.
Ideally we would like to repeat this type of analysis for many galaxies to see how universal this behaviour is. However the large additional burden of telescope time required for the longslit measurements on top of the long exposure times required for the MOS (Multi-Object Spectroscopy) GC investigations makes this approach impractical. In this paper we present a new technique that allows us to combine both parts of this type of study into one set of observations with no extra cost in terms of telescope time. As an additional benefit, this technique can also be used to extract kinematic parameters for the host galaxy at radii well beyond those commonly achieved for standard longslit studies.
For this study we examine the galaxy NGC 3923 (see Table LABEL:tab:ngc3923_detail for details), which is a large nearby (D 21Mpc) elliptical galaxy with a prominent shell structure (Malin & Carter, 1983). NGC 3923 is the brightest galaxy of an average sized group with a low early-type fraction, perhaps suggesting that the group is dynamically young (Brough et al., 2006).
An HST ACS study of the GC system of NGC 3923 by Sikkema et al. (2006) confirmed previous observations (Zepf et al., 1994, 1995) that the GC system has a bimodal colour distribution and an unsually high specific frequency (SN5) for an early type galaxy in a lower density environment. Sikkema et al. (2006) searched for evidence of a GC sub-population formed during the merger event thought to be responsible for the creation of the shell structures. They concluded that their photometric data did not support the presence of any younger GC population with ages similar to that of the shell structures, which they believe to have formed 0.8-1.2 Gyr ago. They did however find that the bimodal V-I colour distribution and radial density profiles of the blue and red GCs were typical for old GC systems in ellipticals. Sikkema et al. (2007) used the same HST ACS data to study the shell structures of NGC 3923 finding them to be similar in colour or slightly redder than the galaxy stellar light.
Other studies have examined the stellar population and kinematics of the central regions of NGC 3923. Thomas et al. (2005) found the nuclear regions to have an age of 3.3 Gyr, [Z/H] = +0.62 and [/Fe] = 0.31, while Denicoló et al. (2005) using a similar method found values of 2.6 Gyr, [Z/H] 0.67 and [/Fe] = 0.14 respectively.
This paper is structured as follows. Section 2 provides details on the data used to investigate the GC and diffuse stellar content of NGC 3923; Section 3 describes the method used to extract extra information on the underlying galaxy spectrum from a given set of MOS observations; Section 4 briefly describes kinematic results derived using this technique, and provides an example of the line index analysis that is possible using this method. In Section 5 we discuss the implications of these results, Section 6 provides some concluding remarks.
| Parameter | Value |
|---|---|
| Right Ascension (J2000) | 11h51m01.8s |
| Declination (J2000) | -28∘48’22” |
| 287.28 | |
| 32.22 | |
| Morphological Type | E4 |
| Magnitude | 10.8 B mag |
| Major Diameter | 5.9 arcmin |
| Minor Diameter | 3.9 arcmin |
| Heliocentric Radial Velocity | 1739 9 kms-1 |
| J-Band Half-Light Radius | 43.8” |
| Table data from NED: | |
| http://nedwww.ipac.caltech.edu/ | |
| Except: | |
| 2 Micron All Sky Survey | |
| www.ipac.caltech.edu/2mass/ |
2 Observations and Data Reduction
Whilst we present a specific example using data obtained from the Gemini-GMOS instrument, the approach described here should be equally applicable to similar MOS intruments such as FORS1/2 on the VLT or LRIS/DEIMOS on Keck.
All observations described here were taken with the Gemini South Multi-Object-Spectrograph (GMOS) (Hook et al., 2004) as part of Gemini program GS-2004A-Q-9.
Pre-imaging of NGC 3923 for object selection was undertaken on 2004 January 19 and consisted of 4200s exposures in Sloan g′ and 4100s in r′ and i′ for each of 3 fields (one central, one SW and one NE of the galaxy centre). For a thorough discussion of the procedure used to reduce the pre-imaging and select GC candidates see Forbes et al. (2004) and Bridges et al. (2006). A full examination of the photometric properties of the GC system of NGC 3923 and other galaxies investigated in this project will be presented in a forthcoming paper Faifer et al. (in prep).
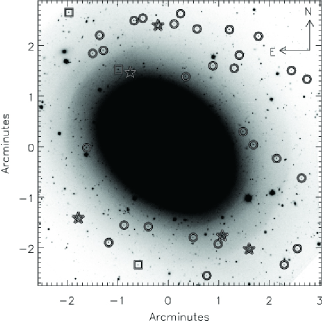
GMOS Nod and Shuffle masks were produced for each of the three fields in addition to one MOS mask for the central pointing (see Fig. 1). Since it is the MOS mask that provides the data described here, we shall leave any further discussion of the Nod and Shuffle masks and the kinematic investigation of NGC 3923 derived from them to a later paper (Norris et al. in prep.).
The MOS mask consisted of 37 slitlets of width 1 arcsec by a minimum length of 4 arcsecs. The mask was exposed using the B600_G5303 grism for 81800s at a central wavelength of 500nm and 81800s at a central wavelength of 505mn (to cover the CCD chip gaps), yielding 8 hours of on-source integration. The seeing ranged from 0.6 - 0.9 arcsec during the observations. Bias frames, flat fields and copper-argon (CuAr) arc spectra were observed throughout the observations as part of the Gemini baseline calibrations. The MOS spectra produced typically cover the wavelength range 3900-5500 Å although because the wavelength range depends on slit position, some spectra start at 3500 Å while others end at 7200 Å .
Data reduction of the MOS spectra through to the point of producing rectified and wavelength calibrated 2D spectra was accomplished utilising the Gemini/GMOS packages in IRAF as described in Bridges et al. (2006). From the CuAr arcs, wavelength calibrations with residuals 0.1 Å were achieved. The extraction of the target GC spectra from each 2D spectrum was undertaken using the APALL task in the APEXTRACT package using an optimal (variance weighted extraction). Flux calibration was achieved using GMOS longslit observations of the flux standard star LTT3864 made during the same semester with identical observational set-up.
The extraction of the NGC 3923 diffuse light spectra from the MOS slitlets was undertaken using a custom IDL script implementing the algorithm described below.
3 Method
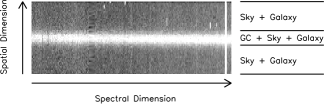
Modern multi-object spectroscopic instruments such as GMOS are capable of taking spectra of around 40 objects simultaneously over fields of view of around 66 arcmin2. Each MOS slitlet is typically around 1 arcsec wide by a few (4-10) arcsec long. Generally the GCs are unresolved from the ground producing spectra smeared over 1 arcsec (in the spatial direction) for typical seeing values. The rest of the slitlet collects background (sky + galaxy) photons used to background subtract the GC spectrum.
For the typical field of view of the current generation of MOS instruments and the distance and size of the target galaxies being investigated by these studies, it can be seen that significant amounts of target galaxy flux are contained in the MOS slitlets being used to study the GCs (See Fig. 1). The flux incident on each slitlet can then be thought of as a sum of contributions from the target GC, the actual sky background (both atmospheric and extra-galactic) and a contribution from the diffuse light of the target galaxy. Fig. 2 shows an example of a typical 2D MOS spectrum, showing the regions containing the different contributions to the flux. If the instrument has a sufficiently large field of view, it is possible to place a slitlet at large galactocentric radii where the spectrum measured would be essentially a pure sky spectrum, uncontaminated by galaxy flux. This sky spectrum could then be subtracted from the background regions of each of the GC slitlets to produce a sky-subtracted galaxy diffuse light spectrum for each of the individual slitlets. We have successfully utilised this approach in a study similar to this one involving the GC system of NGC 524, finding that slitlets located beyond 5Re provide an adequate sky spectrum.
In practice the FOV of the current generation of MOS instruments is often too small to allow a slitlet to be located at large enough galactocentric radii to produce a “pure” sky spectrum of the accuracy required (at least for stellar population studies).
Here we present an algorithm that allows the calculation of the sky spectrum even in cases with small FOV, by combining the spectroscopic dataset with wider field imaging data.
3.1 Algorithm
-
•
The spectra are reduced as normal to the point where the individual spectra are cut out, rectified and wavelength calibrated. See Bridges et al. (2006) for more details of the reduction used for the data presented here.
-
•
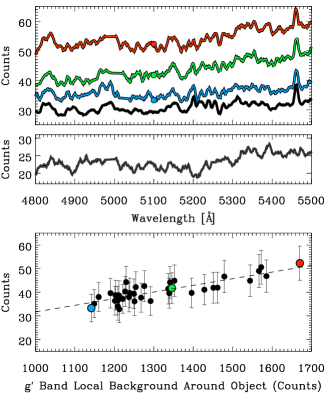
A sky + galaxy spectrum is produced for each slitlet. The spectra are produced using the usual method for calculating a sky spectrum from a 2D slitlet (i.e the spectrum used to sky subtract a 2D frame). Fig. 3 displays three such sky + galaxy spectra for a range of galactocentric radii; as is expected those spectra taken from slits which lie closer to the galaxy centre contain more flux.
-
•
Each spectrum is rebinned onto a uniform wavelength scale.
-
•
The wider field pre-imaging is combined to produce a master wide field image of the target galaxy. In this case we make use of our g′ band imaging as this best matches the wavelength coverage of our spectra, though we note that if our i′ band imaging is used instead we obtain line indices which differ by less than 0.1 Å. We caution however that care should be taken to ensure that observed optical light profile being used should match that of the spectral region being examined. i.e. that the use of an IR image to set the scaling for optical spectra is probably unwise because of the different photometric profiles displayed by galaxies in the different wavelength regimes.
-
•
Using the master image of the field, the local background in an annulus around each of the target GCs is calculated.
-
•
The actual sky background number of counts in the image is measured for a region located at large galactocentric radii. Experience with the data for NGC 3923 showed that this value was always very similar to the local background measured for the GC with the largest galactocentric distance.
-
•
For each wavelength pixel of the rebinned spectra the number of counts is plotted against the local background around the corresponding object determined from the wide field image. (See Fig. 3 for the pixels corresponding to 5100 Å ). As can be seen in the lower panel of Fig. 3 the correlation of local background with number of counts in the spectra is reasonably good. This correlation can then be fit with a simple straight line and extrapolated to the value calculated for the sky background at large radius from the wide field image. In the example in Fig. 3 the value of the sky brightness measured at large radii to represent the uncontaminated sky value was around 1000 counts in the g’ band, leading to an estimate of the “pure” sky spectrum having around 32 counts in the pixel located at 5100 Å .
-
•
When repeated for each wavelength pixel, this procedure results in a spectrum that is a good approximation of a “pure” sky spectrum. Note that the produced sky spectrum is only accurate in the regions where a significant number of the spectra overlap in wavelength coverage. In the case of our GMOS data this restricts our analysis of the galaxy spectra to the wavelength range 4400 - 5500 Å where the majority of the 37 input spectra have coverage.
-
•
Each of the 37 rebinned sky + galaxy spectra are then sky subtracted using the “pure” sky spectrum, leaving 37 spectra that are essentially pure galaxy spectra. The spectra measured from individual exposures can then be combined in the usual manner; examples of 3 of the spectra produced by combining 16 individual exposures can be seen in Fig. 4.
In cases where wider field imaging is not available it is possible to obtain similar results using an iterative procedure. In this case an initial guess for the sky brightness assumed to represent pure night sky is made (by extrapolating the observed galaxy profile for instance) and the entire procedure from steps 6 to 8 can then be iterated with the assumed night sky brightness being varied until sky line residuals in the final diffuse light spectra are minimised.

3.2 Kinematics
GC radial velocities were measured using the FXCOR task in the RV package of IRAF. We did not observe radial velocity standard stars as part of this investigation due to the extra overhead in observing time this requires. For templates we therefore use spectra from the simple stellar population library of Vazdekis (1999). These templates span a range of age of 1-18 Gyr and a metallicity range from [Fe/H] = +0.2 to -0.7. To this sample we add 6 stellar spectra from the Jones (1997) library to extend the metallicitiy range covered by the templates to [Fe/H] -1.5. This wide range of age and metallicity helps to minimise the effects of template mismatch on the measured velocities. We use a 3 sigma clipped mean of the velocities derived from these templates as the final velocity for each GC. The errors are estimated from the mean of the errors measured by FXCOR for those velocities not removed by the clipping procedure.
Objects with velocities in the range 1200-2400kms-1 are assumed to be associated with NGC 3923 and were classified as GC. We find that 29 out of 37 (78) objects observed with our MOS mask have velocities within this range. Of the remaining objects, 2 were z0.3 galaxies, one was a z1.3 quasar and 5 were Milky Way stars.
The recessional velocities of the NGC 3923 diffuse light spectra were measured using the publicly available IDL implementation of the pPXF method (Cappellari & Emsellem, 2004). This method was chosen as it allows a simultaneous measurement of the radial velocity and velocity dispersion from the spectrum, both of which are important in studies of the diffuse light of galaxies. In this instance the spectra were fit in pixel space over the wavelength range 4800-5400 Å using the same templates as the GCs. The final velocity and velocity dispersion for each slitlet is taken to be the mean of the velocities/velocity dispersions determined from 100 Monte-Carlo resimulations of the input spectra with added photon noise. The error in the measured velocity is taken to be the dispersion in the 100 best fit velocities. As a check of consistency we remeasured the recessional velocity of the diffuse light spectra using the FXCOR task in IRAF and found no significant differences between the two methods.
3.3 Line Indices
By binning all of our 37 diffuse light spectra together we have produced one spectrum of sufficient signal-to-noise (S/N 60 per Å) to measure accurate absorption line indices. Since NGC 3923 shows evidence of slight rotation (Fig. 5) it is necessary to remove the effects of rotation on the spectra by correcting the spectra to some common velocity before coadding them. In this instance the velocity of each of the 37 spectra was measured as described previously, then using the DOPCOR task in IRAF each of the spectra was de-redshifted to zero redshift before combining.
For ease of comparison with other studies we have chosen
to use the Lick/IDS system when examining the stellar
population present in this master spectrum and in our GC
sample. There are several steps that must be taken to ensure
that our measured indices are securely on the Lick/IDS
system (Worthey &
Ottaviani, 1997; Trager et al., 1998).
The first is to convolve our spectra with a
wavelength dependent Gaussian kernel to reproduce the
variable Lick/IDS resolution of 9-11 Å .
We then measure the Lick/IDS indices for our fluxed spectra
using the wavelength definitions from
Worthey &
Ottaviani (1997), Trager et al. (1998) and the INDEXF index measuring
code of N Cardiel111Available at:
http://www.ucm.es/info/Astrof/software/indexf/indexf.html.
Uncertainties on the measured
indices are a combination of errors introduced by photon
(both target and sky) noise and errors in the measured redshift
of the spectra (essentially negligible in all cases).
The line indices for the spheroid spectra must also be corrected for the smearing effects of the line-of-sight velocity distribution (LOSVD). This effect is entirely negligible for GC spectra with velocity dispersions of the order a few kms-1, but cannot be ignored for galaxies with velocity dispersions over 100 kms-1. As our measured diffuse light spectrum has a velocity dispersion of around 200 kms-1 this step is important. We correct for this effect using the procedure of Kuntschner (2004) which can also be used to correct line indices for the additional influences of the higher order LOSVD terms h3 and h4. Kuntschner (2004) provides a new parameterisation for the LOSVD line strength corrections derived by determining the difference in measured Lick/IDS line strengths measured from template spectra before and after convolving with various choices of , h3 and h4. For NGC 3923 the correction for h3 and h4 is not implemented due to the effect of the correction given the measured values of , h3 and h4 being minimal relative to the other errors.
The final step required to firmly fix our measurements to the Lick/IDS system is to measure standard stars from the Lick library using our observational set-up and compute offsets between the two. Although we did not observe Lick standard stars directly during this project, due to the prohibitive cost in observing time, data collected as part of GS-2003B-Q-63 to calibrate GMOS-S onto the Lick system were kindly made available by Bryan Miller. We have used a set of 28 stars from this sample, taken with an almost identical set-up to our MOS observations and used them to derive offsets for GMOS-S to the Lick system. We have applied these offsets to our measured line indices presented in Table LABEL:tabobs. We note that while useful for comparison between observations taken using different instruments, or for comparing measured indices to models based on the Lick/IDS system e.g. Thomas et al. (2003, 2004), this step is not essential for a simple first order differential comparison between two sets of observations made with the same instrument, such as that described here.
Using the procedure outlined (neglecting the higher order LOSVD corrections) we have measured Lick/IDS line strength indices for all 29 of our confirmed GCs, as well as our single coadded spheroid diffuse light spectrum. This single diffuse light spectrum is located at a luminosity weighted distance of 3 Re (throughout we use Re=43.8 arcsec measured in the J-band (Jarrett et al., 2003), though we note that V, R and I band estimates from Bender et al. (1988) are essentially identical). The S/N of our GC spectra range from 11-56 per Å measured in the region 5100-5150 Å , giving errors in the H index of 0.12-0.72 Å .
4 Results
Table LABEL:tabobs presents velocities and Lick/IDS line strength indices for all 29 of our confirmed GCs, as well as the single coadded diffuse light spectrum, and a series of GC composite indices binned by g′-i′ colour. In addition to examining the GC spectra we have extracted 37 diffuse light spectra from our MOS exposure (see Fig. 4 and Table LABEL:tabkin) with signal-to-noise ranging from 5 to 12, which is sufficient to measure velocities in all cases and velocity dispersions in most cases.
4.1 Kinematics
A more detailed discussion of the kinematics of NGC 3923 and its GC system will be presented in Norris et al. (in prep), where we include GC velocities from additional masks at larger radii obtained using the Nod and Shuffle technique (Cuillandre et al., 1994).
In this section we limit ourselves to examining the spheroid of NGC 3923 for rotation and in Section 4.2 to comparing the velocities measured for the spheroid of NGC 3923 and those measured for the GCs examined in the same slits.
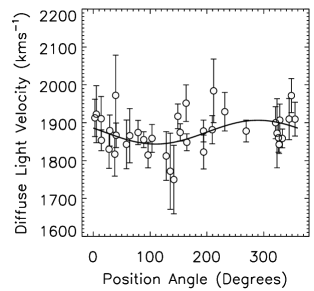
Here we present the results of our search for evidence of
rotation in the diffuse stellar halo of NGC 3923
(see Fig. 5) by carrying out a non-linear least
squares fit to the equation:
V() = Vrotsin( - 0) + V0
where V() is the velocity measured for the
diffuse light in each slitlet, Vrot is the
amplitude of the projected rotation velocity, V0
the systematic velocity of NGC 3923, the azimuthal
angle of each slitlet relative to the galaxy major axis
and 0 is the position angle of the line of
nodes. This approach determines the best-fitting
simple flat rotation curve (see Zepf et al. (2000) for details).
We find evidence for rotation along the major axis of NGC 3923, with the best fitting amplitude being 31 13 kms-1 along a position angle of 290 19∘ where the major axis is approximately at PA = 315∘. This result is in good agreement with that of Koprolin & Zeilinger (2000) who found a small (53 13 kms-1) but non negligible major axis rotation for NGC 3923. It is however different to the results of Carter et al. (1998) who found that the inner 25 arcsec of NGC 3923 showed no rotation on its major axis but had minor axis rotation of amplitude 20 kms-1. The difference in conclusions between the different studies may be attributed to the different radial ranges over which they are sensitive; our method provides a measurement of the rotation of the galaxy at a radius at least a factor of two greater than the largest radial point available to either Carter et al. (1998) or Koprolin & Zeilinger (2000).
These measurements of the kinematics of NGC 3923 cover a range in effective radii of between 2 and 4 Re, demonstrating the great power which this approach has for illuminating the kinematics of the outer regions of galaxies.
4.2 Reliability of Velocities
One concern with our procedure for extracting diffuse host galaxy spheroid light from the same slitlets as the target GC spectra is that the spheroid spectra could be contaminated by flux from the target GCs. In general this should not be of major concern due to the careful selection of the sky regions of the 2D spectrum. As a test of this assumption in Fig. 6, we plot the measured diffuse light velocity against the target velocity (GC, Milky Way star, background galaxy or QSO) from the same slitlet. In Fig. 6 the filled circles are target objects classified by their velocities as GCs, filled stars are objects classified as Milky Way stars, the three background objects (two z0.3 and a z1.3 QSO) are omitted from the plot for clarity, although they are included in the fit which produces the dashed best fit trend line (which has slope equal to zero within the errors). As can be seen clearly, there is no correlation between the velocities measured for the target spectra and those measured for the diffuse light; in particular even for the brightest target objects (generally the MW stars) the measured velocity for the spheroid of NGC 3923 is still consistent with the recessional velocity of NGC 3923. This indicates that contamination of the diffuse light spectra by the target object spectra is negligible.

4.3 Stellar Populations
In this section we examine the stellar populations of the GCs and the diffuse light of NGC 3923. To begin we shall discuss some of the qualitative properties of the stellar populations through examination of age-metallicity diagnostic plots. We shall then examine the data more quantitatively by presenting the ages, metallicities and -element abundances derived through fitting of the data to stellar population models.
4.3.1 Index-Index Plots
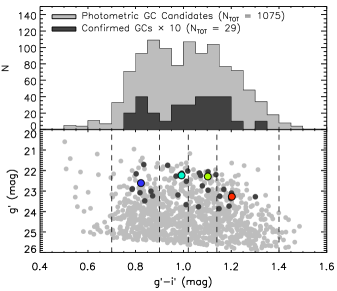
In the left panel of Fig. 7 we present an Mg vs. Fe plot222Fe = (Fe5270 + Fe5335)/2. (González, 1993) for the 29 GCs as well as the NGC 3923 diffuse light spectrum measured in this study. Model predictions from Thomas et al. (2003, 2004) are overplotted for [/Fe] = 0.0, 0.3 and 0.5, ages 1-12 Gyr and metallicity running from -2.25 (bottom left) to +0.67 (top right). This choice of indices produces a figure which is insensitive to age but can be used to constrain the metallicity and -element abundance ratios (Kuntschner et al., 2002). As can be seen the GCs (light grey circles) have metallicities ranging from -1.7 to +0.5 and appear to have a wide range of -element abundance ratios. When the GC data is binned by colour (coloured circles) the behaviour of the binned data becomes more systematic, with the points showing a clear preference for a constant element abundance ratio of 0.3, even as the metallicity of the binned data decreases from around 0.0 to -1.5. These bins cover the range of colour displayed by the majority of extragalactic GCs, and have mean g′ - i′ colour of 0.82, 0.99, 1.09 and 1.19 (See Table LABEL:tabobs). The position of the mean colour of each bin relative to the peaks of the blue and red GC distributions can be seen in Fig. 8. In particular the mean colour of the third bin can be seen to correspond closely to that of the peak of the red GC distribution. If all the GC data are combined to produce a composite GC data point (white triangle); the combined GC spectrum has a metallicity of -0.8 and an abundance ratio consistent with 0.3 within the (significant) errors. It is interesting that both the central regions of NGC 3923 measured by Trager et al. (1998) and Beuing et al. (2002) (grey triangle and square) and the NGC 3923 diffuse light spectrum measured in this study (white star) also lie along the same [/Fe] = 0.3 track. However the fact that the data point from Denicoló et al. (2005) (black triangle) for the central Re/8 of NGC 3923 is offset relative to the other two observations illustrates the magnitude of possible systematic errors in this type of study. The difference in metallicity between the inner nuclear data and our large radii diffuse stellar data point can be understood in terms of a radial metallicity gradient in the galaxy. A further point of note is the close agreement between the mean of the GC spectrum and the NGC 3923 diffuse light spectrum which was measured at the same projected radii.
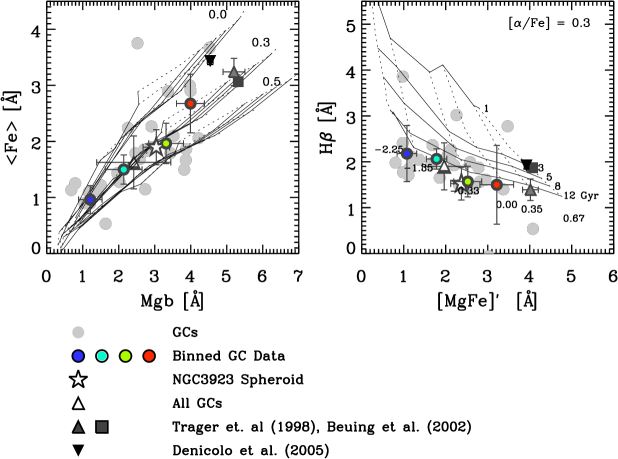
The right panel of Fig. 7 presents an [MgFe]′ vs H age-metallicity plot333[MgFe]′ = (Thomas et al., 2003) with symbols as previously defined. Here it is necessary to choose a fixed value of [/Fe] for the grids and we have chosen 0.3 as this value is close to that found for each of the populations described in the previous section. It can be seen that three GCs appear to lie along grid lines consistent with young or intermediate ages, these objects are however generally among the lowest S/N objects in our sample. When other age-metallicity diagnostic plots (H and H vs. [MgFe]’) are considered as well as the fact that similar numbers of objects lie below the grid it appears that these objects may just be statistical outliers in a distribution centred on uniformly older ages. We shall return to this point when examining the results of the fitting approach. The binned GC data again behaves in a systematic manner, in which all the data points lie along a constant age line of around 12 Gyr, with metallicities consistent with those seen in the previous plot. The mean of the GC system as a whole and the NGC 3923 diffuse light point can also be seen to be very consistent in terms of age and metallicity.
The close agreement in apparent age, metallicity and [/Fe]
between the NGC 3923 diffuse light spectrum measured at 3 Re
and the GC system (especially the red GCs) at the same projected
radii is tantalising. Such close agreement hints at a deep connection
between the two populations exactly as would be expected if the
two populations formed coevally from the same material.
This interpretation is however dependent on the assumption
that the GCs examined here are representative of the full GC population.
We believe that our sample is
a fair match to that present in NGC 3923 over the range of projected
radii studied, though only observation of a significantly
larger sample of GCs carefully chosen to match the full sample
in terms of colour and luminosity would allow us to determine this for
certain.
4.3.2 Derived Stellar Population Parameters
We derive ages, metallicities and -element abundances for the stellar populations being studied here using the multi-index fitting method of Proctor & Sansom (2002) and Proctor et al. (2004). This technique compares the measured Lick indices with SSP models, in this case the SSP models of Thomas et al. (2003, 2004) (TMK04) which to date remain the only SSP models in which the effects of -element abundance ratios on Balmer line indices at low metallicity are included. For a more thorough description of the different treatments of -element abundance ratios in modern SSP models see Mendel et al. (2007).
The procedure used to determine the best fitting SSP model is as follows. The total set of measured Lick/IDS indices is compared to the TMK04 SSPs and a minimum fit obtained; simultaneously a set of minimization fits are determined with each of the indices omitted. The lowest total fit from this set is then chosen, the necessary index removed and the process repeated until a stable fit is arrived at where no highly aberrant (3) indices remain. In this instance all GCs displayed some indices which were sufficiently aberrant to be excluded from the fit, though all fits utilised a minimum of 9 indices, most GCs are fit with at least 13 indices. Errors in derived parameters are determined via monte-carlo re-simulations of the input index measurements with their measured errors. The results of this procedure are displayed in Table LABEL:tabres.
In common with previous studies we find that the molecular bands Mg1 and Mg2 appear depressed, an observation generally explained as being due to problems with flux calibration. We have tested this explanation by examining the effect of using the flux calibration curves found from repeat observations of the same standard star (in this case LTT4364) observed for a different program using the same observational set up used here. We found that even when using curves derived from the same standard star the measured Mg1 and Mg2 indices of our GCs after flux calibration could vary systematically by as much as 0.01 mag, which is of the same order as the deviations observed in our fitting procedure. Other indices were much less affected by the change in flux calibration, presumably due to the much narrower wavelength coverage of these indices. Accordingly Mg1 and Mg2, as well as Ca4227 which was similarly depressed, were therefore removed from our fitting procedure. The CN indices tended to be enhanced relative to the models, in agreement with previous findings (Beasley et al., 2004; Pierce et al., 2006a) for GCs. The Ca4668 index also tended to be unreliable and was therefore excluded from the fits.
Our quantitative fitting procedure produces results in good agreement with the more qualitative discussion in the previous section. We find the GCs examined to have ages consistent at the one sigma level with old ages (10 Gyr) in all but one case. The GCs exhibit a spread of metallicities from [Z/H] = -1.8 to +0.35 and -element enhancement ratios generally consistent with 0.3 dex, although several objects display [/Fe] of below zero or greater than 0.5, at the limits of the models. From our sample of 29 GCs only one object (ID: 197) displays an age which is inconsistent with a mean age greater than 10 Gyr, however this result is not significant being only a 1.5 deviation. A more thorough analysis of the distribution of stellar population parameters is somewhat limited by the small sample size, however to first order we can state that the distribution of ages is consistent with a single value of around 12Gyr plus measurement errors. The distribution of metallicity however is inconsistent at the greater than 99.9 significance with having a single value plus measurement errors. We find that the distribution of metallicity measured is consistent with a mean of -0.65 dex with an intrinsic scatter of 0.5 dex plus measurement errors, assuming a gaussian distribution of metallicities. Similarly the distribution of [/Fe] is also inconsistent with a single value plus measurement errors at the greater than 99.8 significance level, in this case we estimate an intrinsic scatter of 0.12 dex plus measurement errrors around a mean of 0.31 dex.
We have repeated this analysis for our binned GC data and for the line indices measured for the diffuse light halo of NGC 3923. We find that the binned GC data again behaves in a manner consistent with the more qualitative examination of the index-index plots. All bins have ages consistent with being older than 10 Gyr, all four bins display a smoothly increasing metallicity with colour, ranging from [Z/H] = -1.375 to -0.125, and all display [/Fe] consistent with 0.3. The considerably larger errors present in the measured parameters for the reddest colour bin, are a result of this bin being composed almost entirely of lower luminosity and hence lower S/N objects. Apparently through chance selection this bin contains GCs of considerably lower lumnosity than the average for GCs examined spectroscopically here (see Fig. 8). This results in a mean g′ magnitude fully half a magnitude below any of the other bins; together with the effect of error weighting the indices when combining them this explains why this bin is significantly lower S/N than the others.
Our “Super GC” bin, containing the error weighted indices of all 29 GCs unsurprisingly predicts ages, metallicities and -element abundances in good agreement with those of the colour binned GCs. We derive an old age for the GC population as a whole, a metallicity [Z/H] = -0.8 and an -element abundance ratio which is consistent with 0.3.
Turning our attention to the measured parameters for the diffuse light of NGC 3923 at 3Re we again find old ages, metallicity [Z/H] of -0.325 and [/Fe] of 0.34. These results are entirely consistent with that found for the red bin of GCs (see Fig. 9), those GCs displaying g′-i′ colours in the range 1.02 to 1.14.
4.3.3 Stellar Population Parameter Corellations
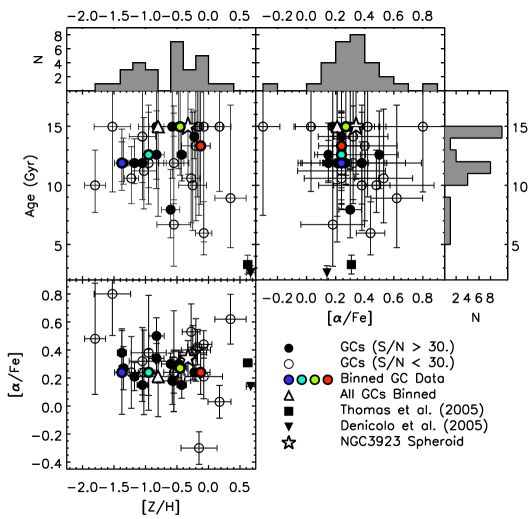
In Fig. 9 we search for correlations between the ages, metallicities and alpha-element enhancements measured for the various stellar populations using the fitting procedure outlined previously.
One interesting observation is that we see no evidence for the observed trend of decreasing [/Fe] with increasing metallicity seen in the GC systems of some galaxies (e.g. NGC 3379 (Pierce et al., 2006a), NGC 4649 (Pierce et al., 2006b)), but not in others (NGC 1407 (Cenarro et al., 2007), VCC1087 (Beasley et al., 2006)).
Another interesting feature visible in our higher S/N data (filled circles) is that the Thomas et al. (2003, 2004) models tend to introduce a slight trend of increasing age with increasing metallicity. This trend, which has been previously observed in the NGC 1407 system (Cenarro et al., 2007) and the MW GC system (Cenarro et al., 2007; Mendel et al., 2007) appears to be a peculiarity of the Thomas et al. (2003, 2004) models; Mendel et al. (2007) found that the Lee Worthey (Lee & Worthey, 2005) and Vazdekis (Vazdekis, 2007) SSP models do not display this trend. However as the age determinations at the lowest metallicities are already highly uncertain due to the possible effects of horizontal branch morphology, this effect is not significant and does not affect our conclusions.
5 Discussion
In summary, we have obtained spectra of 29 GCs associated with NGC 3923, as well as 37 spectra of the diffuse light at radii of 2-4 Re. By combining these 37 diffuse light spectra we have produced a single spectrum with a luminosity weighted distance of 3 Re of sufficient S/N to determine an age, metallicity and -element abundance ratio by comparison with Lick line strength indices for Simple Stellar Population models.
We find evidence for slight rotation of amplitude 3113 kms-1 in the spheroid of NGC 3923 between 2 and 4 Re approximately along the major axis of the galaxy.
All 29 GCs examined in this study are consistent with being old (10 Gyr) and none display any persuasive evidence for being young enough to be associated with the shell forming event. Our results therefore support the conclusions of Sikkema et al. (2006) who, using HST ACS photometry for the GC system of NGC 3923, found no evidence of a young GC subpopulation.
The GCs examined display a wide range of metallicity from [Z/H] = -1.8 to +0.35. In contrast to other studies (Puzia et al., 2005; Pierce et al., 2006a, b) we find no evidence for a significant subpopulation of GCs with extremely high ([/Fe]0.5) -element abundance ratios. Our data also do not show any clear tendency for -element abundance to increase with decreasing metallicity as had been found in these studies. It must be noted however that -element abundance ratios are not well constrained at low metallicity and that the results of these previous studies may be consistent within the errors with a universal value of [/Fe] = 0.3. In agreement with both these studies and with measurements of the Milky Way GC population we find that the majority of our GCs with accurate abundance ratios have [/Fe] consistent with 0.3.
The stellar population of the diffuse light of NGC 3923 between 2 and 4Re is entirely consistent in age, metallicity and -element abundance ratio with the red GC population. It also agrees within the respective errors with the mean of the GC population examined spectroscopically; however, there is a slight difference in metallicity for the mean of the total GC population and the stellar population of the diffuse light of the galaxy. With the current sample size, it is impossible to determine if this offset is real or merely the result of a statistical fluctuation.
This similarity between the stellar populations of the spheroid of NGC 3923 at large radii and the redder GCs is in good agreement with previous findings, both spectroscopic (in NGC 3115; Norris et al. (2006)) and photometric (in NGC 4649; Forbes et al. (2004)), and supports the view that the two populations formed coevally.
The fact that the stellar populations of the GCs studied here do not match those of the inner regions of NGC 3923 is most likely due to the fact that GC systems are observed to display variation in the mix of red and blue populations with radii. Therefore the GC populations which make up the region between 2-4Re are not likely to be the same as those that inhabit the inner regions of the galaxy. Additionally GCs are thought to be vulnerable to disruption by tidal effects within the inner regions of galaxies meaning that projection effects become a more serious issue at smaller galactic radii, with GCs at large radii projected onto the inner regions of the galaxy becoming more important.
By comparing our stellar population parameters for the spheroid of NGC 3923 at large galactocentric radii with those of the inner regions of NGC 3923 measured by Thomas et al. (2005) (using the index measurements of the inner Re/10 by Beuing et al. (2002)) and Denicoló et al. (2005) (using index measurements of the inner Re/8), we find evidence for metallicity and age gradients in the spheroid of NGC 3923 but no evidence of an [/Fe] abundance ratio gradient. Specifically Thomas et al. (2005) find a luminosity weighted age for the central region of the galaxy of 3.3 Gyr, a metallicity of [Z/H] = 0.62 and [/Fe] = 0.31. This is in good agreement with the conclusions of Denicoló et al. (2005) who find an age of 2.6 Gyr, metallicity of [Z/H] 0.67 and a slightly lower value of [/Fe] of around 0.14. This close agreement is to be expected as both studies make use of the same TMK04 models to derive their stellar population parameters. We see therefore that the outer regions of NGC 3923 are considerably older, less enriched in metals, but have a similar -element abundance ratio as the inner regions of the galaxy. The first two points are not unexpected considering that the values for Thomas et al. (2005) and Denicoló et al. (2005) are provided for apertures of Re/8, and our spectroscopy of the spheroid of NGC 3923 has a luminosity weighted effective radius of 3Re.
Such a situation is very similar to that found for the isolated elliptical NGC 821 by Proctor et al. (2005) using longslit spectroscopy. In this case Proctor et al. (2005) found that NGC 821 displayed a strong gradient in both metallicity and age, in the sense that metallicity decreases with radius and age increases with radius. As in NGC 3923 the galaxy displays a constant value of [/Fe] close to 0.3. NGC 3923 and NGC 821 display similar metallicity gradients of -0.7 dex/logR but the normalisation for NGC 3923 is shifted to higher metallicities than in NGC 821. As discussed in the case of NGC 821 (Proctor et al., 2005), this high value of the metallicity gradient tends to rule out merger models for the formation of NGC 3923, as merger models predict lower values for the metallicity gradient due to the violent mixing that takes place during mergers tending to wash out gradients (Kobayashi, 2004).
Another scenario considered by Proctor et al. (2005) to explain the formation of NGC 821 is where a minor merger event funnels gas to the inner region of the galaxy producing a minor star formation event and adding a layer of “frosting” to the majority older population already present. This star formation event presumably did not produce a significant number of star clusters stable enough or at large enough galactocentric radii for them to survive and be detectable at the present time. This scenario for the formation of NGC 821, can also be applied to the formation of NGC 3923, where it can naturally explain the formation of the shell structures. However the same problem that caused Proctor et al. (2005) to reject this explanation in the case of NGC 821 still applies to our NGC 3923 data, namely that the gas forming the new stars would presumably be of different metallicity and -element abundance than the galaxy at these radii– it would then have to form stars over the correct timescale, with the appropriate enrichment such that they appeared to fall exactly on the trends of metallicity and -element abundance that the rest of the galaxy exhibits. This appears to require an unlikely amount of fine tuning, however recent work by Serra & Trager (2007) shows that when examining a composite stellar population using SSP models, it is the young component which dominates the age determined for the composite. They further find that the chemical composition (metallicity and [/Fe]) of the best fit SSP model closely follows that of the older population which dominates the mass. This explanation would also not rule out the young age of around 1 Gyr determined by Sikkema et al. (2006) for the shell features of NGC 3923, as any 1 Gyr stellar population present in the inner regions could, with the correct choice of mass fraction, appear to be around 3 Gyr, when combined with a majority older stellar population.
A final possible formation scenario considered by Proctor et al. (2005) to explain the formation of NGC 821 is that the gas for the recent starburst is fuelled by gas from the galaxy itself, perhaps through gas cooling smoothly onto an inner disc. High spatial resolution IFU observations of the inner regions of NGC 3923 would help to search for the signatures of such a structure. Serra & Trager (2007) note that if high enough S/N spectroscopy is available it is possible to disentangle the different stellar populations present through examination of the discrepancy between the SSP parameters determined using different Balmer-line indices. This result therefore provides a possible route to determining the relevance of these models for the formation of NGC 3923.
6 Conclusions
We have obtained low-resolution spectra of 37 GC candidates around the shell elliptical NGC 3923 using the GMOS on Gemini-South. By examination of the radial velocities of the targets we find that 29 are GCs associated with the target galaxy. Making use of a new technique of extracting integrated spectra at extremely low surface brightness levels we have determined kinematic properties for the diffuse light of NGC 3923 out to around 200 arcsecs on both major and minor axes, corresponding to half light radii in the range 2-4Re. We find evidence for low amplitude rotation along the major axis of around 30kms-1. The detailed kinematic properties of NGC 3923 (including its observed velocity dispersion in this range) and its GC system will be studied in more detail in a forthcoming paper.
We have measured the ages, metallicities and [/Fe] ratios of the 29 GCs and compared them to those found found for the diffuse light of NGC 3923 at the same projected radii. We find all of our GCs to have old ages (10 Gyr), with metallicities running from [Z/H] = -1.8 to +0.35 and -element abundance ratios generally consistent with a constant value of [/Fe] = 0.3. We see no evidence in our data for the existence of a younger population of GCs associated with the 1 Gyr old merger event proposed to have produced the shell system of NGC 3923. The diffuse light of NGC 3923 is observed to have properties indistinguishable from those of the more metal rich (and redder) GCs.
Our results provide support to the theory that the spheroids and GC systems of galaxies are produced during the same star formation events, and that the study of the stellar populations of GC systems can provide important insights into the stellar populations of galaxies at galactocentric radii which at present are difficult to study using direct measurements of their integrated light.
| ID | R.A. | Dec. | g′ | g′–r′ | g′–i′ | V | H | Mg | Fe5270 | Fe5335 |
|---|---|---|---|---|---|---|---|---|---|---|
| (J2000) | (J2000) | (mag) | (mag) | (mag) | (km/s) | (Å ) | (Å ) | (Å ) | (Å ) | |
| 228 | 11:50:49.2 | -28:46:58.0 | 22.92 | 0.57 | 0.79 | 158766 | 3.860.29 | 0.680.31 | 1.760.34 | 0.510.40 |
| 253 | 11:50:50.1 | -28:50:19.0 | 23.08 | 0.64 | 0.82 | 220374 | 1.980.32 | 1.640.35 | 0.230.39 | 0.840.42 |
| 197 | 11:50:49.7 | -28:48:55.5 | 22.75 | 0.77 | 1.08 | 172729 | 1.870.25 | 3.870.25 | 2.170.27 | 1.560.30 |
| 279 | 11:50:51.3 | -28:50:38.1 | 23.10 | 0.83 | 1.20 | 180741 | 1.400.32 | 4.000.33 | 2.770.35 | 3.030.36 |
| 112 | 11:50:52.0 | -28:48:32.2 | 22.27 | 0.71 | 0.97 | 176326 | 2.260.18 | 2.590.19 | 1.800.21 | 1.570.23 |
| 394 | 11:50:50.7 | -28:46:47.9 | 23.48 | 0.58 | 0.84 | 185169 | 1.710.47 | 0.790.49 | 1.950.52 | 0.550.61 |
| 106 | 11:50:53.6 | -28:46:07.1 | 22.13 | 0.69 | 0.99 | 173326 | 1.960.16 | 1.960.17 | 1.360.18 | 1.500.21 |
| 64 | 11:50:54.1 | -28:48:15.8 | 21.75 | 0.68 | 0.93 | 177027 | 2.050.13 | 1.500.13 | 1.270.15 | 1.170.17 |
| 86 | 11:50:56.3 | -28:45:59.3 | 22.02 | 0.70 | 1.02 | 178422 | 2.130.15 | 2.470.15 | 1.570.17 | 2.000.18 |
| 311 | 11:50:57.7 | -28:46:42.1 | 23.19 | 0.70 | 0.98 | 166643 | 2.160.35 | 2.250.39 | 1.680.40 | 2.800.44 |
| 333 | 11:50:58.3 | -28:50:51.0 | 23.25 | 0.82 | 1.15 | 192555 | 2.780.40 | 3.970.42 | 3.100.44 | 2.900.48 |
| 247 | 11:50:57.3 | -28:50:13.5 | 23.01 | 0.66 | 0.86 | 182948 | 2.360.31 | 2.020.33 | 1.570.36 | 0.990.43 |
| 99 | 11:50:55.0 | -28:48:00.3 | 22.12 | 0.75 | 1.07 | 165422 | 1.420.17 | 2.910.18 | 2.170.19 | 2.360.20 |
| 322 | 11:50:55.4 | -28:46:29.5 | 23.24 | 0.64 | 0.87 | 209950 | 1.860.40 | 1.170.41 | 1.110.44 | 1.080.49 |
| 498 | 11:50:55.8 | -28:46:45.1 | 23.76 | 0.72 | 1.06 | 160049 | -0.060.60 | 2.520.62 | 3.490.62 | 4.020.65 |
| 221 | 11:51:04.1 | -28:45:45.6 | 22.89 | 0.59 | 0.79 | 180553 | 2.110.29 | 1.410.30 | 0.870.33 | 1.380.38 |
| 110 | 11:51:04.9 | -28:45:48.5 | 22.24 | 0.72 | 1.07 | 155024 | 1.450.18 | 2.900.18 | 2.140.19 | 1.650.22 |
| 232 | 11:51:00.2 | -28:46:55.0 | 22.96 | 0.71 | 1.10 | 180830 | 1.490.31 | 2.710.31 | 2.170.34 | 1.550.38 |
| 225 | 11:51:03.6 | -28:49:53.0 | 22.92 | 0.81 | 1.17 | 192637 | 1.570.28 | 4.220.29 | 1.660.32 | 2.450.34 |
| 360 | 11:50:59.5 | -28:50:05.8 | 23.37 | 0.80 | 1.20 | 147639 | 1.610.40 | 3.370.48 | 2.190.46 | 3.600.48 |
| 332 | 11:51:05.8 | -28:49:51.3 | 23.28 | 0.85 | 1.30 | 163941 | 0.540.43 | 4.520.40 | 3.670.41 | 3.670.43 |
| 108 | 11:51:07.2 | -28:50:11.9 | 22.20 | 0.77 | 1.14 | 204632 | 1.410.18 | 3.520.18 | 1.880.19 | 2.320.21 |
| 450 | 11:51:00.7 | -28:45:40.3 | 23.66 | 0.71 | 1.01 | 211439 | 3.020.54 | 2.790.56 | 1.800.58 | 1.880.65 |
| 513 | 11:51:01.2 | -28:45:52.5 | 23.86 | 0.71 | 1.15 | 167161 | -1.100.73 | 3.860.63 | 1.530.71 | 1.810.76 |
| 492 | 11:50:59.2 | -28:45:58.4 | 23.73 | 0.84 | 1.19 | 174650 | 1.990.53 | 3.430.54 | 2.130.58 | 1.450.64 |
| 167 | 11:51:08.0 | -28:46:06.0 | 22.52 | 0.71 | 1.01 | 180622 | 1.650.22 | 2.740.22 | 1.410.24 | 0.880.28 |
| 65 | 11:51:07.6 | -28:46:23.9 | 21.71 | 0.64 | 0.83 | 229530 | 1.770.13 | 1.200.14 | 0.700.15 | 1.090.17 |
| 104 | 11:51:08.6 | -28:46:27.4 | 22.16 | 0.59 | 0.80 | 215245 | 2.410.17 | 1.050.18 | 0.940.20 | 0.850.22 |
| 93 | 11:51:09.1 | -28:48:19.4 | 22.06 | 0.76 | 1.10 | 175425 | 1.930.16 | 3.820.16 | 0.980.18 | 2.010.20 |
| Bin 1 (8 GCs) | 22.81 | 0.61 | 0.82 | 2.200.49 | 1.260.38 | 1.050.42 | 0.890.26 | |||
| Bin 2 (7 GCs) | 22.51 | 0.70 | 0.99 | 2.080.29 | 2.210.55 | 1.410.29 | 1.550.54 | |||
| Bin 3 (7 GCs) | 22.58 | 0.74 | 1.09 | 1.670.33 | 3.330.36 | 1.720.43 | 2.050.38 | |||
| Bin 4 (7 GCs) | 23.36 | 0.81 | 1.19 | 1.611.03 | 4.090.62 | 2.680.43 | 2.741.06 | |||
| All GCs (29) | 22.81 | 0.71 | 1.02 | 1.950.49 | 2.471.03 | 1.540.57 | 1.670.74 | |||
| NGC 3923 | 1.520.36 | 3.040.37 | 1.790.42 | 2.000.46 | ||||||
| 30 (Star) | 11:50:54.5 | -28:50:19.5 | 21.17 | 0.76 | 1.03 | 9134 | ||||
| 15 (Star) | 11:50:56.9 | -28:50:03.9 | 20.15 | 0.95 | 1.31 | 1937 | ||||
| 118 (Star) | 11:51:02.7 | -28:45:54.1 | 22.28 | 0.90 | 1.22 | 9234 | ||||
| 40 (QSO) | 11:51:06.3 | -28:46:46.6 | 21.45 | 0.50 | 0.46 | z1.27 | ||||
| 56 (Star) | 11:51:05.2 | -28:46:50.3 | 21.55 | 0.40 | 0.47 | 28959 | ||||
| 383 (Galaxy) | 11:51:04.5 | -28:50:38.2 | 23.47 | 0.90 | 1.14 | z0.36 | ||||
| 113 (Galaxy) | 11:51:10.7 | -28:45:38.8 | 22.22 | 0.83 | 1.21 | z0.29 | ||||
| 17 (Star) | 11:51:09.9 | -28:49:42.3 | 20.21 | 0.54 | 0.69 | 11162 |
| ID | Age | [Fe/H] | [/Fe] | [Z/H] | S/N | Comments |
|---|---|---|---|---|---|---|
| (Gyr) | (dex) | (dex) | (dex) | |||
| 228 | 10.0 | -2.250.37 | 0.480.40 | -1.800.17 | 24.4 | |
| 253 | 15.0 | -2.280.34 | 0.800.30 | -1.530.29 | 22.5 | |
| 197 | 6.0 | -0.490.17 | 0.440.10 | -0.080.13 | 29.4 | |
| 279 | 15.0 | -0.570.19 | 0.420.13 | -0.180.16 | 22.2 | |
| 112 | 7.9 | -0.880.13 | 0.30 0.08 | -0.600.15 | 39.4 | |
| 394 | 11.9 | -1.310.27 | 0.380.41 | -0.950.28 | 15.6 | Fit unstable. |
| 106 | 11.9 | -1.190.12 | 0.150.12 | -1.050.08 | 44.7 | |
| 64 | 11.9 | -1.370.10 | 0.210.10 | -1.180.06 | 56.1 | |
| 86 | 15.0 | -1.150.15 | 0.340.11 | -0.830.12 | 47.7 | |
| 311 | 6.7 | -0.720.37 | 0.180.22 | -0.550.27 | 20.0 | |
| 333 | 15.0 | -0.270.26 | 0.210.16 | -0.080.30 | 17.8 | No Balmer lines in fit. |
| 247 | 14.1 | -1.350.28 | 0.320.24 | -1.050.21 | 22.9 | |
| 99 | 12.6 | -0.570.11 | 0.150.10 | -0.430.08 | 43.4 | |
| 322 | 11.2 | -1.250.26 | 0.240.30 | -1.030.20 | 19.3 | |
| 498 | 15.0 | 0.13 0.25 | -0.300.12 | -0.150.29 | 12.4 | Extremely poor fit |
| 221 | 10.6 | -1.450.25 | 0.240.26 | -1.230.11 | 24.9 | |
| 110 | 15.0 | -0.760.15 | 0.300.10 | -0.480.11 | 40.6 | |
| 232 | 11.9 | -0.780.18 | 0.240.15 | -0.550.16 | 22.9 | |
| 225 | 11.9 | -0.850.24 | 0.320.36 | -0.550.24 | 25.7 | |
| 360 | 10.6 | -0.770.24 | 0.530.20 | -0.280.14 | 17.0 | |
| 332 | 15.0 | 0.150.16 | 0.03 0.12 | 0.180.18 | 18.7 | Fit unstable. |
| 108 | 14.1 | -0.450.07 | 0.240.05 | -0.230.05 | 41.9 | |
| 450 | 10.0 | -0.610.28 | 0.380.19 | -0.250.22 | 13.2 | |
| 513 | 13.3 | -0.580.28 | 0.400.22 | -0.200.23 | 11.4 | |
| 492 | 8.9 | -0.230.24 | 0.620.18 | 0.350.25 | 13.0 | |
| 167 | 12.6 | -1.300.15 | 0.500.13 | -0.830.12 | 33.3 | |
| 65 | 11.9 | -1.600.15 | 0.270.15 | -1.350.07 | 53.5 | |
| 104 | 11.9 | -1.730.17 | 0.380.17 | -1.380.07 | 41.8 | |
| 93 | 15.0 | -0.750.14 | 0.180.17 | -0.580.19 | 45.6 | |
| Bin 1 (8 GCs) | 11.9 | -1.600.29 | 0.240.30 | -1.380.12 | ||
| Bin 2 (7 GCs) | 12.6 | -1.180.15 | 0.240.16 | -0.950.10 | ||
| Bin 3 (7 GCs) | 15.0 | -0.700.16 | 0.270.12 | -0.450.11 | ||
| Bin 4 (7 GCs) | 13.3 | -0.350.20 | 0.240.16 | -0.130.15 | ||
| All GCs (29 GCs) | 15.0 | -1.000.37 | 0.210.29 | -0.800.31 | ||
| NGC 3923 | 15.0 | -0.650.17 | 0.340.13 | -0.330.14 |
| ID | R.A. | DEC. | Vtarget | V |
|---|---|---|---|---|
| (J2000) | (J2000) | (km/s) | (km/s) | |
| 228 | 11:50:49.2 | -28:46:58.0 | 158766 | 186672 |
| 253 | 11:50:50.1 | -28:50:19.0 | 220374 | 181264 |
| 197 | 11:50:49.7 | -28:48:55.5 | 172729 | 185937 |
| 279 | 11:50:51.3 | -28:50:38.1 | 180741 | 1772101 |
| 112 | 11:50:52.0 | -28:48:32.2 | 176326 | 181534 |
| 394 | 11:50:50.7 | -28:46:47.9 | 185169 | 184364 |
| 106 | 11:50:53.6 | -28:46:07.1 | 173326 | 1972106 |
| 30 | 11:50:54.5 | -28:50:19.5 | 9134 | 175090 |
| 64 | 11:50:54.1 | -28:48:15.8 | 177027 | 185521 |
| 86 | 11:50:56.3 | -28:45:59.3 | 178422 | 183050 |
| 311 | 11:50:57.7 | -28:46:42.1 | 166643 | 187941 |
| 333 | 11:50:58.3 | -28:50:51.0 | 192555 | 195248 |
| 15 | 11:50:56.9 | -28:50:03.9 | 1937 | 191733 |
| 247 | 11:50:57.3 | -28:50:13.5 | 182948 | 187423 |
| 99 | 11:50:55.0 | -28:48:00.3 | 165422 | 187432 |
| 322 | 11:50:55.4 | -28:46:29.5 | 209950 | 181758 |
| 498 | 11:50:55.8 | -28:46:45.1 | 160049 | 186732 |
| 221 | 11:51:04.1 | -28:45:45.6 | 180553 | 197245 |
| 110 | 11:51:04.9 | -28:45:48.5 | 155024 | 191054 |
| 118 | 11:51:02.7 | -28:45:54.1 | 9234 | 190945 |
| 232 | 11:51:00.2 | -28:46:55.0 | 180830 | 185327 |
| 225 | 11:51:03.6 | -28:49:53.0 | 192637 | 187829 |
| 360 | 11:50:59.5 | -28:50:05.8 | 147639 | 184822 |
| 332 | 11:51:05.8 | -28:49:51.3 | 163941 | 188137 |
| 108 | 11:51:07.2 | -28:50:11.9 | 204632 | 198484 |
| 40 | 11:51:06.3 | -28:46:46.6 | z1.27 | 184324 |
| 56 | 11:51:05.2 | -28:46:50.3 | 28959 | 185825 |
| 450 | 11:51:00.7 | -28:45:40.3 | 211439 | 192375 |
| 513 | 11:51:01.2 | -28:45:52.5 | 167161 | 191349 |
| 492 | 11:50:59.8 | -28:45:58.4 | 174650 | 191159 |
| 383 | 11:51:04.5 | -28:50:38.2 | z0.36 | 182245 |
| 167 | 11:51:08.0 | -28:46:06.0 | 180622 | 190742 |
| 65 | 11:51:07.6 | -28:46:23.9 | 229530 | 186038 |
| 104 | 11:51:08.6 | -28:46:27.4 | 215245 | 190042 |
| 113 | 11:51:10.7 | -28:45:38.8 | z0.29 | 187291 |
| 93 | 11:51:09.1 | -28:48:19.4 | 175425 | 187829 |
| 17 | 11:51:09.9 | -28:49:42.8 | 11162 | 192951 |
7 Acknowledgements
The authors would like to acknowledge Russell Smith for input and discussions which greatly improved this work and Bryan Miller for making his GMOS-S observations of Lick standard stars available to us. We also thank the anonymous referee for several suggestions which improved this work. MAN acknowledges financial support from the STFC. SEZ acknowledges support from NSF award AST-0406891. DF acknowledges support from the ARC.
Based on observations obtained at the Gemini Observatory, which is operated by the Association of Universities for Research in Astronomy, Inc., under a cooperative agreement with the NSF on behalf of the Gemini partnership: the National Science Foundation (United States), the Science and Technology Facilities Council (United Kingdom), the National Research Council (Canada), CONICYT (Chile), the Australian Research Council (Australia), CNPq (Brazil) and CONICET (Argentina).
References
- Beasley et al. (2004) Beasley M. A., Brodie J. P., Strader J., Forbes D. A., Proctor R. N., Barmby P., Huchra J. P., 2004, AJ, 128, 1623
- Beasley et al. (2006) Beasley M. A., Strader J., Brodie J. P., Cenarro A. J., Geha M., 2006, AJ, 131, 814
- Bender et al. (1988) Bender R., Doebereiner S., Moellenhoff C., 1988, A&AS, 74, 385
- Beuing et al. (2002) Beuing J., Bender R., Mendes de Oliveira C., Thomas D., Maraston C., 2002, A&A, 395, 431
- Bridges et al. (2006) Bridges T., Gebhardt K., Sharples R., Faifer F. R., Forte J. C., Beasley M. A., Zepf S. E., Forbes D. A., Hanes D. A., Pierce M., 2006, MNRAS, 373, 157
- Brough et al. (2006) Brough S., Forbes D. A., Kilborn V. A., Couch W., 2006, MNRAS, 370, 1223
- Cappellari & Emsellem (2004) Cappellari M., Emsellem E., 2004, PASP, 116, 138
- Carter et al. (1998) Carter D., Thomson R. C., Hau G. K. T., 1998, MNRAS, 294, 182
- Cenarro et al. (2007) Cenarro A. J., Beasley M. A., Strader J., Brodie J. P., Forbes D. A., 2007, AJ, 134, 391
- Cuillandre et al. (1994) Cuillandre J. C., Fort B., Picat J. P., Soucail J. P., Altieri B., Beigbeder F., Duplin J. P., Pourthie T., Ratier G., 1994, A&A, 281, 603
- Denicoló et al. (2005) Denicoló G., Terlevich R., Terlevich E., Forbes D. A., Terlevich A., 2005, MNRAS, 358, 813
- Forbes et al. (2004) Forbes D. A., Raul Faifer F., Carlos Forte J., Bridges T., Beasley M. A., Gebhardt K., Hanes D. A., Sharples R., Zepf S. E., 2004, MNRAS, 355, 608
- González (1993) González J. J., 1993, Ph.D. Thesis, University of California, Santa Cruz
- Hook et al. (2004) Hook I. M., Jørgensen I., Allington-Smith J. R., Davies R. L., Metcalfe N., Murowinski R. G., Crampton D., 2004, PASP, 116, 425
- Jarrett et al. (2003) Jarrett T. H., Chester T., Cutri R., Schneider S. E., Huchra J. P., 2003, AJ, 125, 525
- Jones (1997) Jones L. A., 1997, Ph.D thesis, Univ. North Carolina, Chapel Hill
- Kissler-Patig et al. (1998) Kissler-Patig M., Brodie J. P., Schroder L. L., Forbes D. A., Grillmair C. J., Huchra J. P., 1998, AJ, 115, 105
- Kobayashi (2004) Kobayashi C., 2004, MNRAS, 347, 740
- Koprolin & Zeilinger (2000) Koprolin W., Zeilinger W. W., 2000, A&AS, 145, 71
- Kuntschner (2004) Kuntschner H., 2004, A&A, 426, 737
- Kuntschner et al. (2002) Kuntschner H., Ziegler B. L., Sharples R. M., Worthey G., Fricke K. J., 2002, A&A, 395, 761
- Larsen & Richtler (2000) Larsen S. S., Richtler T., 2000, A&A, 354, 836
- Lee & Worthey (2005) Lee H.-c., Worthey G., 2005, ApJS, 160, 176
- Malin & Carter (1983) Malin D. F., Carter D., 1983, ApJ, 274, 534
- McLaughlin (1999) McLaughlin D. E., 1999, AJ, 117, 2398
- Mendel et al. (2007) Mendel J. T., Proctor R. N., Forbes D. A., 2007, MNRAS, 379, 1618
- Norris et al. (2006) Norris M. A., Sharples R. M., Kuntschner H., 2006, MNRAS, 367, 815
- Pierce et al. (2006a) Pierce M., Beasley M. A., Forbes D. A., Bridges T., Gebhardt K., Faifer F. R., Forte J. C., Zepf S. E., Sharples R., Hanes D. A., Proctor R., 2006a, MNRAS, 366, 1253
- Pierce et al. (2006b) Pierce M., Bridges T., Forbes D. A., Proctor R., Beasley M. A., Gebhardt K., Faifer F. R., Forte J. C., Zepf S. E., Sharples R., Hanes D. A., 2006b, MNRAS, 368, 325
- Proctor et al. (2004) Proctor R. N., Forbes D. A., Beasley M. A., 2004, MNRAS, 355, 1327
- Proctor et al. (2005) Proctor R. N., Forbes D. A., Forestell A., Gebhardt K., 2005, MNRAS, 362, 857
- Proctor & Sansom (2002) Proctor R. N., Sansom A. E., 2002, MNRAS, 333, 517
- Puzia et al. (2005) Puzia T. H., Kissler-Patig M., Thomas D., Maraston C., Saglia R. P., Bender R., Goudfrooij P., Hempel M., 2005, A&A, 439, 997
- Puzia et al. (2004) Puzia T. H., Kissler-Patig M., Thomas D., Maraston C., Saglia R. P., Bender R., Richtler T., Goudfrooij P., Hempel M., 2004, A&A, 415, 123
- Serra & Trager (2007) Serra P., Trager S. C., 2007, MNRAS, 374, 769
- Sikkema et al. (2007) Sikkema G., Carter D., Peletier R. F., Balcells M., Del Burgo C., Valentijn E. A., 2007, A&A, 467, 1011
- Sikkema et al. (2006) Sikkema G., Peletier R. F., Carter D., Valentijn E. A., Balcells M., 2006, A&A, 458, 53
- Strader et al. (2007) Strader J., Beasley M. A., Brodie J. P., 2007, AJ, 133, 2015
- Strader et al. (2005) Strader J., Brodie J. P., Cenarro A. J., Beasley M. A., Forbes D. A., 2005, AJ, 130, 1315
- Thomas et al. (2003) Thomas D., Maraston C., Bender R., 2003, MNRAS, 339, 897
- Thomas et al. (2005) Thomas D., Maraston C., Bender R., Mendes de Oliveira C., 2005, ApJ, 621, 673
- Thomas et al. (2004) Thomas D., Maraston C., Korn A., 2004, MNRAS, 351, L19
- Trager et al. (1998) Trager S. C., Worthey G., Faber S. M., Burstein D., Gonzalez J. J., 1998, ApJS, 116, 1
- Vazdekis (1999) Vazdekis A., 1999, ApJ, 513, 224
- Vazdekis (2007) Vazdekis A e., 2007, in prep
- Worthey & Ottaviani (1997) Worthey G., Ottaviani D. L., 1997, ApJS, 111, 377
- Zepf et al. (1995) Zepf S. E., Ashman K. M., Geisler D., 1995, ApJ, 443, 570
- Zepf et al. (2000) Zepf S. E., Beasley M. A., Bridges T. J., Hanes D. A., Sharples R. M., Ashman K. M., Geisler D., 2000, AJ, 120, 2928
- Zepf et al. (1994) Zepf S. E., Geisler D., Ashman K. M., 1994, ApJ, 435, L117