Modelling the spectral energy distribution of ULIRGs II: The energetic environment and the dense interstellar medium††thanks: Data and SED models of Fig. 1 are available in electronic form. See also Tables B.1, B.2 and B.3.
Abstract
Aims. By using the spectral energy distribution (SED) from the near-infrared to the radio of a statistically significant number of luminous infrared galaxies we determine important physical parameters for this population of objects. In particular we constrain the optical depth towards the luminosity source, the star formation rate, the star formation efficiency and the AGN fraction.
Methods. We fit the near-infrared to radio spectral energy distributions of a sample of 30 luminous and ultra-luminous infrared galaxies with pure starburst models or models that include both starburst and AGN components.
Results. We find that although about half of our sample have best-fit models that include an AGN component, only 30% (9/30) have an AGN which accounts for more than 10% of the infrared luminosity from 8 to , whereas all have an energetically dominant starburst. Our derived AGN fractions are generally in good agreement other measurements based in the mid-infrared line ratios, Ne[V]/Ne[II] and O[IV]/Ne[II] measured by Spitzer IRS, but much lower than those derived from PAH equivalent widths or the mid-infrared spectral slope. Our models determine the mass of dense molecular gas within which active star formation takes place via the extinction required to reproduce the infrared part of the SED. Assuming that this mass is that traced by the HCN molecule, we reproduce the observed linear relation between HCN flux and infrared luminosity found by Gao & Solomon, 2004a. We also find that the star formation efficiency, as defined by the current star formation rate per unit molecular gas mass, falls as the starburst ages.
Conclusions. If the evolution of ULIRGs includes a phase in which an AGN contributes an important fraction to the infrared luminosity, this phase should last an order of magnitude less time than the starburst phase. However, we find no convincing evidence that an energetically important AGN is associated with a particular phase of the starburst. Because the mass of dense molecular gas which we derive is consistent with observations of the HCN molecule, it should be possible to estimate the mass of dense, star-forming molecular gas in such objects when molecular line data are not available.
Key Words.:
– Interstellar medium: dust extinction – Galaxies: active – Infrared: galaxies – Radio continuum: galaxies1 Introduction
With total infrared luminosities between L⊙ and L⊙, respectively, Luminous and Ultraluminous Infrared galaxies, (U)LIRGs, are the most luminous objects in the local universe. Although scarce at low redshift, they may account for the bulk of all star formation activity at and dominate the far-infrared background (e.g. Blain et al. 2002).
Many of them are found in merging systems (e.g. Sanders et al. 1988), suggesting that dynamical interaction has driven gas towards the nucleus, fueling a massive starburst (SB) and/or the central massive black hole (Mihos & Hernquist 1996).
Despite extensive investigation over the last decades, there is still considerable uncertainty as to the nature of their power source.
The observation that ULIRGs obey the same FIR-radio correlation of normal star forming galaxies (e.g. Sopp, Alexander & Riley, 1990) and display a tight correlation between dense molecular gas mass and far-infrared luminosity (Gao & Solomon, 2004a), constitute strong evidence that these sources are powered predominantly by star formation. However, ULIRGs may commonly host an AGN and the evidence that AGN and starburst luminosities are correlated over a wide range of IR luminosities (e.g. Farrah et al. 2003) render the above issue more intriguing.
Many studies have been devoted to the quantification of the relative contributions of AGN and starburst (SB), but they are hindered by the large and uncertain extinction that, usually, is not negligible even at NIR wavelengths (Goldader et al. 1995, Silva et al. 1998, Murphy et al. 2001, Valdés et al. 2005).
In order to analyze the power mechanism in these sources, tracers that do not suffer large extinction have been recently preferred, such as hard X-rays, and MIR to radio diagnostics. Rigopoulou et al. (1996) argue that the weakness of the hard X-ray luminosity seen in most ULIRGs, reveals a real lack of AGN activity, because the gas column densities required to absorb its emission exceed those estimated from CO data. Similar conclusions have been found by Risaliti et al. (2006) who concluded that energetically important AGN are present in only 20% of their ULIRG sample.
After the advent of ISO and Spitzer, MIR diagnostics such as the strengths of PAH emission and the 9.7m absorption features, the high ionization lines, and the MIR continuum slope, have been largely used to quantify the AGN contribution (Genzel et al. 1998, Dudley 1999, Imanishi et al. 2007, Farrah et al. 2007, Armus et al. 2007). However, in spite of a general consensus that the starburst is dominant in about 80% of ULIRGs, there are strong discrepancies in the results obtained with the different methods. This is in line with the recent finding that the strength of PAHs and the shape of the mid-infrared continuum cannot be safely used to disentangle AGN and starburst contributions because, on one hand, there is evidence that PAHs can be destroyed in strong star forming regions and, on the other, that MIR radiation can be self absorbed in a highly obscured environment (Vega et al. 2005, Weedman et al. 2005).
In the radio domain, the most direct way of distinguishing between AGN and starburst power sources in ULIRGs is to search for very compact radio continuum emission towards the nuclei. However radio sources of similar physical sizes have been identified as both AGN or a compact starburst, depending on the resolution of the observations. Nagar et al. (2003), by using 15 GHz radio continuum data with a resolution of 150 mas, have concluded that most of the 83 ULIRGs of their sample are AGN powered because of the compactness of the radio sources detected. However, the resolution of their data corresponds to 420 pc at the median redshift of their sample and, as a comparison, the SNe detected in the NW nucleus of Arp 220 by Smith et al. (1998) are within a region (). Smith et al. find that no AGN is necessary to explain the IR luminosity in this source. As long as the brightness temperature does not exceed the compactness of radio nuclei alone does not support an AGN hypothesis. Smith, Lonsdale & Lonsdale (1998) find that 7/11 ULIRGs observed at 18 cm by VLBI could be modelled as pure starbursts, which would be consistent with their finding that the molecular gas mass is correlated with the radio flux on small scales.
In this paper we follow a different approach to examine the energetic environment in (U)LIRGs. Instead of considering a single spectral region, we base our study on the thorough analysis of the panchromatic spectral energy distribution (SED). Thus, we first determine the NIR - radio SED of a sample of 30 local (U)LIRGs by using archival IR photometry and spectroscopy, and new radio data by Clemens et al. (2007). Then, these data are compared with suitable models with SB and AGN components. Similar approaches have been adopted by Klaas et al. (2001) and by Farrah et al. (2003). They used starburst and AGN templates to model the SED from the NIR-submm range, and from the optical-submm range, respectively. We prefer to use models built on well calibrated star forming complexes instead of templates re-scaled to different luminosities for two reasons. Firstly, it avoids the dubious process of ”re-scaling” a ”template” to another luminosity. This point is well exemplified by the link between lack of PAH emission and dominance of the molecular cloud component with respect to the cirrus component (Vega et al. 2005). Secondly, the use of models may give access to a more sound physical picture of the environment within which such objects evolve. We are not only interested in the nature of the power mechanism, but also in its environment and evolution. This, in turn, can be used for the study of even more extreme phases such as those likely found at high redshift, which is one of the ultimate goals of the present investigation.
Another major difference with previous works is the inclusion of radio data in the analysis. Radio data constitute an independent constraint on the starburst strength and age. Indeed, Bressan, Silva & Granato (2002) showed that deviations from the FIR/radio correlation could be used to infer the evolutionary status of a compact starburst. Such deviations are expected in bursts of short duration because, at early times (a few ), there is a depletion of synchrotron emission due to the low rate of production of core collapse Supernovae. Such young sources are characterized by a FIR/radio ratio that is larger than the average of star forming objects, and by a radio slope that is flatter than the average synchrotron slope.
The power of considering also radio data was illustrated by Bressan et al. (2002) and Prouton et al. (2004). While Bressan et al. limited their comparative analysis to the case of pure starbursts, Prouton et al. (2004) have attempted a full panchromatic analysis by including also the possible contribution from the AGN. The latter authors pointed out the existence of a certain degree of degeneracy between the AGN contribution and dust optical depth of the molecular clouds, mainly arising from a poor sampling of the SED in the MIR spectral region.
The present work supersedes our previous ones for the following reasons. From the observational side, we have greatly enlarged the sample from the original 7 of Prouton et al. to 30 objects. We have also reconsidered and largely increased the number of observational data points, and consequently, our conclusions rely on much better sampled SEDs. This is particularly true for the MIR range, where for about one third of the sample we have also included the Spitzer IRS spectrum. From the theoretical side, we make use of the most recent improvements in our GRASIL SB models (see Sect. 3). These models adopt a better treatment of PAH emission and include results based on IR observations so that they allow a more realistic rendering of the emission in the mid-infrared.
The paper is organized as follows. In Section 2 we describe our sample selection and present the observed SEDs of our galaxies. Section 3 describes the models and the method used to obtain the best fit to the SEDs. Observed SEDs and best fit models are published in electronic form, see also Tables B.1, B.2 and B.3. The results of the fits are presented in Section 4 and they are discussed in Section 5. Our conclusions are drawn in Section 6, while notes on individual objects are provided in Appendix A.
| (1) | (2) | (3) | (4) | (5) | (6) | (7) | (8) | (9) | (10) | (11) |
|---|---|---|---|---|---|---|---|---|---|---|
| NAME | Log(LIR) | 12/25 | 60/100 | J-K | Spectral | Radio | References | |||
| (L⊙) | (Mpc) | type | size (″) | |||||||
| UGC 8058∗,†,§ | 12.49 | 174.0 | 0.21 | 1.06 | 2.22 | 2.14 | -0.25 | Sy1 | a,b, c, d, e, f, g, h, i, j, l, n | |
| IR 14348-1447† | 12.30 | 351.3 | 0.19 | 0.97 | 1.71 | 2.36 | -0.75 | L | a, b, j, n | |
| IR 12112+0305 | 12.28 | 309.3 | 0.17 | 0.85 | 1.22 | 2.66 | -0.51 | HII | a, b, j, m, n, o | |
| IR 05189-2524∗,†,§ | 12.11 | 175.7 | 0.21 | 1.20 | 2.17 | 2.74 | - | Sy2 | a, b, j, n, p | |
| UGC 9913§ | 12.11 | 73.5 | 0.06 | 0.91 | 1.18 | 2.59 | -0.46 | HII/L | a, b, j, l, m, n, o, q | |
| IR 08572+3915∗,§ | 12.09 | 243.6 | 0.19 | 1.53 | 1.90 | 3.27 | -0.11 | L/Sy2 | a, j, n, o | |
| UGC 8696§ | 12.09 | 155.3 | 0.10 | 1.01 | 1.30 | 2.25 | -0.83 | Sy2/L | a, b, e, j, k, l, n, | |
| IR 15250+3609§ | 12.01 | 229.7 | 0.15 | 1.17 | 1.16 | 2.76 | -0.45 | L | a, b, j, m, n, o | |
| IR 10565+2448§ | 11.98 | 177.9 | 0.16 | 0.80 | 1.09 | 2.44 | - | HII | a, m, n, o, r | |
| UGC 5101§ | 11.90 | 162.2 | 0.24 | 0.57 | 1.80 | 1.99 | -0.81 | L/Sy1.5 | a, j, k, n, s | |
| IZW 107 | 11.83 | 165.6 | 0.15 | 0.86 | 1.11 | 2.36 | -0.95 | HII | a, m, o, t | |
| IR 01364-1042 | 11.78 | 200.4 | 0.13 | 0.96 | 1.19 | 2.71 | -0.50 | L | a | |
| IR 10173+0828 | 11.74 | 198.9 | 0.13 | 1.07 | 1.16 | 2.84 | -0.44 | - | a, m, o | |
| Arp 299∗ | 11.72 | 41.5 | 0.16 | 0.97 | 1.29 | 2.09 | -0.80 | - | a, q, u, v | |
| UGC 4881 | 11.65 | 161.8 | 0.21 | 0.69 | 1.15 | 2.37 | -0.85 | HII | a, o | |
| CGCG 436-30§ | 11.64 | 127.8 | 0.14 | 1.11 | 1.31 | 2.40 | -0.63 | L/HII | a, o, w | |
| IC 1623 | 11.63 | 81.4 | 0.19 | 0.74 | 1.41 | 2.08 | -0.88 | - | a, t, x, y | |
| NGC 1614∗ | 11.60 | 64.5 | 0.20 | 0.99 | 1.28 | 2.45 | -0.68 | HII/Sy2 | a, k, m, o, s, z, aa, ab, ac | |
| UGC 8387§ | 11.58 | 95.0 | 0.19 | 0.61 | 0.96 | 2.32 | -0.95 | L/HII | a, m, o, r, ab | |
| NGC 7469∗ | 11.58 | 66.0 | 0.23 | 0.77 | 1.26 | 2.29 | -0.84 | Sy1.2 | a, h, k, o, ad, ae, af | |
| UGC 2369 | 11.57 | 127.7 | 0.17 | 0.79 | 1.12 | 2.33 | -0.80 | HII | a, m, o, t, ag | |
| IIIZW 35 | 11.56 | 112.0 | 0.10 | 0.94 | 1.27 | 2.58 | -0.52 | L/HII | a, o | |
| IC 5298∗ | 11.54 | 111.9 | 0.17 | 0.75 | 1.29 | 2.53 | -0.79 | Sy2/L/HII | a, o | |
| Arp 148 | 11.51 | 141.6 | 0.33 | 0.55 | 1.37 | 2.37 | -0.64 | HII | a, m, o | |
| NGC 2623§ | 11.49 | 74.8 | 0.12 | 0.83 | 1.15 | 2.49 | -0.60 | L/Sy2 | a, k, m, ac | |
| Mrk 331 | 11.44 | 74.9 | 0.19 | 0.81 | 1.24 | 2.52 | -0.70 | HII/Sy2 | a, k, o, r, ab | |
| NGC 34 | 11.44 | 79.6 | 0.15 | 1.01 | 1.18 | 2.49 | -0.79 | Sy2 | a, u, ah | |
| NGC 5256 | 11.44 | 113.7 | 0.33 | 0.66 | 1.47 | 1.90 | -0.77 | Sy2/HII | a, b, o, ac, ad, ai | |
| UGC 6436 | 11.41 | 140.1 | 0.44 | 0.57 | 1.05 | 2.65 | -0.70 | L/HII | a, o | |
| NGC 6286 | 11.16 | 74.4 | 0.50 | 0.44 | 1.36 | 1.94 | -0.95 | HII/L | a, l, r, w |
References: (a) NED, IRSA, Clemens et al. (2007), (b) Klaas
et al. (2001), (c) Roche & Chandler (1993), (d) Joyce & Simon
(1976), (e) Rieke (1978),
(f) Rieke (1976), (g) Joyce et al. (1975), (h) Weedman et al. (2005), (k) Benford (1999), (j) Rigopoulou et al. (1996), (l) Carico et al. (1992),
(m) Dunne & Eales (2001), (n) Farrah et al. (2003), (o) Dunne et al. (2000), (p) Maiolino & Rieke (1995), (q) Chini, Kruegel & Lemke (1986),
(r) Dale et al. (2000), (s) Carico et al. (1988), (t) Spinoglio et al. (2002), (u) Gallais et al. (2004), (v) Charmandaris, Stacey & Gull (2002),
(w) Stickel et al. (2004), (x) Frayer et al. (1999), (y) Le Floc’h et al. (2002), (z) Rieke & Low (1972), (aa) Lebofsky & Rieke (1979),
(ab) Soifer et al. (2001), (ac) Brandl et al. (2006), (ad) Pérez-García & Rodríguez- Espinosa (2001), (ae) Alonso-Herrero et al. (2001),
(af) Papadopoulos & Allen (2000), (ag) Hwang et al. (1999), (ah) Albrecht, Krügel & Chini (2007), (ai) Alonso-Herrero et al. (2003)
2 Sample
We study the sample of 30 (U)LIRGs presented by Clemens et al. (2007, hereafter Paper I). The selection criteria were specificated in that work and are summarized as follows: (a) The galaxies are compact (U)LIRGs from Condon et al. (1991a) (i.e. brighter than at ) with radio data at 3 or more frequencies, including the new measurements at 22 GHz (Paper I). The well-sampled radio spectra will allow us to put strong constraints on the age of the burst of star formation (Bressan et al. 2002). (b) We also require the galaxies to have a well-sampled infrared SED, with data in the NIR, MIR and FIR spectral ranges. We have excluded from the analysis data at wavelengths shorter than the NIR because, due to the large extinction, they are likely to be dominated by the underlying old stellar population and not by the starburst (e.g. Surace et al. 2000, Farrah et al. 2001). Thus, the inclusion of optical data would introduce new free parameters, all related with the geometry, ages, and metallicities of this unobscured stellar population. To a similar extent, also the NIR continuum may be dominated by the old population, but its inclusion is needed because a J-K colour excess over that expected from a pure stellar component is a strong indication of the presence of an AGN (e.g. Berta et al. 2003).
The original sample presented in paper I is of 31 galaxies, however we exclude one of the galaxies (IRAS 03359+1523) from this analysis because of the confusion with a nearby source of similar strength in the far-infrared.
In Table 1 we list some general information for our sample, useful for the analysis performed here. Column (1) displays the name of the galaxy. In Col. (2) we list the logarithm of the total (8 - 1000 m) IR luminosity (Sanders & Mirabel 1996) for each galaxy. In Col. (3) we list the luminosity distances, , of the galaxies, calculated by assuming Mpc/km/s, and , and the radial velocities given in NED111The NASA/IPAC Extragalactic Database is operated by the Jet Propulsion Laboratory, California Institute of Technology, under contract with the National Aeronautics and Space Administration.. Columns (4) and (5) list the 12/25 and 60/100 IRAS colours respectively, where all the IR data were taken from NED. Column (6) displays the J-K colour. NIR data were taken from IRSA222The NASA/IPAC Infrared Science Archive is operated by the Jet Propulsion Laboratory, California Institute of Technology, under contract with the National Aeronautics and Space Administration.. In Col. (7) we list the value of the FIR to radio luminosity ratio, , and in Col. (8) the radio spectral index between 22 and 1.4 GHz, . In both cases, radio data were taken from Paper I. Column (9) displays the optical spectral classification of each galaxy from NED. Column (10) displays the size of the radio emitting region at 1.4 GHz from Condon et al. (1991a).
2.1 The NIR to radio data
For all the sources of our sample we collected NIR data from the 2MASS All-Sky Extended Source Catalog and IRAS data from NED. Radio data were collected from Paper I. Additional IR and sub-mm broad-band data were taken from the literature. The references to those works are quoted in the last column of Table 1. In order to clarify which NIR to radio data were effectively used in our SED modelling, we also provide, in electronic form, the SED data for each galaxy.
We searched for Spitzer IRS spectra of our ULIRG sample in the SSC archive and found them for 11 galaxies (projects ID 105, and 14, P.I.: J. R. Houck, and project ID 30323, P.I.: L. Armus) for eleven galaxies of our sample, UGC 8058, IRAS 05189-2524, UGC 9913, IRAS 08572+3915, UGC 8696, IRAS 15250+3609, IRAS 10565+2448, UGC 5101, UGC 8387, CGCG 436-30, and NGC 2623. In order to include them in the fitting procedure, we calculated from the Spitzer spectra the values of the specific fluxes at 5.8 and 10 m, those in the LW2 and LW3 ISO bands and those in the IRAS 12 and 25 microns bands, by taking into account the suitable filter responses. We excluded the fluxes in the IRAC 3 and IRAC 4 bands because these are too dominated by molecular absorption bands (e.g. Lahuis et al. 2007), which are not included in our models.
In the compilation of fluxes care was taken to avoid confusion between different close sources and, in the case of interferometric radio data, losses due to high resolution mapping.
Our objects are compact, with the radio emitting regions ranging from pc for IR 14348-1447 to 43 33 pc for Mrk 331 (see Col. 10 in table 1). They are also isolated so that we are confident that our fluxes sample the entire starburst in all cases.
3 Models
In this section we describe the model that will be used to interpret the SEDs of our galaxy sample.
As already mentioned, there is considerable evidence that the starburst component is always present and possibly dominates the bolometric luminosity in luminous and ultra-luminous IRAS galaxies. Therefore, we adopt the following approach to find the best fit model. We first test the null-hypothesis that our sample sources are pure starbursts. Then, if the observed SED shows an excess emission over the best fit in those wavelength regions that are more affected by the presence of an embedded AGN, typically in the NIR-FIR range, we reject the null-hypothesis and add an AGN component to the model.
The starburst models (SB) are selected from a library generated with GRASIL333GRASIL can be run via the WEB interface web.pd.astro.it/galsynth/ which is maintained at OAPD, INAF by L. Paoletti, A. Petrella & D. Selvestrel, and can also be downloaded from the web page http://adlibitum.oats.inaf.it/silva/default.html (Silva et al. 1998) and involve seven main free parameters that will be discussed below.
The best fit is obtained by minimizing a merit function calculated as
| (1) |
where , , and are the model flux values, the observed fluxes and observational errors respectively. is the number of passbands used for the fit and it is always greater than the number of parameters of the starburst model (i.e. 7, see Sec. 3.2). Thus, the best fit SB model is always well constrained. We consider that a satisfactory best fit starburst model is reached when, in all passbands, the residuals between observations and models are less than the typical observational error of the passband.
However, in some cases, the residuals between the observations and the SB model in one or more passbands, mainly in the NIR/MIR range, are larger than the typical error of the corresponding flux. Then we reject our null-hypothesis and consider the possibility that an AGN component, characterized by a hotter dust emission, is present. The AGN model is selected from a library generated with the radiative transfer code developed by Granato & Danese (1994) and added to the SB model in such a way that the total luminosity is
| (2) |
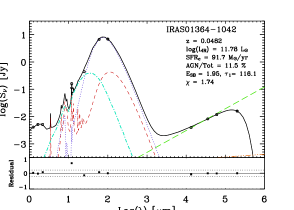
The best fit is again searched by using the merit function given by equation 1. Since the AGN models are characterized by other seven free parameters, one could question that the fit is not more well constrained because the total number of free parameters (SB + AGN) may exceed the number of observed passbands. Actually, anticipating our results, this is the case for one object, IRAS 01364-1042, where the number of adopted passbands is 11 and the estimated contribution of the AGN amounts to 10%. However, as will be discussed below, we could have simply estimated the AGN contribution as the flux excess over the best fit SB model.
A more critical point is concerned with the radio emission of the AGN which is not considered in the model by Granato and Danese (1994). Following Prouton et al. (2004), we assume that the contribution from the AGN to the radio emission is negligible so that the radio emission is entirely ascribed, and actually becomes a strong constrain, to the SB component. This assumption is supported by VLBI observations of the majority of our sources, indicating an average value of at 1.6 GHz, thus suggesting that the contribution of the AGN to the radio can be neglected (Smith et al. 1998).
In the followings subsections, we briefly describe the library of SB and AGN models.
3.1 Starburst models: a brief description of GRASIL
GRASIL is a population synthesis code which predicts the SED of galaxies from far-UV to radio, including state-of-the-art treatment of dust reprocessing (Silva et al. 1998, Silva 1999, Granato et al. 2000), production of radio photons by thermal and non-thermal processes (Bressan et al. 2002), nebular lines emission (Panuzzo et al. 2003) and an updated treatment of PAHs emission (Vega et al. 2005). We refer the reader to the original papers for details, but we summarize here, for convenience, the features most relevant to the present work.
The star formation history of a galaxy with a burst of star formation is computed in the GRASIL chemical evolution code by adopting a Schmidt-type law, , of efficiency , and exponent . The burst of star formation is simulated by superposing on this quiescent component a starburst phase, characterized by an exponentially decreasing star formation rate, with e-folding times ”” and age ””. In order to quantify the number of massive stars, the code adopts a initial mass function (IMF). The chemical evolution code determines, as a function of the galaxy age (), the star forming rate (), the supernova rate (SNR), the number of stars of a given mass and metallicity, the remaining mass of gas (), and the total baryonic mass of the galaxy ().
Then, GRASIL computes the interaction between the stellar radiation and dust using a relatively realistic and flexible geometry for both stars and dust. In general, the system is described as a superposition of an exponential disk component and a bulge component, the latter modelled by a King profile. However, for the starburst models, we consider that the spherically symmetric King profile alone, with core radii corresponding to the radial scale lengths for the star and dust components, , and identical spatial dependence, i.e. , is a reasonably good approximation (Silva et al. 1998).
One of the most novel features of GRASIL is that the ISM is divided into two phases, the diffuse ISM, corresponding to cirrus dust, and the much denser molecular clouds component (MCs). The code performs the radiative transfer of starlight through the MCs and diffuse ISM, by taking into account that new stars are born inside MCs and progressively get rid of them (either because they escape or because the clouds are destroyed). This process leads to a age-dependent extinction of stellar generations, in the sense that the younger stars are more affected by dust obscuration in MCs. This is approximately described in GRASIL as follows. If is the timescale for the process, the fraction of starlight radiated inside the clouds at time after they formed is given by
| (3) |
In practice, 100% of the stars younger than are considered to radiate inside the MCs, and this percentage decreases linearly to 0% in . The timescale is a fundamental parameter, which is found to be larger in starburst than in normal disk-like galaxies (Silva et al. 1998). The mass of gas involved in each component is specified by the the parameter , which represents the relative fraction of gas in the molecular cloud phase. Then, the total molecular mass, , is subdivided into spherical clouds whose optical depth, , is another important free parameter. In general, GRASIL computes the mass of dust by using a Gas-to-Dust mass ratio, . This approach assumes that gas and dust are well mixed and have the same spatial distribution. As for the intrinsic dust properties, GRASIL adopts a mixture of graphite and silicate grains and PAHs with continuous size distribution. Here as in other previous works (see Silva et al. 1998 and Vega et al. 2005 for more details), the dust parameters are set to match the extinction and emissivity properties of the local ISM.
The simple stellar populations (SSPs) included in GRASIL are based on the Padova stellar models, and cover a wide range of ages and metallicities. Starlight reprocessing from dust in the envelopes of AGB stars is included directly into the SSPs, as described by Bressan, Granato & Silva (1998).
3.2 The library of starburst SEDs
Our starburst library spans a wide range of parameters: star formation history, obscuration times, dust opacities, etc. The underlying quiescent star formation history is fixed using a Schmidt-type law for star formation with an efficiency of and an exponent , with an infall of primordial gas on a timescale of Gyr. For the IMF, we have adopted a Salpeter IMF with slope and to . To mimic the starburst, we superimposed, at a late time (11.95 Gyr), an exponential burst with different e-folding times, . The strength of the burst was fixed by imposing the constraint that the mass of stars formed during the burst is of the gas mass at that epoch. We then follow the evolution of the SED models at different ages () from the early starburst phase to the post-starburst and quiescent-normal phase (see Vega et al. 2005 for a description of those phases). For the computation of non-thermal radio emission we assumed that the lower limit of initial mass giving rise to a type II SN is 8 (Portinari, Chiosi & Bressan 1998, Bressan et al. 2002b).
Among the GRASIL parameters that mostly affect the IR-radio range we recall the optical depth of MCs (parameterized via i.e. at m), the mass-fraction of dense molecular gas to total gas mass (), the escape time of newly born stars from their parent MCs (), and the gas-to-dust ratio (). Since, there is evidence that the metallicity in this kind of galaxies is slightly super-solar (Rupke, Veilleux & Baker 2007), we assumed a conservative value for the metallicity of the gas, , and a , with the proportionality constant chosen to have for (Dwek 1998).
For the spatial distribution of stars and dust, we adopted a spherically symmetric King profile (Silva et al. 1998) where the the King profile core radius was allowed to vary by the typical sizes of compact starburst regions. The last free parameter that we considered in our models was the sub-mm dust emissivity index, . Theoretical studies indicate between 1.5 to 2 but infrared SEDs fitted with single or double modified black bodies, require values of as low as 0.7 (e.g. Dunne et al. 2000). Instead when the dust temperature distribution is properly computed as in GRASIL, fits to similar sources require , consistent with theoretical predictions.
In summary our starburst models are characterized by the following free parameters, whose ranges of values are listed in Tables 2 and 3: the e-folding time and age of the burst and , the sub-mm dust spectral index , the escape time , the MC optical depth at 1 m, , the fraction of gas in MCs , and the core radius of the King profile for the dust-star distributions .
| Mlow | Mup | % | (ageb) | ||
| (Gyr-1) | (Myr) | (yr) | |||
| 0.1 | 100 | 0.5 | 10 | 5 - 80 | 6.0 - 8.5 |
| r | |||||
|---|---|---|---|---|---|
| (Myr) | (kpc) | ||||
| 1.5 - 2 | 5 - 80 | 10 - 180 | 0.05 - 0.9 | 0.01 - 1 |
| (deg) | (deg) | (m) | ||||
| 30, 100, 300, 1000, 3000 | 0, 0.5, 1 | 20, 30, 40 | 0, 3, 6 | 0.3, 0.5, 1 | 1, 3, 10 |
| NAME | log() | r | Log(L) | LAGN/L8-1000 | ||||||
|---|---|---|---|---|---|---|---|---|---|---|
| (Myr) | (yr) | (Myr) | (kpc) | (L⊙) | ||||||
| UGC 8058∗,†,§ | 35 | 7.572 | 2.00 | 26 | 33.13 | 0.65 | 0.40 | 1.07 | 12.35 | 16 |
| IR 14348-1447† | 10 | 7.170 | 1.95 | 14 | 49.09 | 0.26 | 0.27 | 1.48 | 12.17 | 8 |
| IR 12112+0305 | 25 | 6.880 | 2.00 | 7 | 45.80 | 0.35 | 0.20 | 0.30 | 12.24 | – |
| IR 05189-2524∗,†,§ | 10 | 6.750 | 2.00 | 6 | 27.37 | 0.40 | 0.65 | 0.56 | 11.93 | 17 |
| UGC 9913§ | 35 | 7.340 | 1.80 | 20 | 64.93 | 0.14 | 0.55 | 0.62 | 12.10 | – |
| IR 08572+3915∗,§ | 7 | 6.590 | 2.00 | 3 | 64.93 | 0.95 | 0.25 | 0.56 | 11.76 | |
| UGC 8696§ | 20 | 7.650 | 1.95 | 37 | 56.72 | 0.20 | 0.37 | 2.23 | 11.99 | |
| IR 15250+3609§ | 20 | 7.289 | 2.00 | 16 | 53.66 | 0.47 | 0.70 | 0.97 | 11.85 | |
| IR 10565+2448§ | 45 | 7.910 | 2.00 | 60 | 47.43 | 0.29 | 0.14 | 1.80 | 11.94 | – |
| UGC 5101§ | 7 | 7.440 | 1.95 | 22 | 50.85 | 0.18 | 0.20 | 3.93 | 11.88 | 1 |
| IZW 107 | 30 | 7.770 | 2.00 | 40 | 33.13 | 0.17 | 0.27 | 1.96 | 11.79 | – |
| IR 01364-1042 | 10 | 7.290 | 2.00 | 14 | 116.1 | 0.53 | 0.50 | 1.95 | 11.67 | |
| IR 10173+0828 | 40 | 7.200 | 2.00 | 14 | 42.22 | 0.27 | 0.41 | 0.41 | 11.68 | – |
| Arp 299∗ | 25 | 7.756 | 2.00 | 43 | 31.75 | 0.17 | 0.70 | 2.28 | 11.68 | – |
| UGC 4881 | 40 | 7.986 | 2.00 | 44 | 49.97 | 0.22 | 0.20 | 2.42 | 11.64 | – |
| CGCG 436-30§ | 15 | 7.500 | 2.00 | 24 | 45.09 | 0.15 | 0.60 | 2.11 | 11.55 | |
| IC 1623 | 25 | 7.635 | 1.80 | 24 | 39.63 | 0.17 | 0.51 | 1.73 | 11.60 | – |
| NGC 1614∗ | 20 | 7.840 | 2.00 | 50 | 33.13 | 0.17 | 0.30 | 3.46 | 11.48 | |
| UGC 8387§ | 20 | 7.720 | 1.95 | 33 | 63.65 | 0.28 | 0.20 | 2.62 | 11.55 | – |
| NGC 7469∗ | 30 | 7.938 | 2.00 | 45 | 33.13 | 0.16 | 0.43 | 2.89 | 11.55 | |
| UGC 2369 | 25 | 7.840 | 2.00 | 36 | 31.70 | 0.12 | 0.67 | 2.77 | 11.55 | – |
| IIIZW 35 | 45 | 7.545 | 1.95 | 35 | 61.20 | 0.18 | 0.55 | 0.78 | 11.50 | – |
| IC 5298∗ | 20 | 7.900 | 2.00 | 60 | 30.88 | 0.10 | 0.42 | 4.00 | 11.53 | – |
| Arp 148 | 20 | 7.735 | 1.80 | 27 | 75.07 | 0.20 | 0.24 | 2.72 | 11.49 | – |
| NGC 2623§ | 35 | 7.726 | 2.00 | 30 | 71.94 | 0.32 | 0.35 | 1.52 | 11.45 | |
| Mrk 331 | 45 | 7.910 | 2.00 | 35 | 53.66 | 0.14 | 0.70 | 1.80 | 11.38 | |
| NGC 34 | 20 | 7.875 | 2.00 | 65 | 42.23 | 0.14 | 0.45 | 3.75 | 11.39 | |
| NGC 5256 | 15 | 7.630 | 1.75 | 15 | 45.09 | 0.30 | 0.60 | 2.84 | 11.41 | 5 |
| UGC 6436 | 30 | 7.990 | 1.90 | 34 | 40.89 | 0.05 | 0.37 | 3.25 | 11.39 | – |
| NGC 6286 | 10 | 7.640 | 1.80 | 23 | 94.25 | 0.50 | 0.47 | 4.36 | 11.20 | |
| Error (%) | 13.0 | 23.0 | - | 36.0 | 14.0 | 24.0 | - | 12.0 | 6.0 | - |
| NAME | Tth | ||||||||||
|---|---|---|---|---|---|---|---|---|---|---|---|
| (M⊙) | (M⊙) | (M⊙) | (M⊙) | (M⊙) | () | () | |||||
| UGC 8058 | 0.03 | 3.0 | 10.26 | 8.26 | 10.08 | 10.40 | 11.41 | 681.5 | 435.8 | 20.7 | |
| IR 14348-1447 | 2e-3 | 12.5 | 10.44 | 8.44 | 9.86 | 9.86 | 10.95 | 492.3 | 336.3 | 20.7 | |
| IR 12112+0305 | 0.28 | 13.8 | 10.44 | 8.44 | 9.98 | 9.59 | 11.07 | 508.3 | 502.9 | 50.4 | |
| IR 05189-2524 | 0.02 | 5.0 | 10.02 | 8.02 | 9.62 | 9.18 | 10.51 | 260.8 | 225.8 | 66.4 | |
| UGC 9913 | 0.56 | 7.0 | 10.65 | 8.65 | 9.79 | 9.80 | 11.10 | 288.3 | 235.1 | 33.2 | |
| IR 08572+3915 | 0.58 | 1.9 | 9.16 | 7.16 | 9.14 | 8.90 | 10.13 | 205.5 | 129.8 | 78.9 | |
| UGC 8696 | 0.01 | 7.7 | 10.41 | 8.41 | 9.71 | 10.25 | 11.19 | 400.8 | 137.8 | 19.3 | |
| IR 15250+3609 | 1.08 | 2.0 | 9.77 | 7.77 | 9.44 | 9.61 | 10.67 | 209.8 | 154.5 | 29.6 | |
| IR 10565+2448 | 7e-3 | 25.0 | 10.29 | 8.29 | 9.75 | 10.36 | 11.27 | 281.5 | 116.3 | 25.4 | |
| UGC 5101 | 0.13 | 20.9 | 10.55 | 8.55 | 9.81 | 10.10 | 11.08 | 454.8 | 71.5 | 4.8 | |
| IZW 107 | 0.03 | 13.0 | 10.24 | 8.24 | 9.50 | 10.12 | 11.06 | 225.8 | 87.2 | 22.5 | |
| IR 01364-1042 | 0.76 | 3.7 | 9.66 | 7.66 | 9.38 | 9.55 | 10.50 | 180.7 | 91.7 | 26.0 | |
| IR 10173+0828 | 0.67 | 7.0 | 10.06 | 8.06 | 9.36 | 9.28 | 10.66 | 120.3 | 109.7 | 41.7 | |
| Arp 299 | 0.03 | 5.3 | 10.19 | 8.19 | 9.41 | 10.07 | 11.00 | 207.4 | 67.3 | 15.6 | |
| UGC 4881 | 1e-3 | 21.0 | 10.05 | 8.05 | 9.39 | 10.25 | 11.12 | 184.0 | 53.8 | 24.7 | |
| CGCG 436-30 | 0.39 | 6.4 | 10.02 | 8.02 | 9.20 | 9.67 | 10.65 | 146.5 | 58.0 | 23.1 | |
| IC 1623 | 4e-4 | 10.8 | 10.18 | 8.18 | 9.41 | 9.78 | 10.82 | 139.2 | 65.5 | 19.4 | |
| NGC 1614 | 0.24 | 11.6 | 9.89 | 7.89 | 9.12 | 10.09 | 10.95 | 179.6 | 29.4 | 18.1 | |
| UGC 8387 | 0.31 | 17.1 | 10.07 | 8.07 | 9.52 | 9.93 | 10.84 | 160.9 | 43.5 | 14.8 | |
| NGC 7469 | 0.02 | 14.3 | 10.04 | 8.04 | 9.24 | 10.20 | 11.06 | 181.2 | 40.8 | 20.1 | |
| UGC 2369 | 0.13 | 11.4 | 10.28 | 8.28 | 9.36 | 10.13 | 11.04 | 194.1 | 47.3 | 23.7 | |
| IIIZW 35 | 0.64 | 2.3 | 10.07 | 8.07 | 9.33 | 9.46 | 10.64 | 81.9 | 60.0 | 29.1 | |
| IC 5298 | 0.03 | 12.8 | 10.28 | 8.28 | 9.28 | 10.21 | 11.06 | 206.6 | 25.5 | 26.8 | |
| Arp 148 | 0.32 | 21.6 | 10.06 | 8.06 | 9.36 | 9.90 | 10.82 | 146.2 | 37.3 | 16.8 | |
| NGC 2623 | 0.42 | 8.7 | 9.77 | 7.77 | 9.28 | 9.70 | 10.66 | 95.3 | 47.0 | 23.1 | |
| Mrk 331 | 0.17 | 9.9 | 10.08 | 8.08 | 9.23 | 9.87 | 10.82 | 91.3 | 37.7 | 31.8 | |
| NGC 34 | 0.01 | 7.8 | 9.93 | 7.93 | 9.08 | 10.05 | 10.91 | 150.7 | 21.0 | 18.3 | |
| NGC 5256 | 0.01 | 15.0 | 9.77 | 7.77 | 9.25 | 9.85 | 10.73 | 164.7 | 40.7 | 11.0 | |
| UGC 6436 | 0.19 | 27.1 | 10.36 | 8.36 | 9.07 | 10.12 | 11.04 | 135.3 | 25.0 | 22.2 | |
| NGC 6286 | 5e-3 | 13.6 | 9.65 | 7.65 | 9.35 | 9.77 | 10.59 | 136.1 | 14.0 | 5.2 | |
| Errors (%) | - | - | 56.0 | 56.0 | 17.0 | 22.0 | 8.0 | 3.0 | 7.0 | - |
| NAME | ||||||||
|---|---|---|---|---|---|---|---|---|
| (deg) | (deg) | (m) | (pc) | |||||
| UGC 8058 | 40 | 1000 | 0.5 | 20 | 6.0 | 0.3 | 10.0 | 68.98 |
| IR 14348-1447 | 46 | 3000 | 0.5 | 40 | 0.0 | 0.3 | 3.0 | 99.00 |
| IR 05189-2524 | 41 | 1000 | 0.0 | 40 | 0.0 | 0.5 | 10.0 | 47.29 |
| IR 08572+3915 | 77 | 1000 | 1.0 | 40 | 6.0 | 0.3 | 10.0 | 62.48 |
| UGC 8696 | 74 | 1000 | 0.5 | 40 | 6.0 | 1.0 | 10.0 | 29.01 |
| IR 15250+3609 | 90 | 300 | 1.0 | 40 | 0.0 | 0.3 | 10.0 | 10.38 |
| UGC 5101 | 10 | 3000 | 1.0 | 40 | 3.0 | 0.3 | 3.0 | 56.44 |
| IR 01364-1042 | 62 | 300 | 0.0 | 20 | 3.0 | 1.0 | 10.0 | 6.01 |
| CGCG 436-30 | 40 | 1000 | 0.0 | 40 | 0.0 | 0.3 | 10.0 | 18.08 |
| NGC 1614 | 74 | 1000 | 1.0 | 40 | 6.0 | 1.0 | 10.0 | 22.24 |
| NGC 7469 | 21 | 1000 | 0.0 | 20 | 0.0 | 1.3 | 3.0 | 19.67 |
| NGC 2623 | 22 | 3000 | 0.5 | 20 | 0.0 | 0.3 | 3.0 | 22.44 |
| Mrk 331 | 48 | 3000 | 0.5 | 40 | 6.0 | 0.3 | 10.0 | 32.05 |
| NGC 34 | 60 | 1000 | 0.5 | 40 | 0.0 | 0.3 | 1.0 | 9.79 |
| NGC 5256 | 39 | 3000 | 1.0 | 40 | 0.0 | 0.3 | 1.0 | 67.58 |
| NGC 6286 | 40 | 3000 | 1.0 | 20 | 6.0 | 0.3 | 10.0 | 32.57 |
(a) Maximum radius of the torus model. It was calculated from the equation given in Sect. 3 in Granato & Danese (1994) for and the value of the parameter given in Col. (3) of this Table.
| NAME | L1-5/AGN | L3-30/AGN | L8-1000/AGN | L1-1000/AGN | L40-500/AGN | L3-1100/AGN | Lbol/AGN |
|---|---|---|---|---|---|---|---|
| (L) | (L) | (L) | (L) | (L) | (L) | (L) | |
| UGC 8058∗,‡,§ | 11.64/71 | 11.66/42 | 12.42/16 | 12.51/24 | 12.18/7 | 12.48/21 | 12.51/24 |
| IR 14348-1447‡ | 10.75/56 | 11.48/27 | 12.21/8 | 12.23/10 | 12.07/6 | 12.23/10 | 12.23/10 |
| IR 05189-2524∗,‡,§ | 11.01/74 | 11.60/30 | 12.01/17 | 12.07/23 | 11.75/13 | 12.05/20 | 12.20/23 |
| IR 08572+3915∗,‡,§ | 10.88/91 | 11.64/81 | 12.04/47 | 12.09/52 | 11.77/30 | 12.09/52 | 12.09/52 |
| UGC 8696§ | 10.68/14 | 11.29/29 | 12.05/11 | 12.07/12 | 11.90/6 | 12.06/12 | 12.08/12 |
| IR 15250+3609§ | 10.45/30 | 11.37/49 | 11.94/20 | 11.97/21 | 11.73/8 | 11.96/21 | 11.97/21 |
| UGC 5101‡,§ | 10.71/53 | 11.06/12 | 11.89/1 | 11.92/4 | 11.79/0 | 11.90/2 | 11.97/6 |
| IR 01364-1042 | 10.13/16 | 10.85/60 | 11.73/11 | 11.74/12 | 11.61/3 | 11.74/12 | 11.75/12 |
| CGCG 436-30§ | 10.38/42 | 10.92/14 | 11.57/5 | 11.61/7 | 11.41/3 | 11.59/6 | 11.71/10 |
| NGC 1614∗ | 10.55/18 | 11.11/37 | 11.58/18 | 11.63/19 | 11.35/8 | 11.61/20 | 11.65/18 |
| NGC 7469∗ | 10.76/20 | 11.06/25 | 11.55/10 | 11.63/12 | 11.36/4 | 11.59/12 | 11.70/13 |
| NGC 2623§ | 10.25/15 | 10.56/12 | 11.46/2 | 11.50/3 | 11.37/1 | 11.48/3 | 11.51/3 |
| MRK 331 | 10.47/20 | 10.71/20 | 11.40/5 | 11.46/6 | 11.27/3 | 11.43/6 | 11.48/6 |
| NGC 34 | 10.47/17 | 10.79/17 | 11.40/4 | 11.46/5 | 11.24/1 | 11.43/5 | 11.48/5 |
| NGC 5256 | 10.79/45 | 10.91/25 | 11.43/5 | 11.54/12 | 11.28/2 | 11.47/8 | 11.71/16 |
| NGC 6286 | 10.50/32 | 10.46/41 | 11.22/5 | 11.31/9 | 11.15/1 | 11.26/8 | 11.33/9 |
| NAME | H | J | K | IRAC1 | IRAC2 | IRAC3 | IRAC4 | MIPS1 | MIPS2 | MIPS3 |
|---|---|---|---|---|---|---|---|---|---|---|
| 1.23m | 1.66m | 2.16m | 3.55m | 4.5m | 5.73m | 8m | 24m | 70m | 160m | |
| (Jy/) | (Jy/) | (Jy/) | (Jy/) | (Jy/) | (Jy/) | (Jy/) | (Jy/) | (Jy/) | (Jy/) | |
| UGC 8058∗,‡,§ | 0.06/24 | 0.11/52 | 0.21/76 | 0.38/90 | 0.48/82 | 0.70/62 | 1.16/43 | 6.75/27 | 34.91/6 | 14.82/3 |
| 0.70/62 | 0.85/64 | 6.70/27 | ||||||||
| IR 14348-1447‡ | 1.7E-3/5 | 2.5E-3/11 | 3.2E-3/34 | 0.01/83 | 0.02/79 | 0.04/55 | 0.08/31 | 0.57/18 | 6.92/6 | 4.22/3 |
| IR 05189-2524∗,‡,§ | 0.02/77 | 0.03/83 | 0.04/90 | 0.07/88 | 0.11/65 | 0.21/41 | 0.43/27 | 2.62/24 | 12.94/12 | 5.86/6 |
| 0.15/57 | 0.28/41 | 2.78/23 | ||||||||
| IR 08572+3915∗,‡,§ | 1.7E-3/26 | 2.8E-3/44 | 3.7E-3/63 | 0.02/95 | 0.07/97 | 0.17/95 | 0.26/92 | 1.67/72 | 6.78/27 | 1.83/18 |
| 0.19/85 | 0.34/71 | 1.54/78 | ||||||||
| UGC 8696§ | 0.02/2 | 0.03/4 | 0.03/11 | 0.02/34 | 0.03/38 | 0.08/27 | 0.20/22 | 2.40/31 | 22.82/6 | 12.07/2 |
| 0.07/27 | 0.16/27 | 2.10/35 | ||||||||
| IR 15250+3609§ | 4.3E-3/0 | 5.5E-3/0 | 4.9E-3/0 | 3.7E-3/17 | 0.01/59 | 0.05/64 | 0.12/55 | 1.27/47 | 7.23/6 | 2.70/2 |
| 0.04/80 | 0.10/66 | 1.25/48 | ||||||||
| UGC 5101‡,§ | 0.02/38 | 0.03/51 | 0.03/63 | 0.03/64 | 0.03/58 | 0.07/26 | 0.20/8 | 0.96/4 | 15.51/0 | 13.52/0 |
| 0.09/20 | 0.14/11 | 0.93/4 | ||||||||
| IR 01364-1042 | 4.0E-3/0 | 5.2E-3/1 | 4.9E-3/5 | 4.6E-3/31 | 4.7E-3/62 | 0.01/65 | 0.04/48 | 0.50/60 | 7.68/2 | 3.26/0 |
| CGCG 436-30§ | 0.01/26 | 0.02/34 | 0.02/48 | 0.02/64 | 0.03/53 | 0.07/27 | 0.15/15 | 1.31/8 | 10.69/3 | 5.36/1 |
| 0.04/47 | 0.12/19 | 1.31/8 | ||||||||
| NGC 1614∗ | 0.09/3 | 0.11/6 | 0.11/13 | 0.11/37 | 0.18/41 | 0.44/35 | 1.01/33 | 7.44/37 | 35.28/7 | 18.72/2 |
| NGC 7469∗ | 0.15/6 | 0.19/10 | 0.18/19 | 0.19/42 | 0.23/47 | 0.45/32 | 1.09/19 | 5.40/23 | 34.43/3 | 22.17/1 |
| NGC 2623§ | 0.04/2 | 0.05/5 | 0.05/13 | 0.04/37 | 0.04/48 | 0.09/27 | 0.21/12 | 1.73/7 | 29.29/1 | 15.04/1 |
| 0.04/61 | 0.14/18 | 1.70/7 | ||||||||
| MRK 331 | 0.06/1 | 0.07/5 | 0.07/18 | 0.08/50 | 0.09/57 | 0.16/35 | 0.35/17 | 2.05/11 | 22.51/2 | 14.04/1 |
| NGC 34 | 0.05/1 | 0.07/3 | 0.06/12 | 0.06/47 | 0.08/49 | 0.15/32 | 0.29/22 | 2.40/8 | 18.13/1 | 9.74/0 |
| NGC 5256 | 0.05/24 | 0.07/34 | 0.08/49 | 0.08/64 | 0.08/70 | 0.12/43 | 0.34/16 | 0.98/12 | 9.76/1 | 7.66/0 |
| NGC 6286 | 0.06/5 | 0.08/13 | 0.09/32 | 0.10/61 | 0.09/77 | 0.13/58 | 0.33/23 | 0.61/29 | 16.93/1 | 15.48/0 |
3.3 AGN models:
A complete description of the AGN models and the numerical method developed to compute the emitted SED can be found in Granato & Danese (1994) and Granato et al. (1997). Only the basic features are summarized here.
Several papers compared the observed IR SED of AGN with predictions from radiative transfer models within dusty tori, in order to investigate the validity of the unified model and constrain possible geometries for the obscuring structure (e.g. Pier et al. 1993, Granato et al. 1994, Efstathiou et al. 1995, Granato et al. 1997, Alonso-Herrero et al. 2001, and Nenkova et al. 2002).
The Granato & Danese (1994) code solves, through an iterative numerical scheme, the transfer equation of the radiation that originates from the central optical-UV source, in a general axisymmetric dust distribution. The dust is composed of a mixture of grains, in thermal equilibrium with the radiation field, and extends out to a maximum radius .
In the absence of precise physical ideas concerning the structure of the obscuring torus, several geometries – and associated free-parameters – are plausible and indeed have been investigated in the papers quoted above (flared discs, tapered discs, cylinders, with and without substantial clumping etc).
A problem which is usually overlooked in this kind of study, is that dust optical properties around AGN are likely to be, to some extent, peculiar. Indeed, Maiolino et al. (2001a), Maiolino et al. (2001b) presented evidence for ’anomalous’ properties of dust in AGN. Here the term ’anomalous’ is relative to the standard properties of dust grains thought to be responsible for the average Milky Way extinction law and cirrus emission. It is not surprising that the properties of dust grains might be very different in the dense and extreme environment of an AGN. In particular, dust distribution biased in favor of large grains, ranging up to 1-10 m, much larger than the usual cut at m of Mathis (1977) type models (e.g. Draine 1984, Silva et al. 1998), have been invoked.
Thus, we have adopted several different geometries, but also investigated models in which the size distribution of grains extends to radii, , larger than the standard value. Of course, the uncertainty on optical properties of dust further limits the already moderate success of this approach in constraining the geometry (see below).
The SED fitting is performed through comparison with libraries of models. Each library consists of several hundreds of models belonging to a given ”geometry class”, in which typically 4-5 parameters are varied assigning 3-4 different values to them over a quite wide range. In particular we have considered anisotropic flared discs (for definitions, see Efstathiou et al. 1995). The geometry consists of a structure whose height above the equatorial plane increases linearly with the distance in the equatorial plane (Fig. 1a in Efstathiou et al. 1995). Therefore the dust-free region is exactly conical, with half-opening angle . We also introduce (at variance with respect to Efstathiou 1995) a dependence of the dust density , and therefore of the radial optical depth, on the polar angle . The general form used for this dependence and that on the spherical coordinate is:
| (4) |
where and are model parameters.
The two additional parameters used to fully characterize the models are the ratio between the outer and inner (i.e. sublimation) radii , and the equatorial optical depth to the nucleus at m,
The parameter values used in the libraries are:
All possible combinations of parameter values are considered in the libraries. For each corresponding model we compute the SED for viewing angles from 0° to 90° in steps of 10 degrees.
The impacts of changing various parameters on the predicted SED have been explored in Granato et al. (1994) and Granato et al. (1997). Here we recall only that, roughly speaking, is related to the width of the IR bump, whilst controls mainly the NIR slope of the SEDs, as observed from obscured directions, as well as its anisotropy.
Indeed, the global result of the various work is that the nuclear SED alone does not allow a strong constraints on the precise geometry of the torus. Several individual analysis have been too optimistic in this respect, due essentially to an insufficient exploration of the parameter space. Some constraints can be put on the torus extension and on the optical thickness, and good fits are obtained with flared disc models.
However, we point out that in this paper our aim is just to asses the possible contribution of the warm AGN component to the total SED of ULIRGs, without any pretence of discriminating the precise torus characteristics.
4 Results
4.1 Model fits
The good spectral coverage from the NIR to the radio of our sample imposes strong constraints, not only on the global properties of the galaxies, i.e. SFR, but also on other important physical parameters. In the absence of an AGN, the fit to the total IR and radio luminosities is related to the star formation rate, while the detailed shape of the SED is affected mainly by the optical depth of the dust (), the escape time (), the age of the burst (ageb), the e-folding time of the burst (tb), the fraction of gas in molecular clouds (fmc) and the sub-mm dust spectral index ().
The optical depth mainly affects the MIR spectral range by varying the contribution of the MC emission in the MIR. affects the NIR region, the PAH emission, and FIR colour () by changing the contribution of un-extinguished young red supergiants to the NIR, by the heating of the cirrus from un-extinguished young stars, and by the heating of MCs from extinguished young stars, respectively. Ageb affects the radio spectral index, and in combination with tb, it has also been used to parameterize the evolutive phase of the starburst as . Higher values of , indicating more evolved starbursts, are associated with higher NIR fluxes and cooler FIR colour (see Vega et al. 2005 for a thorough discussion). fmc affects the FIR colour and the sub-millimetre region, while mainly affects the sub-millimetric region.
Summarizing, earlier evolutionary phases, longer escape times and lower dust masses in MCs combine to heat the molecular clouds producing warmer FIR colour. The sub-millimetre spectral region provides information on the dust emissivity index, and also on the total dust mass, because in this region emission from the MCs and from the diffuse components are comparable. The form of the radio spectrum is defined mainly by the age of the starburst, in the sense that younger objects have flatter radio slopes.
The presence of an AGN may also effect the shape of the SED by adding an extra warm component. Typical evidence of AGN in our observed SEDs is the presence of a near power-law shape in the NIR to FIR spectral region.
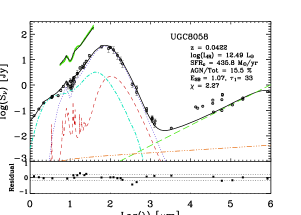
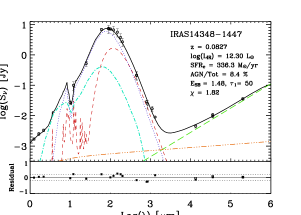
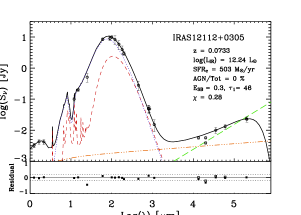
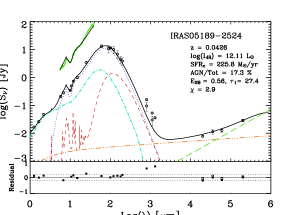
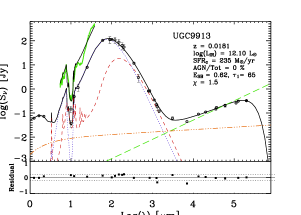
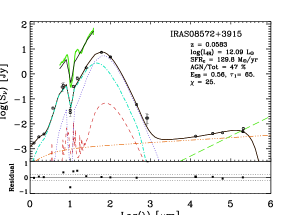
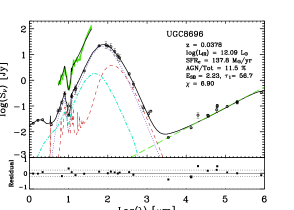
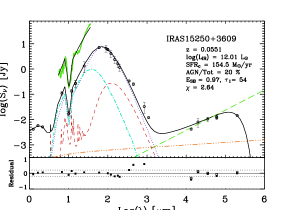
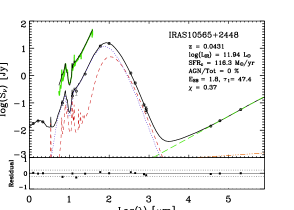
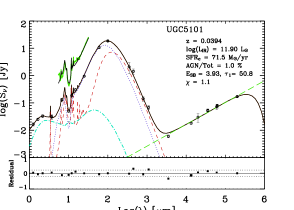
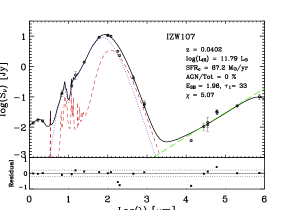
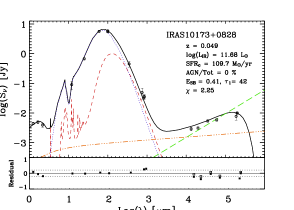
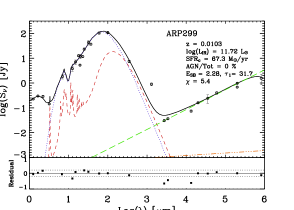
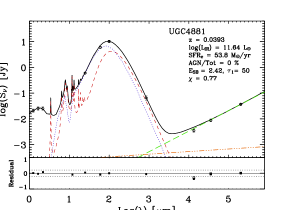
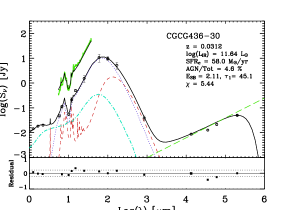
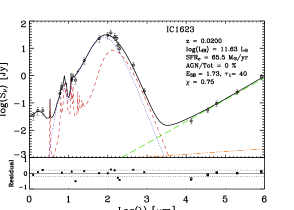
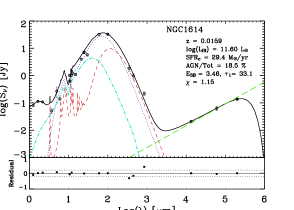
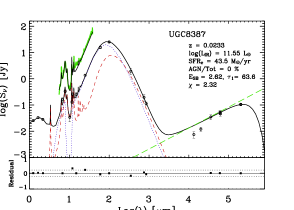
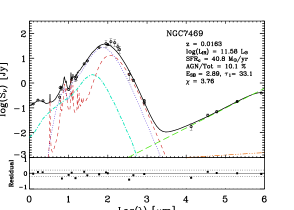
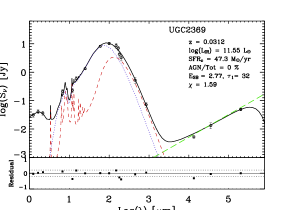
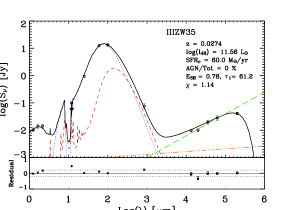
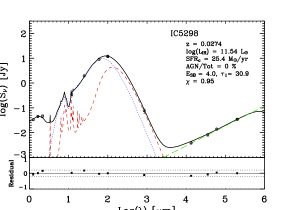
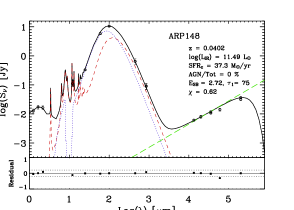
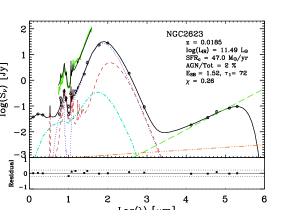
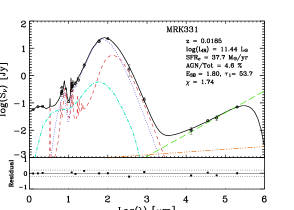
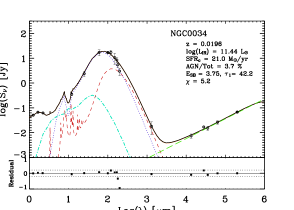
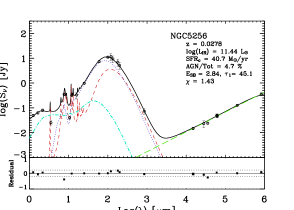
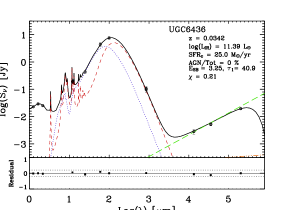
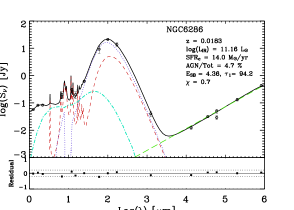
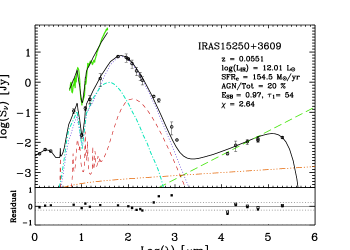
In Fig. 1 we show the full SED fits for the galaxies of our sample. The corresponding best-fit parameters of the starburst components are shown in table 5. The last three columns of the table display the value of the evolutionary phase of the starburst, , the logarithm of the IR (8-1000 m) luminosity integrated over the SB component of the SED, and the fractional contribution of the AGN to the 8-1000 m flux indicated as AGN/Tot.
Some important physical quantities derived from the best fit models are listed in Table 6. In Col. (2) we show the required free-free opacity at 1.4 GHz, , to fit the 1.4 GHz data, i.e. . Column (3) lists the fraction of the total energy of the starburst reprocessed by the cirrus component, ; Cols. (4), (5), (6), (7) and (8), show the logarithms of the current total mass of gas (i.e. MC+cirrus), ; the total mass of dust, , calculated as ; the mass involved in the MC component, , calculated from the parameter as , the mass converted in stars during the burst, , and of the final baryonic galaxy mass, , calculated as , respectively. By construction, the SFR in our starburst models is a decreasing function of time, with a characteristic e-folding time of the order of a few tens of Myr. Therefore, the SFR may change considerably during the age of the burst. We show in Cols. (9) and (10) respectively, the SFR averaged over the entire burst, , and the SFR in the last 10 Myr, i.e. the current star forming rate , as generally probed by line emission diagnostics. Notice that non-thermal emission probes typical lifetimes of the SNII production, 50 Myr. Finally, the percentage of model thermal emission to the 22 GHz flux is given in the Col. (11).
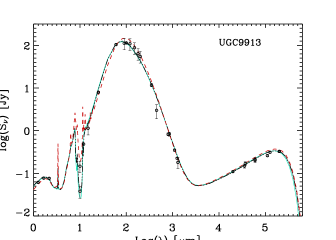
The last rows in Tables 5 and 6 list the estimate of the errors on the parameters. To estimate the errors we have assumed that the SED of UGC 9913 is representative of the starburst component of our sample of (U)LIRGs. We then calculated several simulated SEDs for UGC 9913, by randomly varying the observational data by the corresponding observational error and, for each new SED, a new fit was performed. The fractional errors on the parameters were then estimated as the ratio between their range of values and their mean value:
| (5) |
Figure 2 shows, as an example, three fits to the UGC 9913 obtained in this way. The largest values of the errors are derived for the total mass of gas and dust () because the emission in these objects is dominated by the molecular component while the cirrus component is not well constrained. The errors for the other parameters are typically .
In Table 7, we list the values of the 7 parameters for the best-fit AGN models for the 16 galaxies with emission excesses that could not be fitted by the SB model alone. As already anticipated, one of the galaxies, IRAS 01364-1042, required an AGN contribution of 11.5 %, while the number of passbands was eleven. However, the scope of this work is not the physical characterization of the AGN component but the contribution of the AGN to the luminosity expressed as an excess over the SB luminosity. In Table 8, we show the contribution of the AGN emission to the luminosity in different IR spectral ranges. In particular, the spectral ranges between 8 - 1000 m, 3 - 1100 m, and 40 - 500 m, are those used in different calibrations for the total IR luminosity (Takeuchi et al. 2005). In Table 9 we show the flux and the corresponding AGN contribution in 2MASS and Spitzer bands. These fluxes were calculated on the SED by using the appropriate filter responses. For the galaxies with Spitzer spectra the lower row provides fluxes calculated on the observed spectra in the IRAC 3 and IRAC 4 and MIPS 24m bands. In the IRAC bands, differences with models in the upper row, are mainly attributable to effects of molecular absorption bands (Lahuis et al. 2007). The maximum AGN contribution is always confined in the NIR and MIR spectral range. Actually, it was already known both from theoretical studies (e.g. Granato et al. 1997) and direct observations (e.g. Alonso-Herrero et al. 2001) that the AGN radiation field can heat the dust up to 1000-1500 K, resulting in a dust thermal emission peaking in the NIR to MIR range. Moreover, all galaxies in our sample with J-K (see Table 8) cannot be modelled with pure SB and have AGN contributions to the 1 - 5 m region higher than 50 . However, the presence of J-K colours as blue as those of typical of SB galaxies, cannot be used to discard the presence of an important AGN contribution to the IR luminosity. This is, for instance, the case of IRAS 15250+3609, with a J-K, typical of a stellar population, but whose SED fitting required a AGN contribution to the total IR luminosity. Another typical AGN diagnostic in the NIR-MIR range is the m ratio (De Grijp et al. 1985, Sanders et al. 1988). Thus, ”warm” galaxies, with are likely dominated by the AGN, while ”cold” galaxies () are probably dominated by star formation. In Table 1, we mark with a ∗ ”warm” galaxies of our sample. However, as a result, we can see in Table 8 that not all the warm galaxies needed an AGN contribution, e.g. Arp 299 () or IC 5298 (), and on the contrary, some cold galaxies, IRAS 15250+3609 (), and UGC 8696 (), needed AGN contributions to the total IR luminosity higher than .
The FIR to sub-mm spectral range is the least sensitive to the presence of an AGN. In the 40 - 500 m range, only two galaxies needed AGN contributions higher than , IRAS 05189-2524, and the completely AGN dominated, IRAS 08572+3915. Similar results have also been found by Schweitzer et al. (2006) for a sample of 27 Palomar-Green QSOs.
In summary, of the 30 galaxies of our sample, 16 needed an AGN contribution in order to fit the SEDs. Only 1 galaxy, IRAS 08572+3915, seems to need a dominant AGN contribution () to the total IR luminosity. Seven of these galaxies require an AGN contribution to the IR luminosity (8-1000 m) lower than the estimated error in the IR luminosity (, see last row of Col. 10 in Table 5). The NIR to MIR spectral range was well constrained only for the 11 galaxies with a MIR spectrum. Of those, 8 needed an AGN contribution in order to explain their SED+ MIR spectrum, and only UGC 9913, IRAS 10565+2448, and UGC 8387 could be well modelled with pure starburst models.
5 Discussion
One of the main results emerging from our investigation is that in all but one galaxy, IRAS 08572+3915, the starburst dominates the bolometric ( IR) emission of the source, with a fractional contribution that is always larger than 80%. About half of the sample can actually be fitted by a pure starburst.
We thus begin the discussion by looking into the main features of the SB components of (U)LIRGs and their possible differences with respect to normal starburst galaxies.
5.1 The Starburst Component
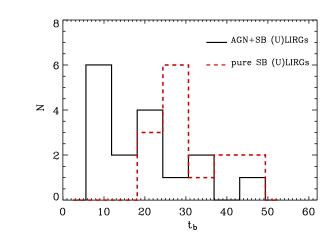
All the pure-starburst (U)LIRGs in our sample have e-folding times ranging between 20 to 50 Myrs, while some shorter e-folding times are obtained for the mixed (AGN + SB) sub-sample. In Fig.3, we show the distribution of for pure SB and mixed (U)LIRGs. A K-S test for the two distributions indicates a high probability that the two distributions are different. This would indicate that (U)LIRGs with an AGN are characterized by a more rapidly declining SFR, than pure starburst (U)LIRGs. An exciting interpretation of this finding is that the SFR itself suffers negative feedback from the AGN.
On the contrary, no significant differences are found in the other parameters, i.e. dust opacities, escape times, etc.
The ranges of ages varies between yr for IRAS 08572+3915 to yr for UGC 6436, with a small trend for older bursts in pure SB objects.
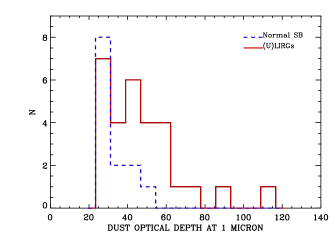
More interesting is the comparison of the MC optical depth, , and the degree of obscuration, measured by the quantity , between (U)LIRGs and normal starburst galaxies. Both parameters indicate that (U)LIRGs constitute a population of very dust enshrouded objects with respect to normal starburst galaxies. In Fig. 4, we show the distributions of (left panel) and (right panel) for our sample of (U)LIRGs (solid line) and the sample of normal starburst from Vega et al. (2005) (dashed line). Both histograms indicate that (U)LIRGs and starburst are two very distinct populations and that, consequently, the infrared properties of (U)LIRGs cannot be obtained from those of starburst galaxies just by re-scaling them to higher star formation rates.
The values of the SB evolutionary parameter, , show that many LIRGs and ULIRGs (15/30) are found in the peak phase of the starburst phenomenon (). None of galaxies is in the early phase (); 14 are in an older phase (), and only one, the least IR luminous NGC 6286, is found in the post-starburst phase. The starburst phase defined by the IR colours (an observational quantity) is in perfect agreement with that defined by the parameter (a theoretical quantity), see Fig. 5. In the same figure we notice that when the estimated AGN contribution is subtracted from the fluxes in the IR bands, (U)LIRGs with AGN fall on the same trend as pure starburst (U)LIRGs (open circles connected to solid circles), indicating that our determination of the AGN contributions is robust.
Another important quantity derived from our fits is the mass of dust. Dunne et al. (2000) have published dust mass measurements for their SLUGS sample, which includes some of our objects. In general, there is a very good agreement between their determinations from 850 m observations and ours. However, for three galaxies, IRAS 08572+3915, IRAS 15250+3909, and NGC 1614, their estimates are considerable higher than ours, reaching one order of magnitude in the case of IRAS 08572+3915. The likely origin of the discrepancy is that Dunne et al. (2000) determinations are based on the assumption that the dust emitting in the sub-mm range is cold (T K), while GRASIL accounts for a distribution of dust temperatures within the ISM. In the above three galaxies we can see, from the fits, that the sub-mm spectral range is still dominated by a warm MC component which thus require a significantly lower dust mass. We believe that our estimate is more correct, since it is based on the fit to the whole MIR-FIR-sub-mm spectral range.
The total baryonic mass derived for our sample of (U)LIRGs is also in good agreement with dynamical mass estimates (e.g. Genzel et al. 2001, Colina, Arribas & Monreal-Ibero 2005, Dasyra et al. 2006). Moreover, our estimates of the total gas mass are in agreement with those derived from available observations in HI and in CO, see for instance Cols. 7 and 8 in Table 4 by Dunne et al. (2000), provided that a reduced conversion factor (X-factor) between CO luminosity and mass of molecular gas is used (Solomon et al. 1997).
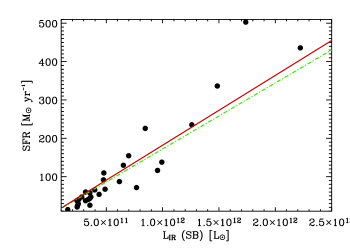
Finally, in Fig. 7 we plot the current SFR versus the AGN corrected IR luminosity of the best-fit models, . The solid line represents the best linear fit to the data, i.e. ( L). By comparison we also plot the SFR/ calibration of Kennicutt (1998) (dashed line). The two calibrations coincide within the accuracy of the models (Kennicutt 1998).
5.2 Spitzer spectra
In our starburst models the MIR spectral domain is largely dominated by the MC component. However, in (U)LIRGs this spectral region may be significantly affected by the presence of an AGN. The interpretation of the MIR broad band fluxes may be affected by a degeneracy between the optical depth of the MCs and the contribution of the putative AGN. Indeed observed warm MIR colours may be almost equally well reproduced by increasing the MC optical depth and, at the same time, increasing the AGN contribution (see e.g. IRAS 08572+3915 in Fig. 1 of Prouton et al. 2004.) However an increase of the MC optical depth has the effect of strengthening the m silicate absorption feature. Thus, a possible way to break this degeneracy is to complement the broad band fluxes with the 5 - 35 m Spitzer IRS spectrum which carries a great deal of additional information.
We thus searched for Spitzer IRS spectra of our ULIRG sample in the SSC archive and found them for 11 galaxies. For these galaxies the fitting procedure includes also the Spitzer spectra which are shown in Fig. 1, together with the corresponding models, upwardly displaced by one dex, as solid thick and solid thin lines, respectively.
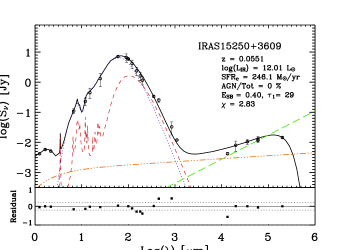
The largest effect, after accounting for the analysis of the Spitzer spectra, was found for IRAS 15250+3609. As an illustration purpose, Fig. 6 shows how the inclusion of the IRS spectrum changes our spectral classification of IRAS 15250+3609. The left panel shows the best fit to the broad band SED alone. The 20 continuum passbands are very well fitted by a pure SB model with e-folding time of 25 Myr, age of yr, of 29 and a large current star forming rate, . However, the IRS spectrum of IRAS 15250+3609 shows the presence of a deep silicate absorption feature at m (right panel). With a starburst alone, it is not possible to reproduce the large optical depth required by this silicate absorption feature and the emission in the MIR-FIR continuum, at once. Indeed, the fit shown in the right panel includes an obscured AGN (torus inclination ) contributing of the IR (8-1000 m) luminosity, and about to the MIR luminosity. We notice that, though the contribution of the AGN is only 20% of the IR luminosity, other quantities have changed by a significant factor. The optical depth of MC has almost doubled, and now it fits better in the range of (U)LIRGs. The current SFR has decreased from M to M while the model still fits very well the radio data. This happens because the evolutionary phase becomes more advanced (E instead of 0.4) and what actually fuels the radio flux is the the SNII rate, which probes a time interval five times larger than the 10 Myr adopted for the current SFR. It is worth noticing that the common belief (e.g. Elvis et al. 1994) is that the presence of the AGN eventually dilutes the m feature. IRAS 15250+3609 actually shows the opposite case, since the m feature is intrinsically less pronounced in the less opaque MCs of the pure starburst model.
In the other 10 galaxies, the inclusion of the IRS spectrum did not change our classification, although it allowed a more accurate estimate of the SB parameters and, of the AGN contribution.
In summary, of the subsample with IRS spectra, three galaxies, UGC 9913, IRAS 10565+2448 and UGC 8387, were still well fitted by pure SB models. Seven galaxies, UGC 8058, UGC 8696, UGC 5101, NGC 2623 CGCG 436-30, IRAS 05189-2524 and IRAS 08572+3915 were fitted with almost the same SB and AGN components. In IRAS 15250+3609 the IRS spectra revealed the presence of an almost entirely obscured AGN contributing 20% of the IR luminosity. This is where the combined analysis of the IRS spectra and panchromatic SED exploits its maximum capability.
5.3 Star formation versus AGN
Sixteen galaxies (53 %) of our sample of 30 (U)LIRGs require an AGN contribution in order to fit their SEDs. However, only 9 (30%) need a contribution to the IR luminosity which is higher than 10 . In most cases it is lower than 20 %. Only one galaxy, IRAS 08572+3915, seems to be AGN dominated (, see the discussion below). In 2/30 (6%) objects, the AGN contribution (8-1000 m) is less than 2%. In these objects the AGN contribution is more important at NIR wavelengths, where it may reach 15% or more, as for UGC 5101 (), while the AGN contribution to the IR (8-1000) luminosity is . However, it is worth remarking that UGC 5101 shows an evident power law NIR SED and [NeV]15m emission in the Spitzer IRS spectrum (Armus et al. 2004). In the remaining 5/30 (17%) the AGN contribution (8-1000) is of the order of 5%.
For those objects that have been observed with Spitzer, we find that our estimates of the AGN contribution agree very well with those derived by Armus et al. (2007) using the line ratios Ne[V]/Ne[II] or O[IV]/Ne[II], although many of their values are quoted as upper limits. We find a different result for two galaxies, IRAS 14348-1447 and IRAS 15250+3609. The first was classified as a pure SB by Armus et al. (2007), based on the strength of the PAH features. However, we require an AGN contribution of about 10 to the IR luminosity, in order to match its red NIR colour (J-K). In the case of IRAS 15250+3609, Armus et al. find that the power source remains buried even in the MIR, while our analysis of the NIR to radio SED (including the IRS spectrum) requires a buried AGN contributing about 20 % to the IR luminosity.
Armus et al. (2007) have estimated the AGN fractions also with other methods, using either the equivalent width of the PAH feature, or the mid-infrared spectral slope, or the ratio between the total PAH flux and the IR flux. These methods provides AGN fractions that are in general very much higher than those obtained by analyzing the high ionization line ratios which are similar to our values (see appendix for comparisons for individual objects). Therefore, our work supports the notion that neither the mid-infrared slope nor the PAH equivalent widths or relative fluxes provide a good estimate of the AGN contribution (see conclusions in Vega et al. 2005).
Summarizing the above results, we find that the contribution of the AGN is well determined in 10/30 objects (33%), while in 5/30 objects it is minimal (5%). In the remaining 15/30 objects (50%) the SED can be well fitted by almost pure starbursts because the total contribution of the AGN is , less than the accuracy of the model in all bands. Even in the objects where the presence of the AGN is well determined, only in one case, IRAS 08572+3915, does the AGN dominate the bolometric luminosity. In general, the optical spectral types of the galaxies (Col. 9 in Table 1) agree very well with the results from the SED analysis. All galaxies classified as ”HII” were well modelled with pure SB models. While those classified as ”Sy” needed some AGN contributions. The situation is less clear for galaxies classified as Liners. Some of them (4) were modelled with pure SB models, while 5 of them, IRAS 14348-1447, IRAS 15250+3609, IRAS 01364-1042, CGCG 436-30 and NGC 6286, required of the presence of a buried AGN.
Since only 11/30 objects have published Spitzer IRS data that can be used to add further constraints to our fitting procedure, we cannot definitely rule out that the AGN contribution be larger and, in particular, that our conclusions on some pure starbursts need revision. It is, however, less likely that the inclusion of Spitzer spectra changes our conclusion of the overall dominant contribution of the SB in (U)LIRGs (see Sect. 5.2).
5.4 SED fits at radio frequencies
In paper I we found a systematic deficit of the 22 GHz emission in our galaxies when compared with that expected from the radio spectral slope calculated at lower frequencies (Clemens et al. 2007 ). Actually, Fig. 1 shows that the 22 GHz data fall below the best fit model in 19/30 of the galaxies. In 16 out of 19 objets the differences between models and 22 GHz data are small, most of them within the , as can be seen from the residual plots of the same figure. For 9 objects the 22 GHz deficit is within the observational error. For the other 7 we notice that the 22 GHz flux, though below the total predicted radio emission, actually falls above the predicted synchrotron emission (long dashed line in the plots). Thus a possible explanation is that the deficit at 22 GHz may be due a deficit of thermal emission caused by absorption of ionizing photons by dust within the HII regions (Valdés et al. 2005). In the above 7 objects we estimate that the fractional absorption is between 20% to 40%, as can be seen from the open squares in the residual plots of Fig. 1. Finally, three galaxies, UGC 8387, IZW 107 and Arp 199, show a deficit in the high frequency radio emission that can not be explained by observational errors (unless we have severely underestimated it) or by dust absorption. We are currently investigating the eventual origin of this discrepancy (Clemens et al. in preparation).
Two galaxies of the sample, UGC 8058 and UGC 8696, show variability at radio frequencies (Fig. 1, Paper I) on a timescale of a few years (Condon et al. 1991). In the case of UGC 8058 the higher radio fluxes in Fig. 1 are from observations taken on the same day. They are higher by about 0.4 dex and have a slope which is strikingly similar to that at the lower radio fluxes. The latter data result from observations taken over a period of about 15 Years. The variability may be an indication that the AGN actually powers sporadic emission which dominates at radio frequencies (Lonsdale et al. 2003). On the other hand it is likely that the lower fluxes are the genuine emission from the starburst, because, in the other alternative and given the amplitude of variability, they should show a much larger scatter around the synchrotron relation. In the fitting procedure we have thus assumed that the lower level radio emission is representative of the starburst. Both galaxies have published IRS spectra which, together with the broad band SED, are well fitted by a composite model, SB plus AGN.

5.5 Molecular masses in very actively star forming galaxies
Our SED fitting technique allows a fairly accurate determination of the main physical parameters of the power sources in compact (U)LIRGs, and in particular, a full characterization of the starburst component. One of the quantities that we derive directly from the fit is the mass of the obscuring dust present in the dense molecular clouds. This can be converted into a mass of dense molecular gas associated with star formation, after assuming a suitable gas/dust mass ratio. This method of determining the mass of dense molecular gas in galaxies with high star-formation rates, may constitute a viable alternative to the more traditional methods based on the molecular tracers of high density regions (e.g. HCN, see Gao & Solomon 2004a and references therein).
In order to obtain molecular gas masses from the dust masses, we have adopted a conservative value of G/D=100 which is typical of nearby star forming galaxies. This value seems adequate also for our sample because there is evidence that the metallicity in these objects is around solar (Rupke, Veilleux & Baker 2007). Furthermore, our chemical evolution models indicate that the metallicity of the gas changes by less than 30% during the whole duration of the burst. This allows us to assume a constant dust to gas ratio for all the objects, independent of their evolutionary status.
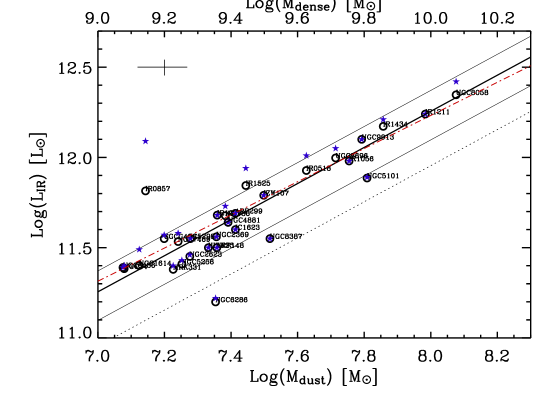
In Fig. 8 we plot the infrared luminosity (8 - 1000 m) against the values of the dust masses of our objects. In the upper horizontal axis we show the corresponding molecular masses, obtained by assuming G/D=100. The existence of the tight linear correlation between the infrared luminosity and the dust mass of the dense star forming component, reproduced in Fig. 8, is a natural consequence of the fact that the infrared emission in our objects is dominated by the MC component. The correlation coefficient is R, and the non-parametric Kendall tau coefficient is , indicating a very low probability of non-correlation. Assuming G/D=100 we find that the best-fit (logarithmic) relation for the galaxies of our sample is
| (6) |
or, in linear form,
| (7) |
This relation is plotted in the figure as a thick solid line, while the thin solid lines correspond to the one-sigma deviation around the mean relation.
It is also remarkable that objects with a significant contribution from an AGN lie above this relation. However, when the contribution of the AGN to the IR luminosity is subtracted, these objects nicely fit on the relation. The unique exception is IRAS 08572+3915 which seems to require an IR contribution from the AGN even higher than the value of 47% obtained from the SED fit.
All these findings support the existence of a fairly robust correlation between the infrared luminosity and dust/gas mass of the star forming component, which could possibly be used to determine the fractional contribution of the AGN in luminous IR objects where the gas mass is known by other methods.
As a check of our finding, we have compared our results with that obtained by Gao and Solomon (2004a) for their sample of 64 star forming galaxies. For these objects, they derived a tight correlation between the HCN luminosity and the IR luminosity, that was interpreted as evidence that both originate in the same region. They obtained the mass of dense molecular gas from the observed LHCN by adopting a conversion factor
| (8) |
assuming a typical density of cm-3 and brightness temperature T K. Their relation between IR luminosity and dense mass is shown in Fig 8 as a dotted line:
| (9) |
Their relation falls below our relation by about a factor of two. In order to understand the origin of this discrepancy we searched the Gao & Solomon sample for common objects and derived the conversion factors, , between our estimated gas masses and the HCN luminosities quoted by them.
Table 10 lists the values of the IR and HCN luminosities of the 15 common galaxies444Actually, there are 14 galaxies in common between the two samples. We also included in the study IRAS 12112+0305 from the Graciá-Carpio et al. (2006) sample while Fig. 9 shows the derived against the IR luminosity. The median value of for the common objects is 6.0 M⊙(K km s-1pc with 87 of the galaxies having . The exceptions are Arp 299, and NGC 1614 that are also outliers in the Gao & Solomon correlation. These galaxies have values of , while the mean value of in their sample is 900 - 1200, implying significantly weaker HCN emission.
Our median value of is about half that derived by Gao & Solomon (2004a) for their full sample. However the factor derived by by Gao & Solomon (2004a) is certainly biased towards normal galaxies, that constitute the majority of their sample, and may not be representative of the more extreme conditions of the molecular gas in (U)LIRGs. That a lower factor would be more appropriate for (U)LIRGs was also argued by Gao & Solomon (2004a), who noticed that this factor is a sensitive function of the brightness temperature, Tb, that can be higher in (U)LIRGs. Indeed, that conversion factors between molecular gas mass and luminosity may be lower in more extreme star forming conditions has already been found for CO emission (Solomon et al. 1997, Downes & Solomon 1998). Moreover brightness temperatures reaching hundreds of kelvins have been found in massive Galactic star forming cores (Boonman et al. 2001).
Making the same approximation as Gao & Solomon, that the HCN emission originates in gravitationally bound cloud cores, and assuming the same core density of n(H cm-3, we estimate from equation 8 that our would require a T K.
Actually, an accurate determination of the conversion factor between HCN and the mass of the very dense molecular gas needs more extensive studies, including observations of HCN lines at higher frequencies. In this respect, we anticipate that preliminary results of the combined analysis of the SED and the high excitation HCN transitions in Arp 220 (Vega et al. in preparation) indicate that these high brightness temperatures are likely, but also that other factors (abundances, densities, velocity gradients) affect the derived value of . Greve et al. (2006), in their very extensive study of the molecular emission in Arp 220, derived a likely range of dense molecular masses of [0.6 - 2.0] M⊙. Their derived lower limit corresponds to our derived value. We notice also that the upper limit of Greve et al. exceeds the dynamical mass estimated by Downes & Solomon (1998).


We finally notice that IRAS 08572+3915 falls significantly above the correlation, suggesting that we could have overestimated the SB contribution. However, a further decrease of the SB component is incompatible with the radio SED, dominated by thermal emission, so that a fraction of it should be attributed to the AGN. Alternatively, the starburst in IRAS 08572+3915 could be characterized by a metallicity significantly lower than the average in the sample. In fact, while the typical metallicity of (U)LIRGs is 1.1 solar (Rupke, Veilleux & Baker 2007) that of IRAS 08572+3915 is only 0.8 solar (as obtained from the N2 calibrator, Denicoló, Terlevich & Terlevich 2002 and optical emission lines Veilleux et al. 1995). In this case, the thermal radio emission is enhanced (with respect to FIR emission) by about 10%, but, and more importantly, its dense gas mass will be 40% higher than that derived from the assumed dust/gas ratio. This would push the galaxy on the border of the correlation.
5.6 The star forming efficiency, SFE
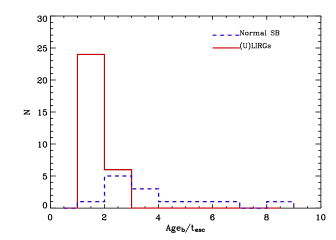
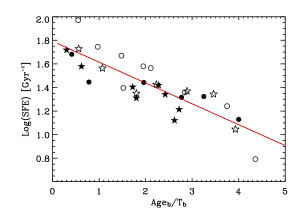
With the ratio between the current star formation rate and the mass of dense gas, we obtain a quantity which measures the reciprocal of the SF time scale and which is usually called star formation efficiency (SFE, Gao et al. 2004a). This ratio is plotted in the different panels of Fig. 10. There is only a weak correlation between the SFE and the IR luminosity of the SB or the mass of dense gas, while an anti-correlation becomes fairly evident (Kendall coefficient, ) when the SFE is plotted against the evolutionary phase of the SB (bottom left panel). The efficiency of the star formation is larger in the early-peak phases of the starburst (E) and then tails off to values characteristic of more normal galaxies (Gao & Solomon 2004) as the starburst reaches the later phases.
| (10) |
Stars in the bottom panels mark objects in common with Gao & Solomon (2004b). The right panel shows that this anti-correlation exists even adopting the gas masses derived by them, although with a larger scatter. This shows that the existence of this anti-correlation is not a spurious result of the method we have used to determine the gas mass. On the contrary, we are confident that our method provides more reliable SFR and gas mass estimates, because it reduces the scatter in spite of increasing the number of objects. We notice also that Gao & Solomon (2004b) claim that the star formation rate per unit mass of dense gas is constant for all galaxies, including ULIRGs, and that the star formation law in terms of dense molecular content is well represented by a power law with exponent 1.0.
Such as rapid decrease of the star formation efficiency as the starburst evolves, strongly suggests that feedback plays a major role in the evolution of these extreme objects. To check whether there are significant differences between pure and mixed ULIRGs, we have plotted the former objects with filled symbols and the latter objects with open symbols. In the lower left panel of Fig. 10 there appears to be a separation between the two classes of ULIRGs, with the efficiency in early mixed objects being on the average 40% larger than in early pure starbursts. Given the small number of objects, this is far from being a definite conclusion. However, if confirmed, it will shed important new light on the AGN-Starburst connection. At present, we cannot say whether a higher efficiency in mixed (U)LIRGs is due to an enhancement of the SFR due to positive AGN feedback, or a lower mass of dense gas, due to negative AGN feedback.
While (=) is a quantity entirely derived from our best fit models it would be desirable to put the above finding on observational grounds, to check its independence from the modelling process. As already mentioned, Vega et al. (2005) found a tight correlation between and the FIR colour . This correlations goes in the sense that as the SB evolves, i.e. increases, the infrared colour gets cooler, i.e. decreases.
Indeed, by using the FIR colour instead of our indicator of the evolutive phase of the starburst, we obtain the correlation shown in Fig. 11. A Kendall test indicates a very strong correlation between the SFE and the IR colours corrected for the AGN contribution, . This correlation remains strong () if the observed IR colors, i.e. without AGN contribution correction, are used.
| (11) |
Instead of SFE we could have used the ratio LIR/LHCN and obtained a correlation analogous to that shown in Figure 9a of Gao & Solomon (2004). Notice, that considering only ULIRGs in this Figure, a definite trend of decreasing efficiency at cooler colour, with slope , is seen. Therefore, this strong correlation between the observed colour and the observed SFE indicates that this variation of the SFE is real. The additional information on the evolutive phase of the starburst and on the AGN contamination, allowed by a realistic modelling procedure, eliminates a large part of the dispersion in the star formation efficiency found by Gao & Solomon (2004).
| NAME | LIR | L | LHCN | ||
|---|---|---|---|---|---|
| (Mpc) | () | () | (K km s-1pc2) | (M⊙/K km s-1pc2) | |
| UGC 8058 | 173.987 | 31.678 | 22.243 | 19.414 | 6.190 |
| IR 12113+0305 | 309.289 | 19.000 | 19.000 | 14.1 | 6.772 |
| IR 05189-2524 | 175.661 | 12.565 | 5.943 | 6.596 | 6.320 |
| UGC 9913 | 73.465 | 13.560 | 13.560 | 8.898 | 6.929 |
| UGC 8696 | 155.376 | 13.537 | 10.204 | 13.57 | 3.780 |
| IR 10565+2448 | 177.947 | 9.889 | 9.889 | 10.754 | 5.229 |
| UGC 5101 | 162.193 | 9.143 | 7.705 | 10.250 | 6.298 |
| Arp 299 | 41.500 | 5.849 | 5.849 | 1.956 | 13.140 |
| UGC 4881 | 161.812 | 4.520 | 4.520 | 3.758 | 6.531 |
| IC 1623 | 81.452 | 4.641 | 4.641 | 8.448 | 3.100 |
| NGC 1614 | 64.489 | 4.019 | 3.507 | 1.301 | 10.133 |
| UGC 8387 | 95.008 | 3.918 | 3.918 | 9.979 | 3.318 |
| NGC 7469 | 66.000 | 3.802 | 3.548 | 2.094 | 8.298 |
| Arp 148 | 141.647 | 3.566 | 3.566 | 3.908 | 5.802 |
| Mrk 331 | 74.931 | 2.663 | 2.419 | 3.317 | 5.120 |
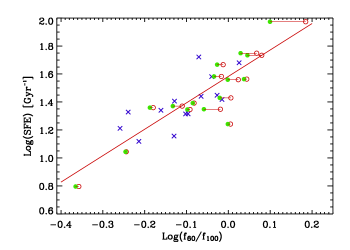
5.7 Implications for the evolution of LIRGs and ULIRGs
All but one of the 30 compact (U)LIRGs we have analyzed are predominantly powered by a starburst, contributing more than 80% of the bolometric light. Sixteen galaxies show evidence for the presence of an AGN, but only nine have an AGN contribution that exceeds 10% of the IR luminosity, although it may be larger at NIR-MIR wavelengths.
Since there is much evidence that IRAS bright galaxies are associated with gas-rich mergers, this could suggest that strong AGN activity is only triggered in certain types of mergers. Our sample is biased toward IRAS bright objects, and the mergers involved should be those in which disruption and/or infall of gas is expected, such as discussed by Sopp, Alexander & Riley (1990). However, modelling of such encounters does not indicate that the dynamical parameters (prograde, retrograde orbit etc) influence the fueling of an active nucleus, at least for Seyfert galaxies (Keel, 1996).
The alternative explanation is that strong AGN activity is common to most such mergers, but lasts for an order of magnitude less time than the starburst. This would correspond to AGN lifetimes of a few million years. The latter figure is in very good agreement with AGN lifetimes derived from the comparison of the ratio between SNIIb/c and SNII rates in normal spirals and in Seyfert II galaxies (Bressan, Della Valle & Marziani 2002).
6 Conclusions
Based on homogenized literature data and on our own radio observations (Prouton et al. 2004, Clemens et al. 2007) we have constructed well-sampled, broad band, NIR to radio spectral energy distributions of 30 luminous and ultra-luminous infrared galaxies, selected from the sample of compact (U)LIRGs of Condon et al. (1991). For one third of the sample, the broad band SED has also been complemented by the published low resolution Spitzer IRS spectrum. The library of SEDs, available in electronic form (see Tables B.2 and B.3), constitutes a real work bench for models aimed at interpreting such powerful and obscured sources. It is tempting to say that the template SEDs may be used for the analysis of huge star forming objects detected at high redshifts, if it were not that one of the strongest warnings emerging from this work is that it is dangerous to simply re-scale observed SEDs to highest luminosities. On the contrary, the aim of the present investigation was to determine physical parameters and environmental conditions that accompany very high star formation rates, that can be used to model high redshift galaxies.
To this end, we have analyzed the observed SEDs with a chemo-spectro-photometric code that includes one of the most advanced and realistic treatments of the complex interaction between star formation, starlight and dust reprocessing (GRASIL). In addition, emission from an AGN, based on the same homogeneous physics, was added in those cases where the pure starburst model failed to fit the data.
Our results can be summarized as follows:
-
•
16/30 sources show evidence for the presence of an AGN. However only in 9/30 sources does the contribution of the AGN to the total infrared luminosity exceed 10%. Only one galaxy, IRAS 08572+3915, seem to be powered by an AGN. We therefore find that the fraction of starburst dominated objects (i.e. pure SB galaxies and mixed galaxies with AGN contributions lower than ) in our sample, is 70%. This value is in good agreement than that found by Farrah et al. (2003).
-
•
In a previous paper we noticed that the results of fitting (U)LIRGs SEDs could be affected by a degeneracy between optical depth of the starburst MCs and the presence of the AGN, since both may affect the MIR emission. By sampling the silicate absorption feature at m, low resolution Spitzer IRS spectra can actually break this degeneracy and provide a more accurate quantification of the AGN/SB parameters.
The largest revision after including the Spitzer IRS spectrum, has been found for IRAS 15250+3609, whose broad band SED could be fitted by a pure starburst, whereas reproducing also the m feature, revealed a dust obscured AGN contributing 20% of the IR luminosity. The classification of the other three pure starbursts remained unchanged. In those cases where the presence of the AGN were already suspected from other diagnostics, the inclusion of Spitzer IRS observations, confirmed this presence and increased the robustness of the derived parameters.
-
•
Our measured AGN fractions are consistent with those reported by Armus et al. (2007) based on the mid-infrared line ratios Ne[V]/Ne[II] and O[IV]/Ne[II]. These lines may thus provide a fairly accurate measure of the AGN contribution to the bolometric luminosity of infrared luminous galaxies. The PAH equivalent widths and mid-infrared spectral slope on the other hand, overestimate (often by large factors) the AGN fraction.
For two galaxies, our findings are markedly different from those of Armus et al., namely IRAS 14348-1447 and IRAS 15250+3609. For the former, we find an AGN contribution to the IR luminosity , while they find no evidence of an AGN from the MIR analysis. Indeed, this AGN contribution is required by its red NIR colour, J-K which can not be explained with stellar populations alone. The power source of IRAS 15250+3609 could not be determined by Armus et al., while our analysis indicates that it is a mixed object with a very obscured AGN, that contributes of the IR luminosity.
-
•
If an active nucleus forms part of a an evolutionary phase of ULIRGs then we expect this phase to be energetically important for an order of magnitude less time than the starburst. From our modelling, this would correspond to a few Myr. However, there is no evidence in our sample that the AGN phenomenon is correlated with a particular phase of the starburst, although all 4 AGNs in the early phase of the SB make a large IR contribution, while only 1 of the 12 associated with the later SB phases, has similar IR power.
-
•
There is evidence that the star formation in objects with an AGN decreases more rapidly than in pure starbursts. In fact, while about 75% of SBs with AGN have t20 Myr, all pure SBs have t20 (and only 3 with tb=20). A possible explanation is that the surrounding star forming regions have suffered from AGN feedback, either positively as a sudden enhancement of the SFR, or negatively by a more rapid decrease of the efficiency.
-
•
Since the MIR-FIR spectral region in our sample (U)LIRGs is dominated by MC emission, we can determine quite accurately the mass in dust associated with the dense star forming regions. We can convert this to the molecular gas mass, using a typical dust/gas ratio. We find a relation between the infrared luminosity and molecular gas mass with the same slope as that derived by Gao & Solomon (2004a) from observations of HCN emission. However, we derive a constant of conversion between HCN flux and mass of dense molecular gas a factor of 2 smaller than that assumed by these authors. Such a low conversion factor for the (U)LIRG population is suggested by Gao & Solomon (2004a) themselves and by other investigations (e.g. Graciá-Carpio et al. 2006).
Notable outliers from this correlation are those few objects with an energetically important AGN. After correcting their IR luminosity for the AGN contribution, they also lie on the correlation. This is an independent check of the robustness of our method. If confirmed by the study of a larger sample of (U)LIRGs this correlation can be used to evaluate the AGN fraction in distant ULIRGs with known IR and HCN luminosities (e.g. such those observed by Gao et al. 2007).
-
•
Using the ratio between the current SFR and the mass of dense molecular gas we obtain an estimate of the reciprocal of the consumption time that we call efficiency of star formation. While there seems not to exist clear correlations between SFE and IR luminosity of the starburst or mass of dense molecular gas, an evident anti-correlation appears when SFE is plotted against the starburst phase. The SFE decreases by about one order of magnitude as the SB evolves from its early phase to the more advanced phases.
This anti-correlation is not due to a circularity in our fitting method, because it is also evident if we adopt the gas masses obtained by Gao & Solomon (2004a), although with a larger dispersion. Indeed, most of the dispersion in the star formation efficiency derived observationally from HCN emission (Gao & Solomon, 2004b), can be attributed to this evident fall in efficiency during the lifetime of a starburst.
Acknowledgements.
O.V. and M.C. acknowledge the the support of the I.N.A.F. research fellowships. O.V. also acknowledges the support of the INAOE and the Mexican CONACYT projects 36547 E and 39714 F. A.B., G.L.G. and L.S. acknowledge the warm hospitality of INAOE and the partial funding by the European Community by means of the Maria Curie contract MRTN-CT- 2004-503929, MAGPOP. We also thank the anonymous referee for a careful and helpful report. This publication makes use of data products from the Two Micron All Sky Survey, which is a joint project of the University of Massachusetts and the Infrared Processing and Analysis Center/California Institute of Technology, funded by the National Aeronautics and Space Administration and the National Science Foundation. This work is also based on data taken with the Spitzer Space Telescope, which is operated by the JPL,Caltech under a contract with NASA.References
- (1) Albrecht, M., Krügel, E., & Chini, R. 2007, A&A, 462, 575
- (2) Alonso-Herrero, A., Rieke, G. H., Rieke, M. J., & Scoville, N. Z., 2000, ApJ, 532, 845
- (3) Alonso-Herrero, A., Quillen, A. C., Simpson, C., Efstathiou, A., & Ward, M. J. 2001, AJ, 121, 1369
- (4) Alonso-Herrero, A., Rieke, G.H., Rieke, M.J., & Scoville, N.Z. 2002, AJ, 124, 166
- (5) Alonso-Herrero, A., Quillen, A. C., Rieke, G. H., Ivanov, V. D., & Efstathiou, A. 2003, AJ, 126, 81
- (6) Anantharamaiah, K.R., Viallefond, F., Mohan, N.R., Goss, W.M., & Zhao, J.H. 2000, ApJ, 537, 613
- (7) Armus, L., Heckman, T. M., & Miley, G. K. 1989, ApJ, 347, 727
- (8) Armus, L., Charmandaris, V., Spoon, H. W. W., et al., 2004 ApJS, 154, 178
- (9) Armus, L., Charmandaris, V., Bernard-Salas, J., et al. 2007, ApJ, 656, 148
- (10) Baan, W. A., Salzer, J. J., & Lewinter, R. D. 1998, ApJ, 509, 633
- (11) Ballo, L., Braito, V., Della Ceca, R., et al. 2004, ApJ, 600, 634
- (12) Benford, D. J. 1999, PhDT, CALIFORNIA INSTITUTE OF TECHNOLOGY, Source DAI-B 60/08
- (13) Boonman, A.M.S., Stark, R., van der Tak, F.F.S., et al. 2001, ApJ, 553, 63
- (14) Braito, V., Della Ceca, R., Piconcelli, E., et al. 2004, A&A, 420, 79
- (15) Brandl, B. R., Bernard-Salas, J., Spoon, H. W. W., et al. 2006, ApJ, 653, 1129
- (16) Bressan, A., Granato, G. L. & Silva, L. 1998, A&A, 332, 135
- (17) Bressan, A., Silva, L., & Granato, G.L. 2002a, A&A, 392, 377
- (18) Bressan, A., Della Valle, M., & Marziani, P. 2002b, MNRAS, 331, 25
- (19) Carico, D. P., Sanders, D. B., Soifer, et al. 1988, AJ, 95, 356
- (20) Carico, D. P., Keene, J., Soifer, B. T., & Neugebauer, G. 1992, PASP, 104, 1086
- (21) Chapman, J. M., Staveley-Smith, L., Axon, D. J., et al. 1990, MNRAS, 244, 281
- (22) Charmandaris, V., Stacey, G. J., & Gull, G. 2002, ApJ, 571, 282
- (23) Charmandaris, V., Laurent, O., Le Floc’h E., et al. 2002, A&A, 391, 429
- (24) Chini, R., Kruegel, E. & Lemke, R. 1996, A&AS, 118, 47
- (25) Clemens, M. S.,& Alexander, P. 2004, MNRAS, 350, 66
- (26) Clemens, M. S., Vega, O., Bressan, A., et al. 2007, A&A in press, arXiv:0708.0149v2
- (27) Colina, L., Arribas, S., & Monreal-Ibero, A. 2005, ApJ, 621, 725
- (28) Condon, J. J., Huang, Z.-P., Yin, Q. F., & Thuan, T. X. 1991a, ApJ, 378, 65
- (29) Condon, J. J., Frayer, D. T., & Broderick, J. J. 1991b, AJ, 101, 362
- (30) Dale, D. A., Silbermann, N. A., Helou, G., et al. 2000, AJ, 120, 583
- (31) Dasyra, K. M., Tacconi, L. J., Davies, R. I., et al. 2006, ApJ, 638, 745
- (32) Davies, R. I., Tacconi, L. J., & Genzel, R. 2004, ApJ, 613, 781
- (33) de Grijp, M. H. K., Miley, G. K., Lub, J., & de Jong, T. 1985, Nature, 314, 240
- (34) Della Ceca, R., Ballo, L., Tavecchio, F., et al. 2002, ApJ, 581, 9
- (35) Denicoló, G., Terlevich, R. J., & Terlevich, E. 2002, MNRAS, 330, 69
- (36) Downes, D., & Solomon, P. M. 1998, ApJ, 507, 615
- (37) Draine, B. T. & Lee, H. M. 1984, ApJ, 285, 89
- (38) Dudley, C. C. 1999, MNRAS, 307, 553
- (39) Dunne, L., Eales, S., Edmunds, M., et al. 2000, MNRAS, 315, 115
- (40) Dunne, L. & Eales, S. A. 2001, MNRAS, 327, 697
- (41) Dwek, E., 1998 ApJ, 501, 643
- (42) Eales, S. A., Becklin, E. E., Hodapp, K.-W., Simons, D. A., & Wynn-Williams, C. G. 1990, ApJ, 365, 478
- (43) Efstathiou, A. & Rowan-Robinson, M. 1995, MNRAS, 273, 649
- (44) Elvis, M., Wilkes, B. J., McDowell, J. C., et al. 1994, ApJS, 95, 1
- (45) Farrah, D., Afonso, J., Efstathiou, A., et al. 2003, MNRAS, 343, 585
- (46) Farrah, D., Bernard-Salas, J., Spoon, H. W. W., et al. 2007, ApJ, 667, 149
- (47) Flores, H., Hammer, F., Elbaz, et al. 2004 A&A, 415, 885
- (48) Franceschini, A., Braito, V., Persic, M., et al. 2003, MNRAS, 343, 1181
- (49) Frayer, D. T., Ivison, R. J., Smail, I., Yun, M. S., & Armus, L. 1999, AJ, 118, 139
- (50) Gallais, P., Charmandaris, V., Le Floc’h, E., et al. 2004, A&A, 414, 845
- (51) Gao, Y., & Solomon, P. M. 2004a, ApJ, 606, 271
- (52) Gao, Y., & Solomon, P. M. 2004b, ApJS, 152, 63
- (53) Gao, Y., Carilli, C. L., Solomon, P. M., & Vanden Bout, P. A. 2007, ApJ, 660, 93
- (54) Gallagher, S. C., Brandt, W. N., Chartas, G., Garmire, G. P., & Sambruna, R. M. 2002, ApJ, 569, 655
- (55) Genzel, R., Lutz, D., Sturm, E., et al. 1998, ApJ, 498, 579
- (56) Genzel, R., Tacconi, L. J., Rigopoulou, D., Lutz, D., & Tecza, M. 2001, ApJ, 563, 527
- (57) Goldader, J.D., Joseph, R.D., Doyon, R., & Sanders, D.B. 1995, ApJ, 444, 97
- (58) Goldader, J. D., Joseph, R. D., Doyon, R., & Sanders, D. B. 1997, ApJ, 474, 104
- (59) Graciá-Carpio, J., García-Burillo, S., Planesas, P., & Colina, L. 2006, ApJ, 640, 135
- (60) Granato, G.L. & Danese, L. 1994, MNRAS, 268, 235
- (61) Granato, G. L., Danese, L., & Franceschini, A. 1997, ApJ, 486, 147
- (62) Granato, G.L., Lacey, C.G., Silva, L., et al. 2000, ApJ, 542, 710
- (63) Greve,T.R, Papadopoulos, P.P., Gao, Y., & Radford, S.J.E. 2006, astro-ph/0610378
- (64) Hattori T., Yoshida, M., Ohtani, H., et al. 2004, AJ, 127, 736
- (65) Hwang, Chorng-Yuan, Lo, K. Y., Gao, Y., & Gruendl, R. A., & Lu N. Y. 1999, ApJ, 511, 17
- (66) Imanishi, M., & Dudley, C. C. 2000, ApJ, 545, 701
- (67) Imanishi, M., Dudley, C. C., & Maloney, P. R. 2001, ApJ, 558, L93
- (68) Imanishi, M., & Maloney, P. R. 2003, ApJ, 588, 165
- (69) Imanishi, M., Dudley, C. C., & Maloney, P. R. 2006, ApJ, 637, 114
- (70) Imanishi, M., Dudley, C. C., Maiolino, et al. 2007, ApJS, 171, 72
- (71) Joyce, R. R., Knacke, R. F., Simon, M., & Young, E. 1975, PASP, 87, 683
- (72) Joyce, R. R. & Simon, M. 1976, PASP, 88, 870
- (73) Keel, W.C. 1996, AJ, 111, 696
- (74) Kennicutt, R. C. 1998, ARA&A, 36, 189
- (75) Klaas, U., Haas, M., Müller, S. A. H., et al. 2001, A&A, 379, 823
- (76) Kotilainen, J. K., Reunanen, J., Laine, S., & Ryder, S. D. 2001, A&A, 366, 439
- (77) Krolik, J. H. 1999, Active galactic nuclei : from the centralblack hole to the galactic environment (Active galactic nuclei : from the central black hole to the galactic environment /Julian H. Krolik. Princeton, N. J. : Princeton University Press, c1999.)
- (78) Lahuis, F., Spoon, H. W. W., Tielens, A. G. G. M., et al. 2007, ApJ, 659, 296
- (79) Lancon, A., Rocca-Volmerange, B., & Thuan, T. X. 1996, A&AS, 115, 253
- (80) Laurent, O., Mirabel, I. F., Charmandaris, V., et al. 2000, A&A, 359, 887
- (81) Lebofsky, M. J. & Rieke, G. H. 1979, ApJ, 229, 111
- (82) Le Floc’h, E., Charmandaris, V., Laurent, O., et al. 2002, A&A, 391, 417
- (83) Lonsdale, C. J., Smith, H. J., & Lonsdale, C. J. 1993, ApJ, 405, 9
- (84) Lonsdale, C. J., Lonsdale, C. J., Smith, H. E., & Diamond, P. J. 2003, ApJ, 592, 804
- (85) Lonsdale, C. J., Diamond, P. J., Thrall, H., Smith, H. E., & Lonsdale, C. J. 2006, ApJ, 647, 185
- (86) Lutz, D., Genzel, R., Kunze, D., et al. 1999, Ap&SS, 266, 85
- (87) Maiolino, R. & Rieke, G. H. 1995, ApJ, 454, 95
- (88) Maiolino, R., Marconi, A., & Oliva, E. 2001a, A&A, 365, 37
- (89) Maiolino, R., Marconi, A., Salvati, M., et al. 2001b, A&A, 365, 28
- (90) Maiolino, R., Comastri, A., Gilli, R., et al. 2003, MNRAS, 344, L59
- (91) Maloney, P. R., & Reynolds, C. S. 2000, ApJ, 545, L23
- (92) Mathis, J. S., Rumpl, W., & Nordsieck, K. H. 1977, ApJ, 217, 425
- (93) Miles, J. W., Houck, J. R., & Hayward, T. L. 1994, ApJ, 425, 37
- (94) Miles, J. W., Houck, J. R., Hayward, T. L., & Ashby, M. L. N. 1996, ApJ, 465, 191
- (95) Mirabel, I. F. & Sanders, D. B. 1988, ApJ, 335, 104
- (96) Mizutani, K., Suto, H., & Maihara, T. 1994, ApJ, 421, 475
- (97) Montgomery, A.S., & Cohen, R.J. 1992, MNRAS, 254, P23
- (98) Mouri, H., Taniguchi, Y., Sato, Y., & Kawara, K. 1998, A&A, 334, 482
- (99) Mulchaey, J., Wilson, A. S., & Tsvetanov, Z. 1996, ApJS, 102, 309
- (100) Murphy, T. W. Jr., Soifer, B. T., Matthews, K., Armus, L., & Kiger, J. R. 2001, AJ, 121, 97
- (101) Nagar, N.M., Wilson, A.S., Falcke, H., Veilleux, S., & Maiolino, R. 2003 A&A, 409, 115
- (102) Neff, S. G., Ulvestad, J. S., & Teng, S. H. 2004, ApJ, 611, 186
- (103) Neff, S. G., Hutchings, J. B., Standord, S. A., & Unger, S. W. 1990, AJ, 99, 1088
- (104) Nenkova, M., Ivezić, Ž., & Elitzur, M. 2002, ApJ, 570, L9
- (105) Nikolic, B., Alexander, P., Cotter, G., Longair, M., & Clemens, M. 2003, Ap&SS, 284, 573
- (106) Panuzzo, P., Bressan, A., Granato, G.L., Silva, L., & Danese, L. 2003, A&A, 409, 99
- (107) Papadopoulos, P. P. & Allen, M. L. 2000, ApJ, 537, 631
- (108) Pérez García, A. M. & Rodríguez Espinosa, J. M. 2001, ApJ, 557, 39
- (109) Pier, E. A. & Krolik, J. H. 1993, ApJ, 418, 673
- (110) Pihlström, Y. M., Conway, J. E., Booth, R. S., Diamond, P. J., & Polatidis, A. G. 2001, A&A, 377, 413
- (111) Poggianti, B. M. & Wu, H. 2000, ApJ, 529, 157
- (112) Poggianti, B. M., Bressan, A., & Franceschini, A. 2001, ApJ, 550, 195
- (113) Portinari, L., Chiosi, C., & Bressan, A. 1998, A&A, 334, 505
- (114) Prouton, O.R., Bressan, A., Clemens, M., et al. 2004, A&A, 421, 115
- (115) Ptak, A., Heckman, T., Levenson, N. A., Weaver, K., & Strickland, D. 2003, ApJ, 592, 782
- (116) Rieke, G. H. & Low, F. J. 1972, ApJ, 176, 95
- (117) Rieke, G. H. 1976, ApJ, 210, 5
- (118) Rieke, G. H. 1978, ApJ, 226, 550
- (119) Rigopoulou, D., Lawrence, A., & Rowan-Robinson, M. 1996, MNRAS, 278, 1049
- (120) Risaliti, G., Gilli, R., Maiolino, R., & Salvati, M. 2000, A&A, 357, 13
- (121) Risaliti, G., Maiolino, R., Marconi, A., et al. 2006, MNRAS, 365, 303
- (122) Roche, P. F., Aitken, D. K., Smit,h C. H., & Ward, M. J. 1991, MNRAS, 248, 606
- (123) Roche, P. F. & Chandler, C. J. 1993, MNRAS, 265, 486
- (124) Rupke, D. S. N., Veilleux, S., & Baker, A. J. 2007, arXiv:0708.1766v1
- (125) Sanders, D. B., Soifer, B. T., Elias, J. H., Neugebauer G., & Matthews, K. 1988, ApJ, 328L, 35
- (126) Sanders, D. B.,& Mirabel, I. F. 1996, ARA&A, 34, 749
- (127) Satyapal, S., Watson, D. M., Pipher, J. L., et al. 1999, ApJ, 516, 704
- (128) Severgnini, P., Risaliti, G., Marconi, A., Maiolino, R., & Salvati, M. 2001, A&A, 368, 44
- (129) Shier, L. M., Rieke, M. J., & Rieke, G. H. 1996, ApJ, 470, 222
- (130) Silva, L., Granato, G. L., Bressan, A., & Danese, L. 1998 ApJ, 509, 103
- (131) Silva, L. 1999, PhD thesis, SISSA
- (132) Smith, D. A., Herter, T., Haynes, M. P., Beichman, C. A., & Gautier, T. N., III 1995, ApJ, 439, 623
- (133) Smith, H.E., Lonsdale, C.J., Lonsdale, C.J., & Diamond, P.J. 1998, ApJ, 493, L17
- (134) Smith, H.E., Lonsdale, C.J., & Lonsdale, C.J. 1998, ApJ, 492, 137
- (135) Solomon, P. M., Downes, D., Radford, S. J. E., & Barrett, J. W. 1997, ApJ, 478, 144
- (136) Soifer, B. T., Neugebauer, G., Matthews, K., et al. 2000, AJ, 119, 509
- (137) Soifer, B. T., Neugebauer, G., Matthews, K., et al. 2001, AJ, 122, 1213
- (138) Soifer, B.T., Neugebauer, G., Matthews, K., Egami, E., & Weinberger, A.J. 2002, AJ, 124, 2980
- (139) Soifer, B. T., Bock, J. J., Marsh, K., et al. 2003, AJ, 126, 143
- (140) Sopp, H., Alexander, P., & Riley, J. 1990, MNRAS, 246, 143
- (141) Spinoglio, L., Benedettini, M., de Troia, G., et al. 2000, ESASP, 456, 261
- (142) Spoon, H. W. W., Keane, J. V., Tielens, A. G. G. M., et al. 2002, A&A, 385, 1022
- (143) Stickel, M., Lemke, D., Klaas, U., Krause, O., & Egner, S. 2004, A&A, 422, 39
- (144) Surace, J. A. & Sanders, D. B. 2000, AJ, 120, 604
- (145) Surace, J. A., Sanders, D. B., & Evans, A. S. 2000, ApJ, 529, 70
- (146) Schweitzer, M., Lutz, D., Sturm, E., et al. 2006, ApJ, 649, 79
- (147) Takagi, T., Arimoto, N., & Hanami, H. 2003, MNRAS, 340, 813
- (148) Takeuchi, T. T., Buat, V., Iglesias-Páramo, J., Boselli, A., & Burgarella, D. 2005, A&A, 432, 423
- (149) Taylor, G. B., Silver, C. S., Ulvestad, J. S., & Carilli, C. L. 1999, ApJ, 519, 185
- (150) Vacca, W. D., & Conti, P. S. 1992, ApJ, 401, 543
- (151) Valdés, J.R., Berta, S., Bressan, A., et al. 2005, A&A, 434, 149
- (152) Vega, O., Silva, L., Panuzzo, P., et al. 2005, MNRAS, 364, 1286
- (153) Veilleux, S., Kim, D. C., Sanders, D. B., Mazzarella, J. M., & Soifer, B. T. 1995, ApJS, 98, 171
- (154) Veilleux, S., Sanders, D. B., & Kim, D. C. 1999, ApJ, 522, 139
- (155) Veron-Cetty, M. P. & Veron, P. 1991, ESO, Sci. Rep., 10
- (156) Wang, J., Heckman, T. M., Weaver, K. A., & Armus, L. 1997, ApJ, 474, 659
- (157) Weedman, D. W., Hao, L., Higdon, S. J. U., et al. 2005, ApJ, 633, 706
- (158) Wu, H., Zou, Z. L., Xia, X. Y., & Deng, Z. G. 1998, A&AS 132 181
- (159) Zezas, A., Ward, M. J., & Murray, S. S. 2003, ApJ, 594, L31
Appendix A Individual objects
Below we compare our results with the relevant literature concerning the power sources for each of our sample objects. The AGN contributions described refer to the wavelength range .
UGC 08058 (Mrk 231)
The identification of this source as the nearest broad absorption
line quasar is supported by a wide range of observational data.
Compact radio emission from its nucleus (Lonsdale et al. 2003), its
X-ray luminosity (Maloney & Reynolds 2000), short term variability
at X-ray wavelengths (Gallagher et al. 2002) and low PAH feature equivalent width (Imanishi & Dudley 2000) all point
to the presence of an AGN.
However, a central starburst is also probably present and accounts for a significant fraction of the soft X-ray luminosity (Braito et al. 2004). Davies, Tacconi & Genzel (2004) estimate that star-formation in the nuclear disk accounts for 25-40% of the bolometric luminosity. Taylor et al. (1999) use high- resolution multi-wavelength radio observations to deduce that the central starburst component forms stars at a rate of .
Condon, Frayer & Broderick (1991) classify the source as AGN-dominated based on the radio morphology and infrared-radio flux ratio, as do Lutz et al. (1999) using mid-infrared spectroscopy. Farrah et al. (2003) require a 30% contribution from an AGN for their SED fit. An AGN fraction of is found by Armus et al. (2007) using the line ratios Ne[V]/Ne[II] and O[IV]/Ne[II], whereas values of close to 100% are obtained from the PAH equivalent widths or the mid-infrared spectral slope.
Our best fit to the SED plus the IRS spectrum requires an active nucleus accounting for 16% of the infrared luminosity. Notice however, that our fit is based on the assumption that the lower radio fluxes are due to the SB.
IRAS 14348-1447
The source lies at a position in the mid-infrared diagnostic diagram
of Genzel et al. (1998) that suggests an AGN contribution , and both Lutz et al. (1999) and Charmandaris et al. (2002)
classify this source as starburst dominated, based on mid-infrared
ISO data.
Risaliti et al. (2006) find a high equivalent width for the PAH feature and flat near-infrared continuum in both nuclei, suggesting a starburst origin, although Imanishi, Dudley & Maloney (2006) find weak evidence for the presence of and AGN in the NE nucleus using similar data. Franceschini et al. (2003) find no evidence for the presence of an AGN at hard X-ray wavelengths.
Takagi, Arimoto & Hanami (2003), model the uv to far-infrared SED with a starburst model with current star formation rate of but do not consider an AGN component.
Farrah et al. (2003) find that this source has an AGN accounting for 17% of the IR luminosity. Armus et al. (2007) estimate the AGN fraction using Spitzer data to be between ( line ratio) and 65% (mid-IR slope). Imanishi et al. (2007) do not find AGN signatures in the Spitzer spectrum but find strong evidence of the AGN in the 3-4 m spectral range.
Our models do not fit the SED unless an AGN component accounting for of the IR luminosity is included.
IRAS 12112+0305
Colina et al. (2000) find that the star formation as traced by
H emission is dominated by that in the two nuclei. Risaliti
et al. (2006) and Imanishi, Dudley & Maloney (2006) find a high
equivalent width for the PAH feature, no absorption and a flat near-infrared spectrum in both nuclei,
giving no evidence for the presence of an AGN. Hard X-ray data
support this conclusion (Franceschini et al. 2003). Veilleux,
Sanders & Kim (1999) also find no spectroscopic evidence for a BLR
at near-infrared wavelengths. In the diagnostic diagram of Genzel et
al. (1998) based on the strength of the PAH feature
and the ratio of high and low excitation mid-infrared emission lines
the object lies at a position implying an AGN contribution of . Lutz et al. (1999) classify the IR spectrum as a starburst.
Armus et al. (2007) find that the AGN fraction estimated from the line ratio is whereas if the SED is fitted from the estimate is 65%.
We find a good fit to the SED without the need for an AGN component, consistent with the SED fits of Farrah et al. (2003).
Takagi, Arimoto & Hanami (2003), model the uv-far-infrared SED as a starburst and find a current star formation rate of which is about half that of our model, but their Salpeter IMF is truncated at rather than .
IRAS 05189-2524
Imanishi & Dudley (2000) find that the small equivalent width of
the PAH feature shows that of the flux comes from an AGN. They conclude that the
bolometric luminosity output is dominated by an AGN power source.
The mid-infrared imaging of Soifer et al. (2000) leads them to a
similar conclusion. Dudley (1999), on the other hand, finds that the
spectrum is indicative of a starburst by the
presence of the PAH feature. He argues that the
discrepancy between the mid-IR classification and the optical
classification as an AGN can be reconciled if the AGN is responsible
for the near-IR emission but contributes little at mid- and
far-infrared wavelengths. The X-ray and near-infrared spectroscopy
of Severgnini et al. (2001) lead to the conclusion that the AGN
accounts for of the IR luminosity.
Armus et al. (2007) have used Spitzer IRS spectra to classify the source based on various mid-IR line ratios and the mid-IR continuum slope, and find AGN fractions from 33 to 95%.
We fit the SED plus the IRS spectrum with the inclusion of an AGN component that accounts for 17% of the infrared luminosity. This is lower than the AGN fraction of 1/3 found by Farrah et al. (2003).
UGC 9913 (Arp 220, IRAS 15327+2340)
Smith et al. (1998) resolved the compact radio emission into
separate supernova remnants and subsequent, high sensitivity VLBI
monitoring of both nuclei has now succeeded in obtaining a direct
estimate of the supernova rate (Lonsdale et al. 2006) of . The implied star formation rate is sufficient to
supply the bolometric luminosity of the system.
Shier, Rieke & Rieke (1996) concluded that a large fraction of the luminosity must come from an AGN unless the IMF for recent star formation is very biased towards high mass stars. They note, however, that very high extinction may be confusing such conclusions.
Condon, Frayer & Broderick (1991) classify the source as starburst-dominated from the radio morphology, infrared spectral index and infrared-radio flux ratio, and Soifer et al. (2002) classify both the eastern and western nuclei as starburst dominated based on the strength of the PAH feature. The position in the mid-infrared diagnostic diagram of Genzel et al. (1998) implies at most a negligible contribution from an AGN. Lutz et al. (1999) also classify the source as a starburst using mid-infrared spectroscopy.
Risaliti et al. (2000) find no X-ray evidence for the presence of an AGN.
Takagi, Arimoto & Hanami (2003), model the uv to far-infrared SED with a starburst model with current star formation rate of , and Farrah et al. (2003) find that less than 1% of the IR-luminosity of this source comes from an AGN.
Armus et al.(2007) use Spitzer IRS data to estimate AGN fractions from . Imanishi et al. (2007), by using different MIR diagnostics, conclude that an AGN is possibly powering the MIR spectrum of this galaxy. However, we find a good fit to the SED plus IRS spectrum without the inclusion of an AGN.
IRAS 08572+3915
This source consists of two nuclei separated by 5 ″. It is the
north-west component which dominates in both the infrared and radio
(Sanders et al. 1988; Condon et al. 1991). Surace & Sanders (2000)
found evidence for stars no older than Myr and despite the
warm IRAS colour, Veilleux et al. (1999) found no clear evidence for
the presence of an AGN from NIR spectroscopy. Farrah et al. (2003)
find an AGN contribution of 34% to the IR luminosity. The
inclusion of radio data allows us to provide a more accurate
quantification of the starburst parameters. Our derived age is Myr versus Farrah et al. s upper limit of 57 Myr. Imanishi et al.
(2007) find strong evidence of AGN in the high resolution
Spitzer spectrum, and conclude that this galaxy is AGN
dominated. Prouton et al. (2004) fail to obtain a fit to the NIR to
radio SED with a starburst model alone. They need a contribution of
between 37 to 47 % (for the cases of low and high dust optical
depth respectively, i.e. and ) in order to
fit the SED. The inclusion of the Spitzer spectrum in the
fit, allows us to provide a more precise determination of the MC
optical depth, and therefore, of the AGN contribution. Our SED plus
IRS spectrum fit required the highest AGN contribution of our sample
of 47%, with a . Notice however, that our fit to the
MIR spectral range is the poorest of our sample of (U)LIRGs, and
seems to require a higher AGN contribution (see the discussion in
Sect. 5.4).
UGC 8696 (Mrk 273)
The mid-infrared spectrum of Dudley (1999) suggests the presence of
an AGN that dominates the far-infrared luminosity, and Lutz et al.
(1999) also classify this source as AGN-dominated based on ISO data.
However, the sub-arcsecond imaging of Eales et al.
(1990) shows that the central source is resolved. Imanishi & Dudley
(2000) find that of the flux originates
from an AGN. Indeed, in the mid-infrared diagnostic diagram of
Genzel et al. (1998) this source lies at a position implying an AGN
contribution of . Soifer et al. (2002), in fact, find
that the the NE nucleus is starburst dominated whereas the SW
nucleus ( away) is AGN dominated using mid-IR
spectroscopy.
Condon, Frayer & Broderick (1991) classify the source as starburst-dominated from the radio morphology and infrared-radio flux ratio. Risaliti et al. (2000) find that there is no evidence for the presence of an AGN in hard X-rays despite it’s optical classification as a Seyfert 2.
Farrah et al. (2003) find a 11% AGN contribution to the IR-luminosity whereas Armus et al. (2007) find contributions of between 17 and 33% based on the Ne[V]/Ne[II] and O[IV]/Ne[II] line ratios respectively (from the PAH equivalent width or mid-IR spectral slope they find ). Our fit to the SED plus the IRS spectrum includes an AGN component that contributes 11% of the far-infrared luminosity.
Takagi, Arimoto & Hanami (2003), model the uv to far-infrared SED with a starburst model with current star formation rate of , higher than our value of .
IRAS 15250+3609
Lutz et al. (1999) use mid-infrared spectroscopy to classify the
source as starburst powered and Takagi, Arimoto & Hanami (2003),
model the uv to far-infrared SED with a starburst model with current
star formation rate of . Imanishi et
al. (2006) do not find any evidence of an AGN in the range despite strong absorption features seen at mid-infrared
wavelengths (Spoon et al. 2002). Klaas et al. (2001) classify the
infrared to millimetre spectrum as the result of starburst activity.
Armus et al. (2007) were not able to clarify the power mechanism of
this galaxy from their analysis of the IRS spectrum.
We fit the SED plus the IRS spectrum, with an AGN component of about 20%. This is inconsistent with Farrah et al. (2003) who find that the source requires an AGN supplying 60% of the IR luminosity.
IRAS 10565+2448
Dudley (1999) detects strong PAH features in the mid-infrared
spectrum which is consistent with the optical classification of the
spectrum as HII and Goldader et al. (1995) detect a strong
Br line. Downes & Solomon (1998) find a compact nuclear
ring of molecular gas containing an estimated of molecular ISM.
Farrah et al. (2003) require an AGN component accounting for 5% of the infrared luminosity for an acceptable SED fit. We find a good fit to the SED and the IRS spectrum without any AGN component at all.
UGC 5101
A radio source lies to the north-east.
IRAS fluxes reduced by 8%.
Much observational evidence exists for the existence of an AGN in this source. Imanishi & Maloney (2003) and Ptak et al. (2003) detect the 6.4 keV FeK line, Armus et al. (2004) detect the [NeV]14.3 m line suggesting the presence of a buried AGN and Lonsdale et al. (2003) find a very compact radio source they interpret as having an AGN origin. Imanishi & Maloney (2003) and Imanishi, Dudley & Maloney (2001) show that the absorption features at at and are inconsistent with well-mixed geometry for luminosity sources and absorbers such as that expected in a starburst, and favour an energetically dominant AGN luminosity source.
Condon, Frayer & Broderick (1991) classify the source as starburst-dominated from the radio morphology, infrared spectral index and infrared-radio flux ratio. In the mid-infrared diagnostic diagram of Genzel et al. (1998) this source lies at a position implying an AGN contribution of .
Armus et al. (2007) find that the AGN fraction as estimated from the line ratios and is whereas if the equivalent width of PAH features or the mid-IR slope are used estimates of result.
Farrah et al. find a 7% AGN contribution is necessary for a good fit to the optical/far-infrared SED. Our models show that an AGN contribution of only 1 % produces the best fit to the SED.
IZw 107 (Mrk 848)
Dudley (1999) classify the source as starburst dominated based on
the large equivalent width of the PAH feature.
Although we fit this source with a pure starburst model, the fit at radio frequencies is very poor. The data suggest a very steep radio spectral index at 8 GHz of -1.4 that is steeper than that of our assumed synchrotron component of -0.8.
IRAS 01364-1042
The low value of the 25 m IRAS flux required the highest value
of the dust optical depth of our sample (). The
best fit to the SED also required an AGN contribution of 11%.
Notice, however, that the SED is poorly sampled, with only 13
data-points, while the number of free parameters is 14. The Prouton
et al. (2004) analysis required an even higher optical depth of 181,
but a lower AGN contribution of 4%.
IRAS 10173+0828
Baan, Salzer & LeWinter (1998) fail to classify this mega-maser
galaxy due to the non-detection of any strong optical emission
lines. The sub-arcsecond 15 and 22 GHz observations of Smith,
Lonsdale & Lonsdale (1998) show an unresolved nuclear source. We
fit the SED without the need for an AGN component.
Arp 299
Actually a close interacting pair consisting of NGC 3690 and IC 694.
The imaging of Charmandaris, Stacey & Gull (2002)
shows that IC 694 emits twice as much energy as NGC 3690. However,
at both galaxies emit similar fluxes (Gallais et al.
2004).
Soifer et al. (2001) show that the flux measured by IRAS originates entirely from 5 compact emission regions. These regions are also detected at radio wavelengths (Neff et al. 2004). Although Risaliti et al. (2000) find no evidence for the presence of an AGN at hard X-ray wavelengths the later detection of the FeV line in IC 694 and of Fe-K in NGC 3690 (Ballo et al. 2004) and of hard X-ray continuum emission from both (Zezas et al. 2003, Della Ceca et al. 2002) gives evidence for the presence of AGN. However, Neff et al. (2004) point out that the size and radio flux of source A (nucleus of IC 694) are similar to that seen in Arp 220, which has been resolved into individual sources. It seems likely that there is indeed an AGN in each nucleus but that only one (source B1, nucleus of NGC 3690) may be energetically important. The mid-infrared results of Gallais et al. (2004) show strong PAH lines in all positions and they derive visual extinctions of 40 mag towards source A and 60 mag towards source B1. They conclude that only source B1 is likely to be an AGN based on the strong hot dust continuum at this location.
At near-infrared wavelengths there is no evidence that any of the compact sources are an AGN (Alonso-Herrero et al. 2000; Satyapal et al. 1999).
This system illustrates particularly well how an infrared luminous object, known to contain an AGN, nonetheless has its far-infrared emission dominated by the energetic output of a starburst. In this merger, the nucleus which harbours the AGN becomes progressively less luminous towards far-infrared wavelengths, where most energy is emitted. The starburst nucleus dominates at far-infrared wavelengths.
We find a good fit to the SED of the pair with a pure SB model.
UGC 4881 (Arp 055)
Smith, Lonsdale & Lonsdale (1998) find that the radio emission can
be explained with a starburst model. Our model fit to the SED needs
no AGN component.
CGCG 436-30
This galaxy is almost certainly interacting and is detected in HI in
both emission and absorption; the deduced atomic gas mass is greater
than M⊙ and must be concentrated near the
core in order to explain the absorption feature (Mirabel & Sanders
1988). There is evidence of a compact radio core that may be
difficult to explain as an ensemble of young supernovae associated
with the starburst; the major contribution to the FIR and radio
emission originates on larger spatial scales (Lonsdale et al. 1993;
Smith et al. 1998).
Our SED plus IRS spectrum fit confirms the value for the MC optical depth of found by Prouton et al. (2004), and requires an AGN contribution of 5%.
IC 1623 (VV 114, Arp 236)
The mid-infrared emission is dominated by the eastern member of this
interacting pair and Soifer et al. (2002) classify this source as a
starburst, based on the strength of the PAH
feature. Laurent et al. (2000) however, also using mid-infrared
data, classify the nucleus as an AGN. Le Floc’h et al. (2002) note
that only 40% of the mid-infrared emission originates from the
compact nucleus of the eastern component with the remainder of the
emission being extended. The fact that both the radio emission
(Condon et al. 1991) and the molecular gas emission are also
extended seems to indicate that the source is starburst dominated.
Frayer et al. (1999) find the cool dust emission follows the
molecular gas distribution and argue that it will evolve into a
compact starburst. We fit the SED of this source with a pure SB
model.
NGC 1614
Soifer et al. (2001) find that 87% of the flux
originates within the (1.2 kpc) diameter nuclear
region. Neff et al. (1990) find no evidence for an AGN from the
optical to the radio but argue that it will develop an AGN in the
future. Risaliti et al. (2000) find evidence for the presence of an
AGN from hard X-ray data.
Alonso-Herrero et al. (2001) explain the near-infrared line fluxes using a starburst model with 2
short duration bursts separated by 5 Myr. Shier, Rieke & Rieke (1996) fit near-infrared data with
a starburst model with an age of 12 Myr. Young ages are consistent with the detection of
Wolf-Rayet features in the spectrum (Armus et al. 1989, Vacca &
Conti 1992).
Our fit to the SED includes an AGN contribution. The modelled, current star formation rate of is similar to the value of found by Kotilainen et al. (2001) by using observations and near-infrared photometry, if a continuous star formation is assumed.
UGC 8387 (Arp 193, IC 883)
Downes & Solomon (1998) find a compact nuclear ring or disk of
molecular gas and identify the CO peak as an ‘extreme starburst
region’. Clemens & Alexander (2004) find that free-free absorption
flattens the radio spectral index towards the centre of the
molecular gas distribution showing there to be a large region of
dense ionized gas. The strong Br line and CO index (Smith et
al. 1995), strong PAH emission (Dudley, 1999) and
extended emission (Soifer et al. 2001) are further
evidence that intense star formation powers the source.
Condon, Frayer & Broderick (1991) classify the source as starburst-dominated from the radio morphology, infrared spectral index and infrared-radio flux ratio.
We find a good fit to SED and the IRS spectrum with a pure starburst model at all frequencies with the exception of the high frequency radio data.
NGC 7469
This source is thought to have a Sy 1.2 nucleus and a circumnuclear
starburst. Using high resolution MIR observations, Soifer et al.
(2003) argued that the central source is an AGN rather than a
nuclear starburst because of its very high 12 m surface
brightness. Miles et al. (1994) and Nikolic et al. (2003) both found
that PAH features in the MIR spectrum, thought to trace star
formation, are found in the ring of emission surrounding the nucleus
but not in the nucleus itself. If the hard ionizing photons from the
AGN destroy PAH molecules this supports the picture of a central AGN
surrounded by a starburst ring.
The best fit model derived by Prouton et al. (2004) required an AGN contribution and a MC optical depth between 20 to 45. Our best fit, to a better sampled SED, requires an AGN contribution of and a MC optical depth of 33, in agreement with the Prouton et al. results.
UGC 2369
Smith, Lonsdale & Lonsdale (1998) argue for the presence of an AGN
based on 18 cm VLBI radio continuum observations. We model the SED
of the source without the need for an AGN component.
IIIZw 35
Pihlström et al. (2001) map both the 18 cm radio continuum and
OH maser emission at VLBI resolution and find that the radio
continuum can be explained as a combination of supernova remnants
and very luminous radio supernovae. Earlier radio work at resolution concluded that he source was instead an
AGN (Chapman et al. 1990). A compact (100 pc) molecular disk in the
nucleus is responsible for the dynamical properties of the maser
emission (Montgomery & Cohen, 1992). The optical spectrum has been
classified as liner by Baan et al. (1998). We model the source
without the need for an AGN component.
IC 5298
Wu et al. (1998) found that IC 5298 has properties that are
intermediate between HII regions and liners; it was classified as a
Seyfert 2 by Veilleux et al. (1995) although the lines are
rather weak. Poggianti & Wu (2000) classify this galaxy as e(a)
type, namely with H in emission with moderate equivalent
with ( ) and H in absorption (
). The best fit to the SED obtained by Prouton et al. (2004)
required and AGN contribution of 36 % and a very high optical depth
for the molecular clouds, . However, a reasonable good
fit was also obtained without the inclusion of an AGN and with a
much lower optical depth ().
Our best fit model to a better sampled SED is with a pure SB model and with an optical depth of 33.
Arp 148 (A 1101+41)
Mouri et al. (1998) demonstrate the presence of a dust enshrouded
starburst from the detection of strong PAH features in the ISO spectrum.
We find a good fit to the infrared-radio SED with a pure starburst model.
NGC 2623
Soifer et al. (2001) find 80% of the flux
originates within the (1.5 kpc) diameter nuclear
region. The sub-arcsecond imaging of Eales et al.
(1990) shows that the central source is extended but nonetheless
contains an unresolved core less than 0.3 kpc in diameter. Risaliti
et al. (2000) find no X-ray evidence for the presence of an AGN
whereas later work by Maiolino et al. (2003) argue for the presence
of a heavily obscured AGN based on Chandra X-ray data. Shier, Rieke
& Rieke (1996) argue for the presence of both a starburst and an
AGN as long as a large fraction of the flux can come
from the AGN. Condon, Frayer & Broderick (1991) assign a starburst
classification based on the radio morphology, infrared spectral
index and infrared-radio flux ratio.
We fit the SED plus the IRS spectrum with an AGN component accounting for just of the infrared luminosity.
Mrk 331
Observational data show evidence of both starburst (e.g., Lancon et
al. 1996; Veilleux et al. 1995; Roche et al. 1991) and AGN (Lonsdale
et al. 1993) activity.
Prouton et al. (2004) found an upper limit to the contribution of the AGN of about 23 %. Their average SFR was between 72 and 84 for the case with and without an AGN respectively.
Our best fit to a better sampled SED requires an AGN contribution of 5% and a MC optical depth of 54.
NGC 0034 (Mrk 938)
The presence of two nuclei separated by approximately 1.2″in
the mid-infrared (Miles et al. 1996) and optical tidal tails
indicate this galaxy is undergoing a merger (e.g. Mulchaey et al.
1996). The nature of the activity has been controversial, some
authors (e.g., Véron-Cetty & Véron 1991) claiming a Seyfert 2
nucleus, while others suggest a composite spectrum. Mulchaey et al.
(1996) emission-line images show the galaxy to be a weak emitter of
[OIII] when compared with Seyfert galaxies in their
sample. In addition they argue its strong H emission,
distributed over the entire galaxy, as indicative of a starburst.
Prouton et al. (2004) find that a fit with no AGN component is marginally consistent with the radio data, but also that a large (40%) AGN contribution results in a good fit if a model with larger MC optical depth is used (i.e. ).
Our best fit to the SED required an AGN component of 4% and a MC optical depth of .
NGC 5256 (Mrk 266)
Both Wang et al. (1997) and Condon, Frayer & Broderick (1991)
classify the source as having both starburst and AGN components.
Mizutani, Hiroshi & Toshinori (1994) detect the
PAH feature despite the source’s optical classification as a Sy2.
Our model fit to the SED is excellent from the near-infrared to the radio with an AGN component contributing about 5% to the IR luminosity.
UGC 6436 (IC 2810)
The NVSS shows that a companion galaxy, IC 2810b, located to the south-east has a flux of compared
to the of UGC 6436. This would be confused at IRAS
resolutions and so the IRAS fluxes have been reduced by 26%. No
other observations were at so low a resolution as to make
contamination from this source a problem. Hattori et al. (2004) find
both extended and nuclear H emission.
Our purely starburst fit to the SED is the oldest of our whole sample with age.
NGC 6286
Condon, Frayer & Broderick (1991) assign a starburst classification
based on the radio morphology and infrared-radio flux ratio.
An AGN component accounting for of the infrared luminosity provides the best fit to the SED.
Appendix B Tables provided in electronic form
| NAME | Flux | Error | |
|---|---|---|---|
| (m) | (Jy) | (Jy) | |
| UGC08058 | 1.23 | 6.20E-02 | 1.15E-03 |
| UGC08058 | 1.66 | 1.13E-01 | 2.00E-03 |
| UGC08058 | 2.16 | 1.99E-01 | 3.14E-03 |
| IRAS14348-1447 | 1.23 | 1.70E-03 | 1.00E-04 |
| IRAS14348-1447 | 1.66 | 2.50E-03 | 3.00E-004 |
| IRAS14348-1447 | 2.16 | 3.30E-003 | 3.00E-004 |
| NAME | UGC8058 | IR14348-1447 | IR12112+0305 | IR05189-2524 | UGC9913 | IR08572+3915 | UGC8696 | |
| Vr (Km/s) | 12642.0 | 24802.0 | 21980.0 | 12760.0 | 5400.00 | 17493.0 | 11326.0 | |
| () | Flux(Jy) | Flux(Jy) | Flux(Jy) | Flux(Jy) | Flux(Jy) | Flux(Jy) | Flux(Jy) | |
| 1.6870E+002 | 3.6604E-006 | 1.2163E-007 | 1.7817E-008 | 1.0241E-004 | 3.5968E-007 | 2.5111E-007 | 5.6713E-007 | |
| 2.0200E+002 | 4.0096E-006 | 1.3195E-007 | 2.1113E-008 | 1.4306E-004 | 4.2663E-007 | 2.7477E-007 | 6.5618E-007 | |
| 2.4200E+002 | 4.2074E-006 | 1.3802E-007 | 2.6699E-008 | 1.9900E-004 | 5.4172E-007 | 2.8617E-007 | 7.4418E-007 | |
| 1.0400E+005 | 1.1139E+000 | 3.2844E-002 | 3.4478E-002 | 4.2329E-001 | 3.3697E-002 | 7.5539E-002 | 6.6111E-002 | |
| 1.0500E+005 | 1.1514E+000 | 3.5322E-002 | 3.8008E-002 | 4.4170E-001 | 3.5531E-002 | 8.1599E-002 | 7.2495E-002 | |
| 1.0600E+005 | 1.1899E+000 | 3.7927E-002 | 4.1767E-002 | 4.6065E-001 | 3.8162E-002 | 8.8146E-002 | 7.9397E-002 | |
| NAME | UGC8058 | IR14348-1447 | IR12112+0305 | IR05189-2524 | UGC9913 | IR08572+3915 | UGC8696 | |
| Vr (Km/s) | 12642.0 | 24802.0 | 21980.0 | 12760.0 | 5400.00 | 17493.0 | 11326.0 | |
| () | Flux(Jy) | Flux(Jy) | Flux(Jy) | Flux(Jy) | Flux(Jy) | Flux(Jy) | Flux(Jy) | |
| 1.6870E+002 | 3.6604E-006 | 1.2163E-007 | 1.7817E-008 | 1.0241E-004 | 3.5968E-007 | 2.5111E-007 | 5.6713E-007 | |
| 2.0200E+002 | 4.0096E-006 | 1.3195E-007 | 2.1113E-008 | 1.4306E-004 | 4.2663E-007 | 2.7477E-007 | 6.5618E-007 | |
| 2.4200E+002 | 4.2074E-006 | 1.3802E-007 | 2.6699E-008 | 1.9900E-004 | 5.4172E-007 | 2.8617E-007 | 7.4418E-007 | |
| 1.0400E+005 | 4.8245E-001 | 1.6684E-002 | 3.4478E-002 | 2.8236E-001 | 3.3697E-002 | 8.8408E-004 | 3.4949E-002 | |
| 1.0500E+005 | 5.1720E-001 | 1.8587E-002 | 3.8008E-002 | 2.9908E-001 | 3.5531E-002 | 9.6866E-004 | 3.8960E-002 | |
| 1.0600E+005 | 5.5300E-001 | 2.0601E-002 | 4.1767E-002 | 3.1635E-001 | 3.8162E-002 | 1.0779E-003 | 4.3316E-002 | |