Energy dependence of forward diproton production in the reaction
Abstract
The differential cross section has been measured with the ANKE spectrometer at COSY–Jülich for seven proton beam energies between 0.5 and 1.97 GeV. By selecting proton pairs with an excitation energy of less than 3 MeV it is ensured that the final system is in the state. In the measured region of , the data reveal a forward dip for GeV whereas a forward peaking is seen at 1.97 GeV. The energy dependence of the forward cross section shows a broad peak in the 0.6–0.8 GeV region, probably associated with excitation, and a minimum at 1.4 GeV. Some of these features are similar to those observed for the spin–isospin partner reaction, . However, the ratio of the forward differential cross sections of the two reactions shows a significant suppression of single pion production associated with a spin–singlet final nucleon pair.
keywords:
Neutral pion production; proton–proton collisions; final state interactionsPACS:
25.40.Ep , 25.40.Qa , 13.60.Le, , , , , , , , , , , , , , , , , , , , .
Single pion production in nucleon–nucleon collisions, , is one of the principal tools used in the investigation of dynamics at intermediate energies [1, 2, 3]. Because of the large momentum transfers involved, even close to threshold, such a meson production process is sensitive to the short–distance part of the interaction.
The reaction has been the subject of extensive experimental study with the measurement of many spin observables, as well as of the differential cross section from threshold up to several GeV. However, the information that this provides is restricted to final states with spin and isospin . On the other hand, the process is kinematically very similar to this provided that the excitation energy in the final proton pair is very small. In this case, due the the Pauli principle, the protons must be in the singlet state, i.e. have quantum numbers compared to the of the deuteron. Pion production in the two cases therefore involves different transition matrix elements so that a combined study of the two processes should yield greater insight into the reaction dynamics.
If we consider the reaction as the limit of triplet production in the channel, where the strong final state interaction produces the deuteron [4], the ratio of to cross sections will provide information on the relative strength of spin–singlet to spin–triplet production, i.e. give information on the relative probability of pion production at short distances in channels with different spin orientation of the final nucleons. Because of the smallness of the signal, attempts to identify spin–singlet production directly from data on the cross section have only yielded upper limits [5, 6, 7].
A small value of the singlet–triplet ratio is expected near threshold since –wave isovector pion rescattering is absent for and heavy () meson exchange provides the largest driving term [8]. A small value of the ratio is also predicted for energies around 0.4–0.6 GeV since the –wave intermediate state that dominates the cross section is forbidden by conservation laws in the case. The theoretical situation at higher energies is largely open. The position is rather similar on the experimental side since, away from the low energy domain, the only other published data in the conditions were limited to energies GeV [9].
We have previously reported a measurement of the differential cross section obtained using the ANKE spectrometer [10] for the single beam energy of 0.8 GeV [11] . Here the two protons were detected at small angles with respect to the incident beam and cuts were made such that the excitation energy in the final system was less than 3 MeV. Under these conditions we expect the final pair to be almost purely in the singlet state. It was found for this beam energy that the angular variation was rather strong but that at all the measured angles the cross section was orders of magnitude smaller than that for . To study the energy dependence of these effects, we present here further measurements taken over a wide range of energies, 0.508, 0.625, 0.700, 1.100, 1.400, and 1.970 GeV.
The magnetic spectrometer ANKE is placed at an internal beam station of the COSY cooler synchrotron of the Forschungszentrum Jülich. Fast charged particles, resulting from the interaction of the proton beam with the hydrogen cluster–jet target [12] and passing through the analysing magnetic field, were recorded in the forward detector (FD) system [13]. The FD system includes multiwire proportional chambers for tracking and a scintillation counter hodoscope for energy loss and timing measurements. The triggers employed required the crossing of the two planes of the hodoscope by at least one charged particle (SP–trigger) or by two particles (DP–trigger) [14]. When the DP–trigger was used for data taking, the SP–trigger ran (prescaled) in parallel for luminosity measurement and calibration purposes. The tracking system provided momentum resolution in the range of interest and resolution in the excitation energy of MeV for events with MeV.
Additional details of the experimental setup and the measurement procedure are to be found in refs. [11, 13, 15, 16]. The data at 0.8 GeV and above were taken during a single beam–time run, whereas the lower energy results were obtained from other ANKE calibration runs.
From measurements of the momenta of two charged particles in ANKE, the channel was isolated by determining the missing mass in the reaction. In more than 80% of cases where two fast particles were detected, the tracks passed through different counters of the forward hodoscope. For these events the particles could be clearly identified as protons on the basis of the timing information. The difference of the arrival times of the two particles measured by the counters was compared with the time-of-flight difference deduced from the measured momenta assuming that the particles both had the mass of the proton. For the remaining of events, the hypothesis was made that the two particles were indeed protons. As already shown for the 0.8 GeV data [11], the missing–mass distributions for both classes of events are very similar with only a slightly enhanced background when no timing information was available. The two sets were therefore combined in the subsequent analysis.
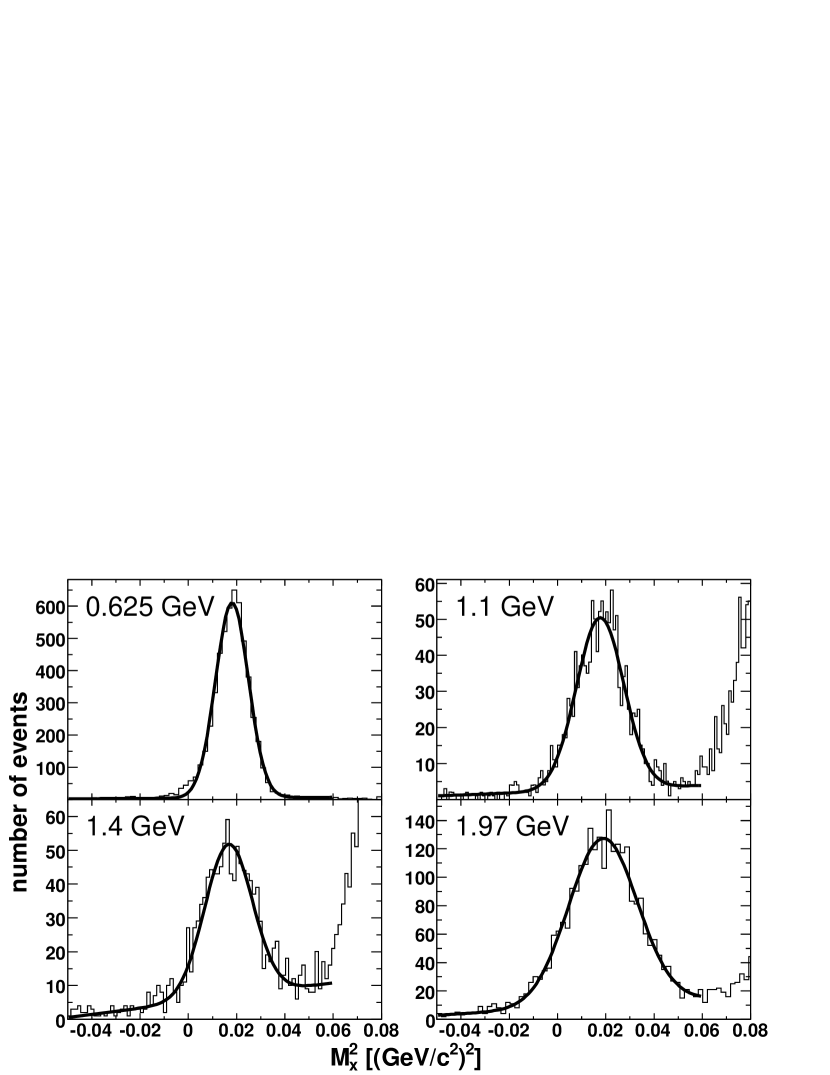
Figure 1 presents examples of the measured missing–mass distributions in the region for events with MeV. In addition to the peak, a rise of counts is seen on the right hand side due to two–pion production which seems to be largest at 1.1 and 1.4 GeV. This background gives little contribution in the region and the data were fitted as a sum of a Gaussian and straight line. The region close to was excluded from the fit since, as discussed for the 0.8 GeV data [11], there is the possibility here of some contribution from the reaction. In all cases the peak position was consistent with to within the experimental uncertainties of about MeV/c2. Events within of the central value were retained for the determination of the differential cross section. The numbers of events deduced in this way are given for the different energies in Table 1.
| (GeV) | (cm-2) | ||
| 0.508 | 0.340.02 | 131 | 0.094 |
| 0.625 | 4.60.1 | 5150 | 0.026 |
| 0.700 | 0.620.02 | 540 | 0.093 |
| 0.800 | 6.720.26 | 4679 | 0.021 |
| 1.100 | 4.080.16 | 1120 | 0.098 |
| 1.400 | 7.980.32 | 779 | 0.25 |
| 1.970 | 9.050.47 | 2065 | 0.16 |
The luminosities recorded in Table 1 were obtained by measuring in parallel elastic proton–proton scattering using the SP trigger. The ANKE setup detects the fast proton produced by this reaction for cms angles between about 10∘ and 30∘. However, to avoid regions where the acceptance changes rapidly with angle, only data from the range were retained for 1.4 GeV and below while at 1.97 GeV the interval was selected. After corrections for acceptance, the numbers of events in several bins of were compared with the values of the elastic differential cross section taken from the SP07 solution provided by the SAID phase shift analysis [17]. The precision of these predictions was checked by looking at experimental data at small angles from which it was assessed to be typically about , though a little larger at 2 GeV.
A full Monte Carlo simulation of the ANKE spectrometer has been developed within the framework of the GEANT program [18]. This allowed us to estimate the acceptance factors for different bins of the kinematic variables and hence, on the basis of the luminosities given in Table 1, to evaluate differential cross sections.
The experimental distributions in the final proton–proton variables for our data at all energies are very similar to those published at 0.8 GeV [11]. The excitation energy spectrum is well described in terms of an –wave final state interaction [4], provided that the Coulomb force is included. For MeV the angular distribution of the relative momentum vector in the final rest frame is consistent with isotropy, as expected for the production of a pair.
Although the coverage in the diproton angle with respect to the beam direction is rather limited in the ANKE spectrometer, we already noted that the data at 0.8 GeV showed a strong dependence on this angle [11]. The same is true for the other energies shown in Fig. 2 where, since the two initial protons are identical, the data are plotted as functions of . For energies of 1.4 GeV and below, the results show a forward dip whereas at the highest energy the cross section is maximal in the forward direction. This is perhaps an indication that the reaction mechanism changes with energy as different intermediate nucleon isobars are excited.
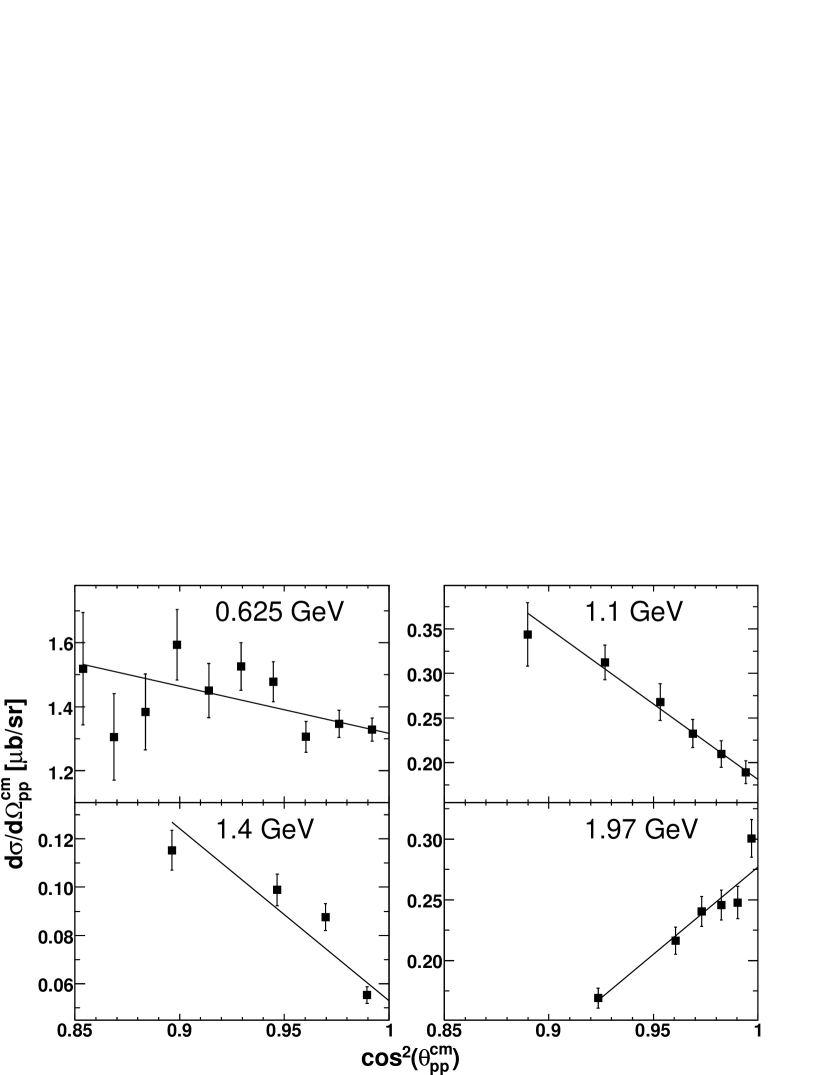
The angular distributions have been fitted with the linear form
| (1) |
and the values obtained for the forward differential cross section and the slope parameter are recorded in Table 2.
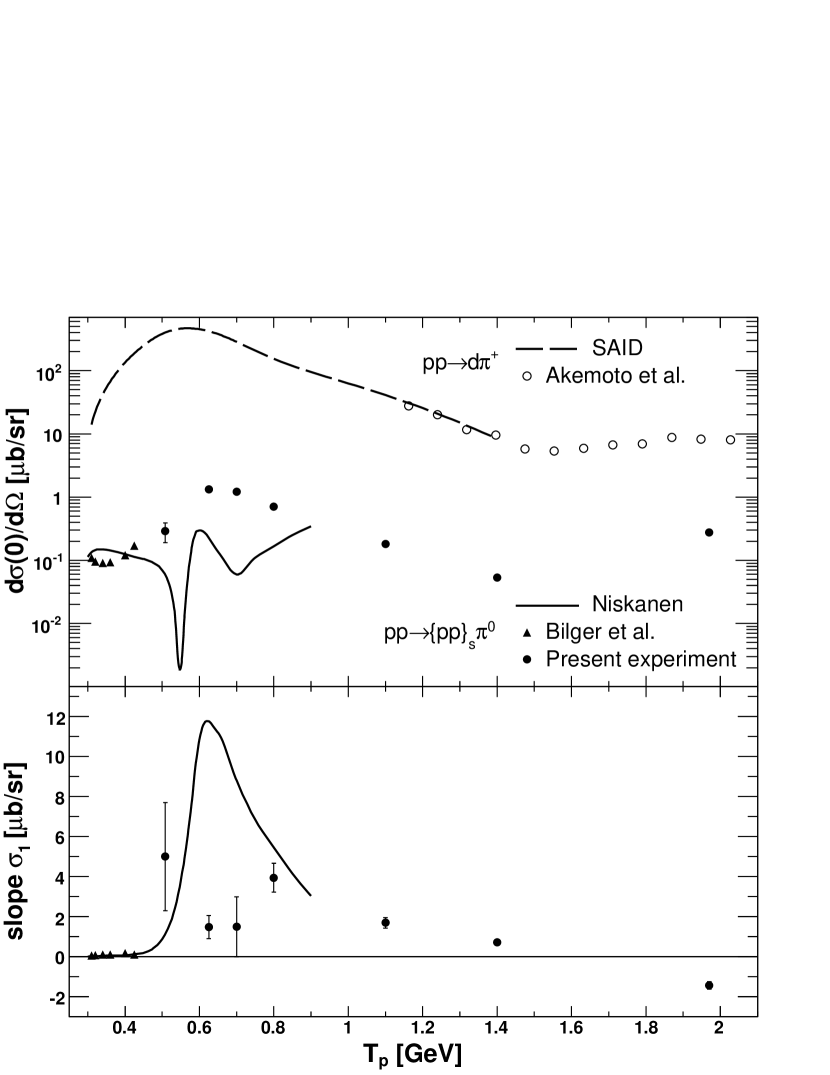
Figure 3 summarises the results from this and a previous experiment [9] by showing the energy dependence of the forward differential cross section and the slope parameter . Although the statistical error on the 0.508 GeV point is very large, the cross section data suggest a significant rise from this energy to a maximum in the 0.6–0.7 GeV region, where production is expected to be particularly strong, followed by a monotonic decline. However, the 2 GeV point lies much above this trend and this, together with the slope information shown in the lower panel, indicates that the data have entered here a different domain. A similar tendency is seen in the forward cross sections, also shown on the figure, where the cross section displays a broad minimum around 1.4 GeV after leaving the region influenced by the isobar. However, production rises at lower energies due to contributions from the excitation of the system in a relative wave, which is excluded on spin–parity grounds in the case.
| (GeV) | (b/sr) | (b/sr) | (b/sr) | |
|---|---|---|---|---|
| 0.310 | ||||
| 0.320 | ||||
| 0.340 | ||||
| 0.360 | ||||
| 0.400 | ||||
| 0.425 | ||||
| 0.508 | ||||
| 0.625 | ||||
| 0.700 | ||||
| 0.800 | ||||
| 1.100 | ||||
| 1.400 | ||||
| 1.970 |
The behaviour of the slope parameter shown in the lower panel of Fig. 3 is rather different, with a much smoother variation and a change of sign between 1.40 and 1.97 GeV. It is interesting to note that data on the differential cross section also show a small forward dip in the 0.6–1.4 GeV energy range [20] and, furthermore, that the sign of the forward slope changes in the 1.9–2.1 GeV region [21, 22].
The only theoretical estimates of the cross section and slope parameter for the reaction for the small kinematical domain have been made by Niskanen [19]. The cross section predictions shown in Fig. 3, which reflect the delicate interferences between contributions from and intermediate states, do illustrate a displacement of the peak upwards by about 100 MeV compared to . Although this agrees with our observations, Niskanen’s predicted minimum around 0.7 GeV is in complete contradiction to our findings of a maximum in this region. Furthermore we see no sign of any big peak in the slope around 0.6 GeV so that any agreement with our 0.8 GeV data seems fortuitous.
To facilitate the comparison of and production, the values of both the and forward cross sections are given in Table 2. However, to compare the strengths of pion production leading to the –wave spin–triplet and singlet states, we require rather data on the channel integrated up to 3 MeV excitation energy. Using final–state–interaction theory, this can be approximated for low excitation energies by the data through [23]
| (2) | |||||
where is the relative momentum in the final system, MeV, and , with being the deuteron binding energy. Though there are some deviations from this, due in part to the tensor force, the approximation gives a plausible description of experimental data [7].
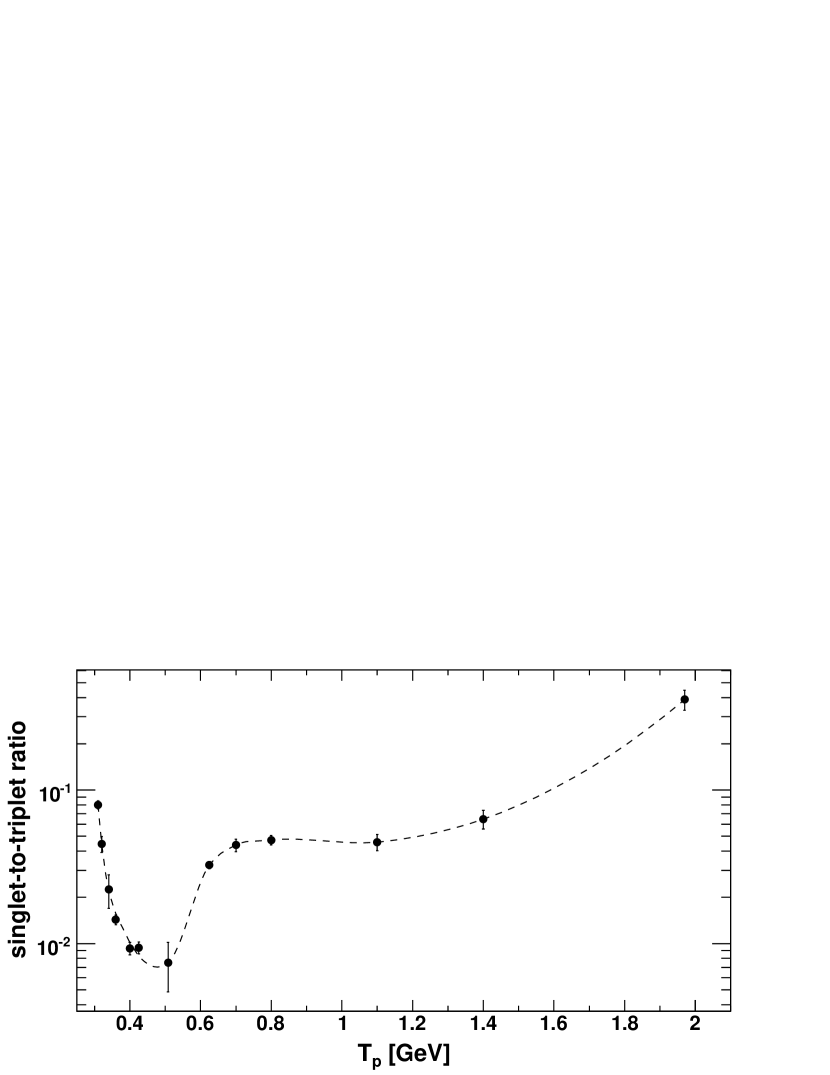
A common feature of the ratio seen in Fig. 4 is its relatively low value. Below 1.4 GeV it is typically a few per cent, which is significantly smaller than the trivial spin–statistics factor of 1/3. These conclusions are not changed significantly if the difference between the spin–singlet and triplet final state interactions are taken into account [24].
The dip in the ratio in the 0.5 GeV region is in part a reflection of the fact that the –wave intermediate state is forbidden for production whereas it plays a vital role in the case of the . However it is not at all clear why is small in the 1 GeV region where the contribution from the maximum is much reduced. On the other hand, the much larger value at 1.97 GeV is yet another indication that the reaction mechanisms might be different at higher energies.
In summary, we have measured the differential cross section for the reaction at seven beam energies from 0.5 to 1.97 GeV under the specific kinematic conditions where the proton–proton excitation energy is below 3 MeV and the cms angle between the diproton momentum and the beam axis is less than . The observed form of the spectra and isotropy of the angular distribution in the diproton cms are consistent with the assumption that the two final protons are in the state. Except for the highest energy, the data all show a sharp minimum in the forward direction and the ratio there of the differential cross sections for the and reactions is below 1%. The situation changes radically at 2 GeV when a forward maximum is observed with a much enhanced value of . This must be a reflection of a different reaction dynamics at high energies. A broad peak around 0.6–0.7 GeV is observed in the energy dependence of the zero–degree differential cross section. The data are consistent with the predicted displacement of the maximum to higher energies for production but the other features of our results are not explained by a microscopic model [19]. This could, for example, be due to phase differences between intermediate and contributions and much theoretical work still remains to be done.
We have attempted to study the relative amplitudes for the production of spin–singlet and spin–triplet final states by using a simplistic model that links the and cross sections. The resulting ratio shows that singlet production in the forward direction remains small at energies even above the excitation region.
Further data are clearly required in the 0.5–0.6 GeV region where the Niskanen model should be more reliable than at higher energies to see if there is indeed any trace of his predicted structure there. The transition region above 1.4 GeV is also of interest. Does the spin–singlet suppression continue when higher isobars enter?
For a final state there are only two spin–amplitudes for the reaction. Since we observe a very strong angular variation over our acceptance region, it is then likely that the analysing power will also be significant there. It is therefore planned that in the near future measurements of will be carried out at COSY [25] and eventually spin–correlation studies might be achievable [26]. This ensemble of data should provide a significant challenge for theory in this, one of the simplest pion–production reactions.
Acknowledgments
This work was supported in part by the BMBF grant ANKE COSY–JINR and COSY–FFE. We are grateful to other members of the ANKE Collaboration for their help with this experiment and to the COSY crew for providing such good working conditions. J.A. Niskanen kindly provided the numerical values of the calculations of Ref. [19].
References
- [1] H. Garcilazo, T. Mizutani, Systems, World Scientific, Singapore, 1990.
- [2] H. Machner, J. Haidenbauer, J. Phys. G 25 (1999) R231.
- [3] C. Hanhart, Phys. Rep. 397 (2004) 155.
- [4] K.M. Watson, Phys. Rev. 88 (1952) 1163, A.B. Migdal, Sov. Phys. JETP 1 (1955) 2.
- [5] Yu.N. Uzikov, C. Wilkin, Phys. Lett. B 511 (2001) 191.
- [6] V. Abaev et al., Phys. Lett. B 521 (2001) 158.
- [7] M. Abdel-Bary et al., Phys. Lett. B 610 (2005) 31.
- [8] C. Hanhart et al., Phys. Lett. B 444 (1998) 25.
- [9] R. Bilger et al., Nucl. Phys. A 693 (2001) 633.
- [10] S. Barsov et al., Nucl. Instrum. Methods A 462 (1997) 364.
- [11] S. Dymov et al., Phys. Lett. B 635 (2006) 270.
- [12] A. Khoukaz et al., Eur. Phys. J. D 5 (1999) 275.
- [13] S. Dymov et al., Particles and Nuclei, Letters 1 No.2 (2004) 40.
- [14] S. Dymov et al., JINR Communication E10-2002-19. Dubna, 2002.
- [15] V. Komarov et al., Phys. Lett. B 553 (2003) 179.
- [16] S. Yaschenko et al., Phys. Rev. Lett. 94 (2005) 072304.
- [17] R.A. Arndt, I.I. Strakovsky, and R.L. Workman, Phys. Rev. C 62 (2000) 034005; http://gwdac.phys.gwu.edu/.
- [18] GEANT — Detector Description and Simulation Tool. CERN Program Library Long Writeup W5013, CERN, 1993.
- [19] J.A. Niskanen, Phys. Lett. B 642 (2006) 34.
- [20] R.A. Arndt, W.J. Briscoe, R.L. Workman, and I.I. Strakovsky, Phys. Rev. C 48 (1993) 1926; http://gwdac.phys.gwu.edu/.
- [21] M. Akemoto et al., Phys. Lett. B 149 (1984) 321.
- [22] H.L. Anderson et al., Phys. Rev. D 3 (1971) 1536; D. Dekkers et al., Phys. Lett. 11 (1964) 161; R.M. Heinz et al., Phys. Rev. 167 (1968) 1232.
- [23] G. Fäldt, C. Wilkin, Phys. Lett. B 382 (1996) 209.
- [24] Yu.N. Uzikov et al., Eur. Phys. J. A 18 (2003) 317.
-
[25]
A. Kulikov, COSY proposal #158 (2007),
www.fz-juelich.de/ikp/anke/en/proposals.shtml. - [26] A. Kacharava, F. Rathmann, C. Wilkin, nucl-ex/0511028.