SpectroWeb: oscillator strength measurements of atomic absorption lines in the Sun and Procyon
Abstract
We update the online SpectroWeb database of spectral standard
reference stars with 1178 oscillator strength values of atomic
absorption lines observed in the optical spectrum of the
Sun and Procyon ( CMi A).
The updated line oscillator strengths are measured
with best fits to the disk-integrated KPNO-FTS
spectrum of the Sun observed between 4000 Å and 6800 Å using state-of-the-art detailed spectral synthesis calculations.
A subset of 660 line oscillator strengths is validated with
synthetic spectrum calculations of Procyon observed with
ESO-UVES between 4700 Å and 6800 Å. The new log(gf)-values
in SpectroWeb are improved over the values
offered in the online Vienna Atomic Line Database (VALD).
We find for neutral iron-group elements, such as
Fe i, Ni i, Cr i,
and Ti i, a statistically significant over-estimation of the
VALD log(gf)-values for weak absorption lines with normalized
central line depths below 15 %. For abundant lighter elements
(e.g. Mg i and Ca i)
this trend is statistically not significantly detectable, with
the exception of Si i for which the log(gf)-values of 60 weak and
medium-strong lines are substantially decreased to best fit the
observed spectra. The newly measured log(gf)-values are available
in the SpectroWeb database at http://spectra.freeshell.org
which interactively displays the observed and computed stellar
spectra, together with corresponding atomic line data.
1 Introduction
The SpectroWeb database is an online repository of identified spectral
lines and features observed in spectral standard reference stars.
It is permanently updated and improved, currently providing
high-resolution spectra of six bright (cool) stars selected
as primary spectroscopic reference objects:
Betelgeuse ( Ori; M2 Iab),
Arcturus ( Boo; K1 III), The Sun (G2 V), Aqr (G0 Ib),
Procyon ( CMi A; F5 IV-V), and Canopus ( Car; F0 II).
Their effective temperatures differ by about 1000 K, ranging from
3500 K (M-type) to 7500 K (F-type). These stars offer a broad range
of thermal conditions for the identification of mainly neutral and singly
ionized spectral lines formed in their atmospheres. SpectroWeb offers a comprehensive interactive database of identified spectral
lines that relies on detailed comparisons of observed spectra with advanced spectrum synthesis calculations. With its graphics display
users can zoom in on the same wavelength regions of interest in different stars to investigate changes of line intensities, and to
directly assess the reliability of the line identifications and the
quality of the corresponding atomic line data. SpectroWeb is freely
accessible online at spectra.freeshell.org. The database’s graphics interface requires a modern internet browser with an activated Java language interpreter. The object-oriented (Java ‘applet’) implementation,
for example, permits to securely link many digital spectral atlases in
a single database that is served from various world-wide-web domains
using a standard interactive display.
A concise description of the current SpectroWeb 1.0 implementation
and its basic query interactions is provided in [1].
2 Observed and theoretical spectra in SpectroWeb
The high-resolution spectrum of the Sun observed with the NSO/KPNO Fourier Transform Spectrograph (FTS) is offered in [2]. The Procyon spectrum observed with the ESO Ultraviolet and Visual Echelle Spectrograph (UVES) is offered in the ESO Science Archive [3]. The spectral resolving power of the disk integrated FTS spectrum is 350,000, while the nominal UVES resolution is 80,000. The S/N ratio of the Procyon echelle spectrum of October 2002 is 300 to 500 in the -band, which is sufficiently large to resolve weak absorption features with central depths exceeding 2 % of the normalized stellar continuum flux level. More information about the VLT-UVES instrument and pipeline calibration is given in [4] and [3]. The S/N ratio of the FTS solar spectrum observed in 1981 at the KPNO-McMath-Pierce Solar Facility is estimated around 2,500. More information about the calibration of the solar mean intensity atlas is provided in [5]. The spectra of Betelgeuse, Arcturus, and Canopus are also obtained from the ESO-UVES Archive, while the Aqr spectrum is from the Elodie Archive at the OHP. A discussion of the latter four spectra will be given elsewhere. It is more important to point out that the increase of about 1000 K between these stars towards earlier spectral types yields strong changes in the optical spectrum due to large changes of the stellar atmospheric ionization balance. For the coolest stars line blending strongly increases towards shorter wavelengths, resulting in a large decrease of the local continuum flux level to below the stellar continuum level. For M-supergiant Betelgeuse the optical spectrum is dominated by molecular opacity and mainly due to TiO.
The placement of the stellar continuum flux level to provide the continuum normalized echelle atlases in SpectroWeb is based on detailed spectral synthesis calculations between 3300 Å and 6800 Å. The observed spectra are converted to the stellar rest wavelength scale to facilitate an accurate comparison to the theoretical spectra. The latter spectra are computed with radiative transfer in LTE using 1D hydrostatic models of the stellar atmosphere. The atmospheric parameters in the model grid [6] , log , and the projected microturbulence velocity are varied until an overall best fit to the observed spectrum is obtained. It involves an iterative fit procedure whereby the differences of relative line depths between the observed and computed high-resolution spectra are minimized. The fit procedure utilizes the ‘normal’ stellar photospheric spectrum in wavelengths regions that are void of blends with strong telluric lines. It also excludes the broad H i Balmer lines, and the strong doublet lines of Ca ii H & K and Na i . The current atmosphere models omit chromospheric structures for these cool stars (including the Sun) which can alter the depth and detailed shape of the resonance lines. The detailed modeling of these broad line profiles requires semi-empiric radiative transfer calculations in non-LTE [7].
The input lists of spectral lines for radiative transfer are obtained from [8]. The detailed atomic line data in SpectroWeb is adopted from the online Vienna Atomic Line Database (VALD) [9], providing values of the line oscillator strength (log(gf)), the transition energy levels, together with the other line broadening parameters. A large number of diatomic molecular lines is incorporated to improve the position of the stellar continuum level. The spectra are currently computed for solar elemental abundance values with models of [M/H]=0.0. We use the elemental abundance values of [10] for consistency with our atmospheric models. For example, we currently adopt [Fe/H]=7.67 instead of the more recent and appreciably smaller (meteoritic) value of 7.5 [11]. The theoretical spectra do currently not include telluric lines due to water vapor and in Earth’s atmosphere. The position of the strongest and lines are only marked. The spectra are convolved with a filter to simulate the instrumental profile of the observed spectra.
3 Line oscillator strength measurements in the Sun and Procyon
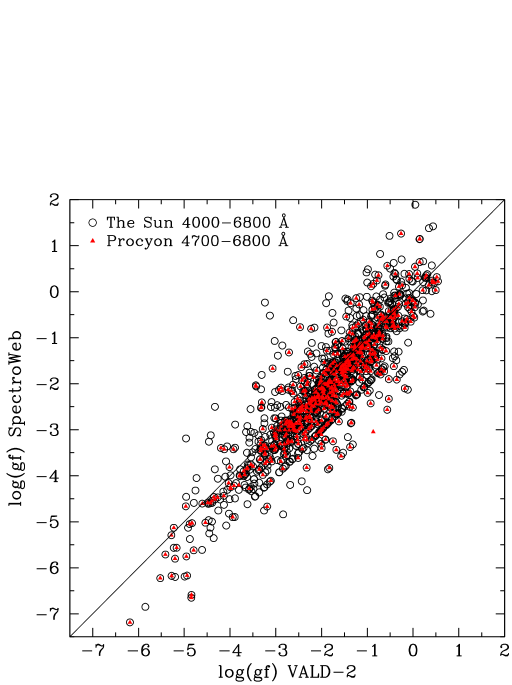
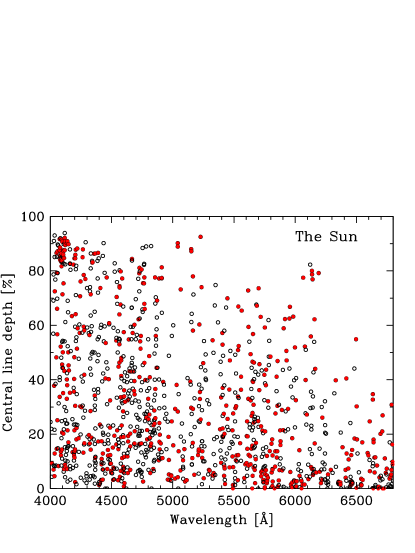
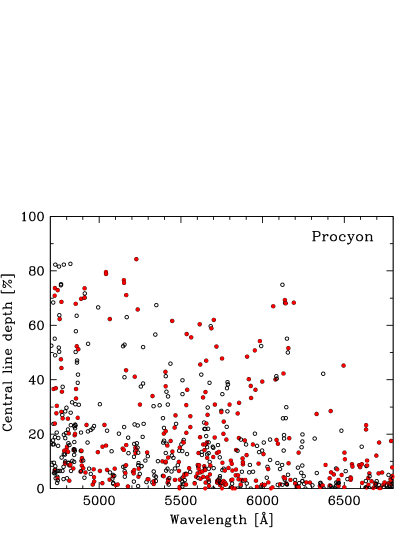
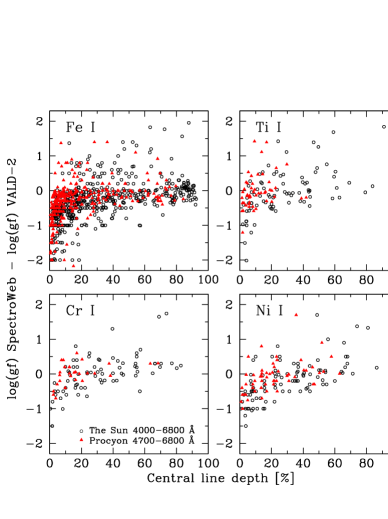
We find best spectrum fits using a constant microturbulence velocity of 1.1 in the solar atmosphere model and 1.2 in Procyon. The synthetic spectra are rotationally convolved with sin values of 2.5 and 3.6 , respectively. Hyperfine line splitting has not been incorporated so far. Figure 1 shows 1178 lines for which we correct the VALD-2 log(gf)-values to the values in SpectroWeb, yielding the best fit to the solar spectrum between 4000 Å and 6800 Å (open symbols). The corrected log(gf)-values of 660 lines between 4700Å and 6800 Å have currently been validated against the spectrum of Procyon (filled triangles). The amount of corrected weak, medium-strong, and strong absorption lines is almost uniformally distributed over both wavelength bands. Figures 2 & 3 indicate a somewhat smaller number of strong lines that are corrected longward of 6000 Å because the total number of strong lines diminishes longwards in both spectra. The amounts of corrected Fe i lines (filled symbols) with central normalized depths below 40 % (we compute without instrumental broadening) are uniformally distributed in both stars. The neutral lines become weaker in Procyon because is 1000 K larger and we can also adopt solar abundance values [12].
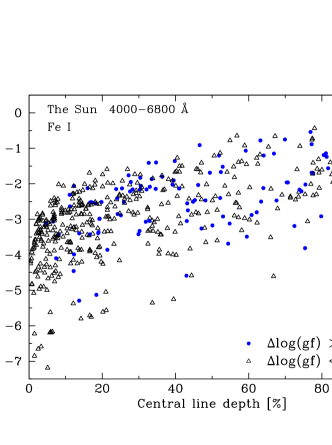
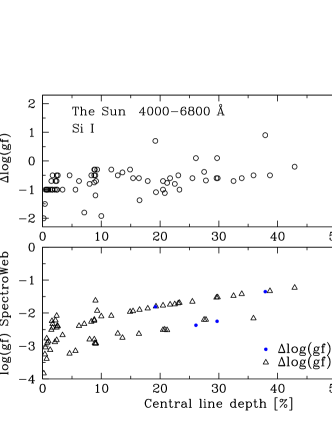
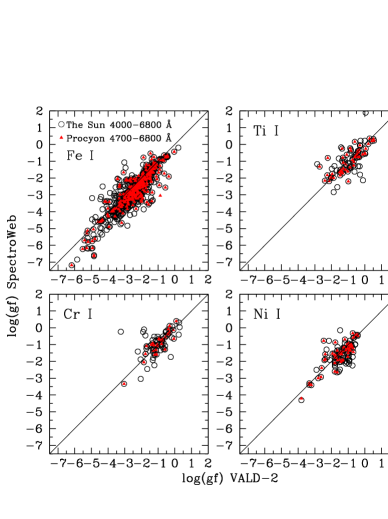
Figure 1 reveals that the majority of lines we correct in both stars require log(gf)-values appreciably smaller than the VALD values. The center-of-gravity of the point cloud of measured lines in Fig. 1 is located below the diagonal line (thin drawn line) around (2.0, 2.5) in the linear logarithmic scale. Figure 4 shows comparable plots of corrected log(gf)-values in Fig. 1 for individual lines of Fe i, Ti i, Ni i, and Cr i. We find a statistically significant over-estimation of the VALD log(gf)-values in our sample of measured Fe i lines. We also measure an over-estimate of the VALD log(gf)-values in our sample of Ni i lines, although it covers a considerably smaller range of log(gf)-values than the Fe i sample. We find that the log(gf)-values of primarily weak lines, with normalized central line depths below 15 %, are on average over-estimated in the VALD database. Figure 5 shows a plot of the lines in Fig. 4 with the measured log(gf)-correction (log(gf) equals the log(gf)-value of SpectroWeb minus the VALD log(gf)-value) compared to the normalized line depth. We observe the trend of over-estimated VALD log(gf)-values in weak lines of all iron-group elements for which we measure a sufficiently large number of lines. On the other hand, for the medium-strong and strong lines (e.g. with line depths 20 %) our log(gf)-measurements yield almost equal amounts of lines for which the VALD values are over- and under-estimated. In Fig. 6 the VALD log(gf)-values of weak Fe i lines observed in the Sun are almost systematically decreased (log(gf)0) to log(gf)-values in SpectroWeb below 2.0. The stronger lines require log(gf)0 (open triangles) and log(gf)0 (filled symbols) corrections for comparable amounts of lines to best fit the observed solar spectrum. A similar trend of over-estimated log(gf)-values from VALD for weak lines of lighter elements (21) is statistically not significantly detectable because our sample of lines is too small. We find this with the exception of the neutral lines of -element Si in the Sun. For 60 weak and medium-strong Si i lines in a sample of 65 Si i lines (Fig. 7) we measure log(gf)0 (upper panel). Although the number of 65 Si i lines is rather limited we find that the log(gf)-values of both weak and medium-strong lines are significantly over-estimated in VALD because there are tight dependences between the corrected log(gf)-values and the computed line depths for Si i lines belonging to the same multiplets. The lower panel of Fig. 7 shows these dependences which are related to the curve-of-growth of the line equivalent widths.
Possible shortcomings in our atmospheric model structures or spectral synthesis calculations cannot readily explain a systematic over-estimation of the VALD log(gf)-values for weak neutral lines of iron-group elements in the Sun and Procyon. Important systematic effects due to non-LTE and the chromosphere are expected for strong lines rather than for weak lines. A decrease of the model abundances of all iron-group elements would systematically decrease the over-estimated line depths we compute with the VALD log(gf)-values for weak lines in our sample. However, lowering the abundances of all iron-group elements is not an option since a decrease of 0.2 dex is currently adopted for Fe only [11]. An abundance decrease for iron-group elements would also offset numerous lines in our theoretical spectra that do correctly match the observed spectra and that are exempt from our sample of 1178 corrected lines. We also perform spectral synthesis calculations with the more recent opacity distribution functions of [13], but which could not remove this trend. A far more likely source for the trend is the limited accuracy of small log(gf)-values for weak lines offered in VALD. For example, we find that 14 Fe i and 7 Si i lines must be removed from the VALD line list because they are not observed in the Sun and Procyon. It points to problems with advanced calculations of semi-empriric (approximate) line oscillator strengths for complex model atoms of the iron-group elements. The accuracy of the predicted log(gf)-values for many lines of these complicated atoms is limited, and we find that they are systematically over-estimated for weak neutral lines. An explanation for the over-estimated VALD log(gf)-values for our sample of Si i lines is less clear because many other Si i lines do correctly fit the solar spectrum using VALD data. We think however that it results from problems with a small number of multiplets from high energy levels (5-6 eV) in the neutral Si atom, yielding oscillator strength values in VALD of low accuracy for both weak and medium-strong lines.
4 Conclusions
We measure the log(gf)-values of 1178 atomic absorption lines we identify in the Sun with advanced synthetic spectrum calculations. The new log(gf)-values of 660 lines are verified in Procyon. The measured log(gf)-values are available in the online SpectroWeb database and are corrections of the values provided in VALD. We find systematic over-estimations of the VALD values for many weak neutral lines of iron-group elements, and for a smaller sample of weak and medium-strong Si i lines. The log(gf) over-estimations are attributed to the limited accuracy of small log(gf)-values for weak lines presently offered in VALD. The oscillator strengths of many weak and strong lines in both stars require further updates for reliable future line identifications.
This work has been supported by the Belgian Federal Science Policy - Terugkeermandaten. Mr. P. Depoorter is gratefully acknowledged for assistance with the spectral line measurements.
References
References
- [1] Lobel A 2007 Proc. of XXVIth IAU Joint Discussion 4 The Ultraviolet Universe: Stars from Birth to Death 16-17 August 2006 Prague, ed A Gomez de Castro and M Barstow (Madrid: Complutense Univ. of Madrid Publ.) p 167
- [2] Neckel H 1987 Solar Phys. 184 421
- [3] Bagnulo S, Jehin E, Ledoux C, Cabanac R, Melo C, Gilmozzi R and the ESO Paranal Science Operations Team 2003 Messenger 114 10
- [4] Dekker H, D’Odorico S, Kaufer A, Delabre B and Kotzlowski H 2000 Proc. SPIE Optical and IR Telescope Instrumentation and Detectors, ed M Iye and A F Moorwood 4008 534
- [5] Neckel H and Labs D 1984 Solar Phys. 90 205
- [6] Kurucz R L 1994 Solar Abundance Model Atmospheres for 1, 2, 4, 8 km/s (Cambridge, Mass.) Kurucz CD-ROM No. 13
- [7] Lobel A 2005 Proc. of the 13th Cambridge Workshop on Cool Stars, Stellar Systems and the Sun 5-9 July 2004 Hamburg Germany, ed F Favata et al. ESA SP-560 p 327
- [8] Kurucz R L and Bell B 1995 (Cambridge Mass.) Kurucz CD-ROM No. 23
- [9] Kupka F, Piskunov N E, Ryabchikova, T A, Stemples H C and Weiss W W 1999 Astr. and Astroph. Suppl. Ser. 139 119
- [10] Anders E and Grevesse N 1989 Geochimica et Cosmochimica Acta 53 197
- [11] Grevesse N and Sauval J 1998 Space Sci. Rev. 85 161
- [12] Kato K, Watanabe Y and Sadakane Y 1996 Publ. Astron. Soc. of Japan 48 601
- [13] Castelli F and Kurucz R L 2003 New Grids of ATLAS9 Model Atmospheres Modelling of Stellar Atmospheres Uppsala Sweden, ed N Piskunov, W W Weiss and D F Gray IAU Symp. 210 PASP A20