Equilibria of culture contact derived from ingroup and outgroup attitudes
Abstract
Modern societies feature an increasing contact between cultures, yet we have a poor understanding of what the outcomes might be. Here we consider a mathematical model of contact between social groups, grounded in social psychology and analyzed using tools from statistical physics. We use the model to study how a culture might be affected by immigration. We find that in some cases residents’ culture is relatively unchanged, but in other cases residents may adopt the opinions and beliefs of immigrants. The decisive factors are each group’s cultural legacy and its attitudes towards in- and out-groups. The model can also predict how social policies may influence the outcome of culture contact.
-
1.
Department of Mathematics, University of Bologna.
-
2.
Stockholm University Centre for the Study of Cultural Evolution.
-
3.
Department of Psychology, University of Bologna.
1 Introduction
Contact between cultures is a prominent feature of modern society, driven by large-scale migration, global media, communication networks, and other socio-economical forces (lull00 ). Understanding how human cultures interact is crucial to such issues as immigration management and the survival of national and minority cultures (corn94 , give05 ), yet the dynamics of culture contact are poorly known. Here we explore the problem considering a single cultural trait that can take two forms, such as being in favor or against the death penalty, or whether to wear or not a particular piece of clothing. We are interested in: 1) how the two trait forms are distributed among subgroups in a population, e.g., residents and immigrants, males and females, social classes, etc.; and 2) how different subgroups influence each other’s traits. We start with assumptions about how individuals may change their opinions and behaviors as a consequence of social interactions, and then derive the population-level consequences of such assumptions using tools from statistical physics. We study the case of immigration in detail, and conclude that culture contact may sometime result in residents taking on the opinions and beliefs of immigrants, depending on each group’s cultural legacy, its attitudes toward in- and out-groups, and social policies.
Our main assumption about how individuals may change their traits is the so-called “similarity-attraction” hypothesis of social psychology: an individual tends to agree with those who are perceived as similar to oneself, and to disagree with those who are perceived as different (byrne71 , grant93 , byrn97 , mich02 ). Additionally, individuals can be influenced by other forces favoring one form of a trait over the other. For instance, a media campaign may advertise in favor or against a given idea or behavior. To determine the distribution of opinions among subgroups of a population (after they have been in contact for some time) we apply statistical mechanics, a branch of theoretical physics that studies the collective properties of systems composed of many parts that interact according to given rules. These techniques were originally developed to derive the laws of thermodynamics from molecular dynamics (thompson79 ), but have been applied also to biological (amit89 , arbi03 ) and social systems, including models of social choice (schelling73 , granovetter78 , durl99 , watts02 , macy_etal03 ). The latter consider how collective opinions or choices emerge within a homogeneous social group. The model we discuss here is, to our knowledge, the first one to consider populations consisting of different social groups in interaction.
2 General framework
We now outline a general framework for modelling group-level consequences of interactions among individuals (contucci_ghirlanda07 ). Individual is described by a binary variable , representing the two possible forms of the considered trait (). A group is characterized by the mean value , which can be measured by, say, a referendum vote or a survey. To apply statistical mechanics we formalize as follows the interaction between individuals. Let be the similarity that individual perceives with and assume that is the level of similarity above which individuals tend to agree, and below which they tend to disagree. We can then recast the similarity-attraction hypothesis in the form of a minimization rule, assuming that , when interacting with , tends to assume the trait value that minimizes the quantity
| (1) |
This assumption agrees with the similarity-attraction hypothesis because, when the expression is minimized by agreement (), and when by disagreement (). For simplicity we let in the following. Then favors agreement and favors disagreement. We say “favor” because we do not assume strict minimization. Rather, we assume that a trait value yielding a lower value of (1) occurs with a higher probability, but not with certainty (see appendix). The rationale for this assumption is that similarity to others is not the sole determinant of an individual’s trait (byrn97 , mich02 ).
When an individual interacts with many others, we assume that she tends to minimize the sum, , of all functions (1) relative to each interaction:
| (2) |
where the sum extends over all individuals with whom interacts. In summary, the effect of changing one’s trait is gauged according to whether it makes an individual agree or disagree with others,
The effect of factors such as the media or social norms is, for each individual, to favor a particular trait value. This can be included in our minimization scheme by adding a term to (2):
| (3) |
The added term means that is favored if , while favors . We now define a group-level function as the sum of individual functions:
| (4) |
where is the set of all individual traits. The function is referred to as the system Hamiltonian in statistical mechanics, where it usually arises from consideration of a system’s physical properties. Here, on the other hand, we have designed the function so that lower values of correspond to group states that, given our assumptions about individual psychology, are more likely to occur. It is this property that allows us to use statistical mechanics (thompson79 ). Note that we do not assume that individuals explicitly carry out, or are aware of, the computations in equation (4).
3 Culture contact in immigration
We consider a large and a small group, referred to, respectively, as residents () and immigrants (). We are interested in the effect of one group upon the other, i.e., how culture contact changes the mean trait values in the two groups. If residents and immigrants have markedly different culture, the similarity-attraction hypothesis implies that should be positive for interactions within a group and negative for interactions between groups. A simple assumption (called mean field in statistical mechanics) is that depends only on group membership. This corresponds to the ingroup and outgroup concepts of social psychology (brown00 ) and can be formalized as follows:
| (5) |
where the factor guarantees that the group function, equation (4), grows proportionally to the number of individuals. Before the two groups interact, residents and immigrants are each characterized by a cultural legacy that includes given mean values of the considered trait, say and . Our goal is to predict the values and after the interaction has taken place. To describe the effect of cultural legacies we reason as follows. Within a group, a mean trait means that the two forms of the trait are not equally common. Thus preexisting culture can be seen as a force that favors one trait value over the other, and can be modeled by a force term as in (3). In other words, a model in which individuals are biased so that the mean trait is is equivalent to a model with unbiased individuals subject to a force of appropriate intensity. The latter can be calculated by standard methods of statistical mechanics as
| (6) |
where is the inverse hyperbolic tangent and is the ingroup attitude (thompson79 , contucci_ghirlanda07 ). Statistical mechanics also allows to calculate the values of and after culture contact as the solution of a system of equations (see appendix):
| (7) |
where is the hyperbolic tangent, is the fraction of immigrants in the compound group, and and are calculated for each group according to (6).
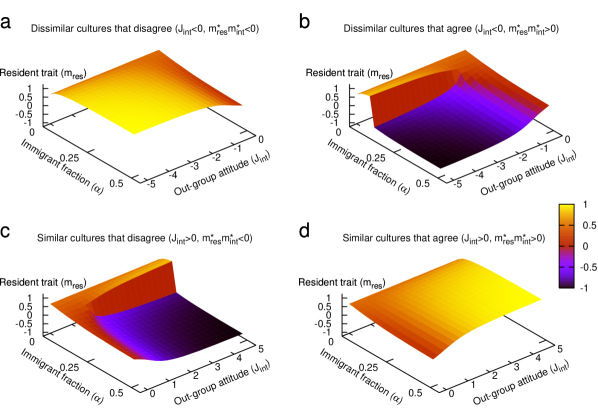
Numerical analysis of these equations reveals two main patterns of behavior depending on the sign of the product (figure 1). When a small fraction of immigrants causes only small changes in residents’ trait, as intuition would suggest. This includes two distinct cases: either the two groups agreed before the interaction () and have similar culture (, figure 1a) or they disagree and have dissimilar culture ( and , figure 1d). The second pattern of results occurs when , in which case there exists a critical fraction of immigrants, , above which residents suddenly change to a nearly opposite mean trait value. This can happen either when the two groups agree and have dissimilar culture ( and , figure 1b) or when the groups disagree and have similar culture ( and , figure 1c). This dramatic phenomenon only exists when attitudes toward the outgroup (either positive, figure 1b, or negative, figure 1c) are strong enough. The shift can thus be inhibited by decreasing the magnitude of . According to our assumptions, this amounts to making the groups less similar when they are similar and less different when they are different.
|
|
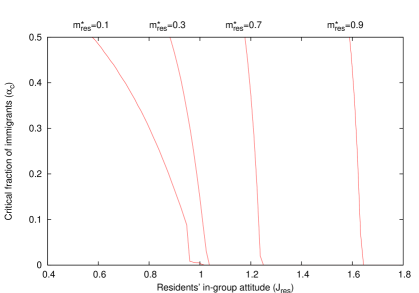
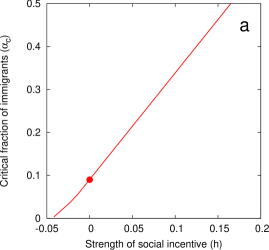
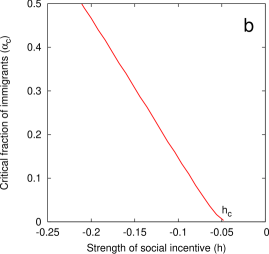
There are other ways in which dramatic shifts in residents’ trait may be prevented. It is possible, for instance, to reduce the strength of residents’ ingroup attitude, (figure 2). According to the similarity-attraction hypothesis, a higher value of corresponds to higher ingroup similarity. Hence our model suggests that a more culturally homogeneous groups has a greater risk of undergoing a dramatic transition when confronted with an immigrant culture. That is, encouraging cultural diversity among residents may make their culture more robust. One may also try to influence individuals directly, introducing, e.g., social incentives that encourage a given trait (modeled by terms as in equation 3). Consider a situation in which residents are predicted to change trait when the fraction of immigrants passes a critical value, (figure 1b). In such a case can be increased subjecting individuals to an incentive that favors the residents’ original trait (figure 3a). An incentive in the opposite direction, on the other hand, decreases , suggesting that the impact of social policies can be dramatic. Indeed, we show in figure 3 that an incentive can trigger dramatic changes even when these are impossible with , as for instance in figure 1d.
4 Discussion
Clearly, our model is only an approximation to the complexities of culture contact. Yet it exhibits a rich set of behaviors that, we hope, may help to understand this complex phenomenon and promote the development of more refined models. Our approach can be developed by considering more individual traits (so that changes in culture as a whole can be assessed), more realistic patterns of interactions among individuals (social networks), individual variability in ingroup and outgroup attitudes, and more complex rules of individual interaction. Our basic hypothesis (similar individuals imitate each other more strongly than dissimilar ones), however, is well rooted in social psychology (byrne71 , byrn97 ), including studies of intergroup behavior (grant93 , mich02 ), and we expect it to remain an important feature of future models.
Acknowledgments
We thank Francesco Guerra, Giannino Melotti and Magnus Enquist for discussion. Research supported by the CULTAPTATION project of the European Commission (FP6-2004-NEST-PATH-043434).
References
- [1] Lull, J. Media, communication, culture. Polity Press, Cambridge, UK, (2000).
- [2] Cornelius, W. A., Martin, P. L., and Hollifield, J. F., editors. Controlling Immigration: A Global Perspective. Stanford University Press, Stanford, CA, (1994).
- [3] Givens, T. and Luedtke, A. Comp. Europ. Politics 3, 1–22 (2005).
- [4] Byrne, D. The attraction paradigm. Academic Press, New York, (1971).
- [5] Grant, P. R. Can. J. Behav. Science 25, 28–44 (1993).
- [6] Byrne, D. J. Pers. Soc. Psychol. 14, 417–431 (1997).
- [7] Michinov, E. and Monteil, J.-M. Europe. J. Soc. Psychol. 32, 485–500 (2002).
- [8] Thompson, C. Mathematical Statistical Mechanics. Princeton University Press, Princeton, NJ, (1979).
- [9] Amit, D. Modeling brain function. Cambridge University Press, Cambridge, (1989).
- [10] Schelling, Thomas C. Hockey Helmets, Concealed Weapons, and Daylight Saving: A Study of Binary Choices with Externalities. Journal of Conflict Resolution 32, 381–428 (1973).
- [11] Granovetter, M. S. Threshold models of collective behavior. American Journal of Sociology 83, 1420-1443 (1978).
- [12] Durlauf, S. N. Proc. Natl. Acad. Sci. U.S.A. 96, 10582–10584 (1999).
- [13] Watts, Duncan J. A simple model of information cascades on random networks. Proceedings of the National Academy of Science, U.S.A 99, 5766-5771 (2002).
- [14] Arbib, M. A. The Handbook of Brain Theory and Neural Networks. MIT Press, 2 edition, (2003).
- [15] Macy, M. W., Kitts, J. A., Flache, A., and Benard, S. In Dynamic Social Network Modeling and Analysis, 162–173. National Academic Press, (2003).
- [16] Contucci, P. and Ghirlanda, S. Quality & Quantity (in press).
- [17] Brown, R. Group processes: dynamics within and between groups. Blackwell Academic Publishing, Oxford, 2 edition, (2000).
- [18] Mezard, M., Parisi, G., and Virasoro, M. A. Spin Glass Theory and Beyond. World Scientific, Singapore, (1987).
- [19] Fermi, E. Thermodynamics. Dover, New York, (1936).
- [20] Contucci, P., Gallo, I., and Menconi, G. http://arxiv.org/physics/0702076.
Appendix
Statistical mechanics assigns to each system configuration a probability that is inversely related to the value of through an exponential function [thompson79, ]
| (8) |
where the denominator is a normalization factor ensuring . Equation (8) can be proved in a number of important cases [thompson79, ], but is also used heuristically in more general settings [meza87, ]. In particular, the exponential is the only function compatible with basic assumptions relevant for social as well as physical systems, such that the probability of events relative to two independent subsystems must multiply while other quantities (e.g., entropy, see below) must add [fermi36, ].
The probability distribution (8) is used to calculate the so-called free energy, from which one can derive system-level quantities such as the mean trait values and . The free energy is defined as the difference between internal energy , i.e. the average of with respect to (8), and entropy :
| (9) |
For the model in the main text one may show that [contucci_etal07, ]
| (10) |
and
| (11) | |||||
The values of and are obtained from these expressions by minimizing (9), which yields equation (7).