Sodium Absorption From the Exoplanetary Atmosphere of HD189733b Detected in the Optical Transmission Spectrum111Based on observations obtained with the Hobby-Eberly Telescope, which is a joint project of the University of Texas at Austin, the Pennsylvania State University, Stanford University, Ludwig-Maximilians-Universität München, and Georg-August-Universität Göttingen.
Abstract
We present the first ground-based detection of sodium absorption in the transmission spectrum of an extrasolar planet. Absorption due to the atmosphere of the extrasolar planet HD189733b is detected in both lines of the Na I doublet. High spectral resolution observations were taken of eleven transits with the High Resolution Spectrograph (HRS) on the 9.2 meter Hobby-Eberly Telescope (HET). The Na I absorption in the transmission spectrum due to HD189733b is deeper in the “narrow” spectral band that encompasses both lines relative to adjacent bands. The 1 error includes both random and systematic errors, and the detection is 3. This amount of relative absorption in Na I for HD189733b is 3 larger than detected for HD209458b by Charbonneau et al. (2002), and indicates these two hot-Jupiters may have significantly different atmospheric properties.
1 Introduction
High signal-to-noise () and high spectral resolution observations of transiting exoplanets provide an opportunity to measure the properties of exoplanet atmospheres and exospheres. Early theoretical models predicted that absorption, due to exoplanetary atmospheres, should be detectable in the strong resonance lines of Na I and other alkali metals in optical transmission spectra (Seager & Sasselov, 2000; Brown, 2001). Charbonneau et al. (2002) used medium resolution spectra ( 5,540) of Na I from the Space Telescope Imaging Spectrograph (STIS) onboard the Hubble Space Telescope (HST) to make the first detection of absorption in the transmission spectrum caused by the exoplanetary atmosphere of HD209458b during transit. The measured Na I absorption, made in the “narrow” spectral window (5887–5899 Å) since the doublet is not fully resolved, was deeper than in adjacent bands during transit, and weaker than model predictions by a factor of 3. Adjustments to cloud levels, metallicity, rainout of condensates, distribution of stellar flux, and photoionization of sodium could account for the discrepancy between the models and observations (Barman, 2007; Fortney et al., 2003). Exospheric absorption was also detected for HD209458b in several UV lines by Vidal-Madjar et al. (2003, 2004).
Previous ground-based attempts to detect absorption in the optical transmission spectra of HD209458 and other bright transiting systems have measured only upper limits, likely due to limited observations of only a single effective transit (e.g., Bundy & Marcy, 2000; Moutou et al., 2001; Winn et al., 2004; Narita et al., 2005; Bozorgnia et al., 2006). In addition, contaminants, such as telluric lines and, in some cases, the use of an iodine cell, hindered or prevented measurements of several spectral features, most notably the Na I lines.
Bouchy et al. (2005) announced the identification of the short-period ( days) transiting exoplanet around the bright () K0V star, HD189733. Subsequent work on this system tightly constrained the orbital parameters (Hébrard & Lecavelier Des Etangs, 2006; Bakos et al., 2006), determined that the axis of stellar rotation is aligned with the planetary orbital axis using the Rossiter-McLaughlin effect (Winn et al., 2006), found evidence for photometric stellar variability and a stellar rotational period of 12 days (Henry & Winn, 2007; Winn et al., 2007), and identified transit signatures of starspots (Pont et al., 2007). Infrared studies of this system have been successful in characterizing the atmospheric temperature distribution (Deming et al., 2006; Knutson et al., 2007b).
2 Observations and Data Reduction
Based on the previous ground-based attempts to detect exoplanetary absorption in transmission spectra, our program strategy was designed to observe multiple transits and to specifically target the strong Na I lines. Observations of HD189733 were taken over the course of a year (11 Aug 2006 to 11 Aug 2007) using the 9.2 meter Hobby-Eberly Telescope (HET; Ramsey et al. 1998) High Resolution Spectrograph (HRS; Tull 1998). These observations cover the spectral range from 5000–9000 Å, with a resolving power of 60,000. No iodine cell was used. A bright, rapidly rotating, B star ( Del) was observed immediately after HD189733 in order to characterize the telluric absorption. We obtained spectra during 11 in-transit visits, and 25 out-of-transit visits. Each visit is typically comprised of several (3.2 during transits and 5.1 outside of transits) 600 second exposures, and the at Na I of each exposure is 320 per resolution element. Observations are considered in-transit, if the entire exposure is obtained within first and fourth contact.
The data were reduced using Image Reduction and Analysis Facility (IRAF; Tody, 1993) and Interactive Data Language (IDL) routines to subtract the bias, flat field the images, remove scattered light and cosmic ray contamination, extract the echelle orders, calibrate the wavelength solution, and convert to heliocentric velocities. Local interstellar medium (LISM) and stellar lines were removed from the telluric standard before being applied to the target spectra. LISM Na I absorption is detected in the spectra of Del (74 pc), our telluric standard, consistent with LISM detections toward other nearby stars (Redfield & Linsky, 2002) and previous Ca II and Na I observations of Del by Vallerga et al. (1993) and Welsh et al. (1991). Stellar lines in our telluric standard, a rapidly rotating hot B-star, are very weak, and were removed using a stellar model (Koesterke et al., 2007; Fitzpatrick & Massa, 2005; Castelli & Kurucz, 2006). Observations of HD189733 were divided by the cleaned telluric standard spectra to remove the contaminating telluric features.
To create the in-transit and out-of-transit templates, additional processing was required to match the blaze response and wavelength calibration of all observations. Over the short spectral windows (30 Å) of interest, fluctuations in the blaze response are smooth and slowly varying, and were easily characterized by a low order polynomial. Likewise, precise spectral alignment required small adjustments (0.1–0.2 pixels) to the wavelength solution based on the cross correlation of nearby stellar lines.
3 Na I Transmission Absorption
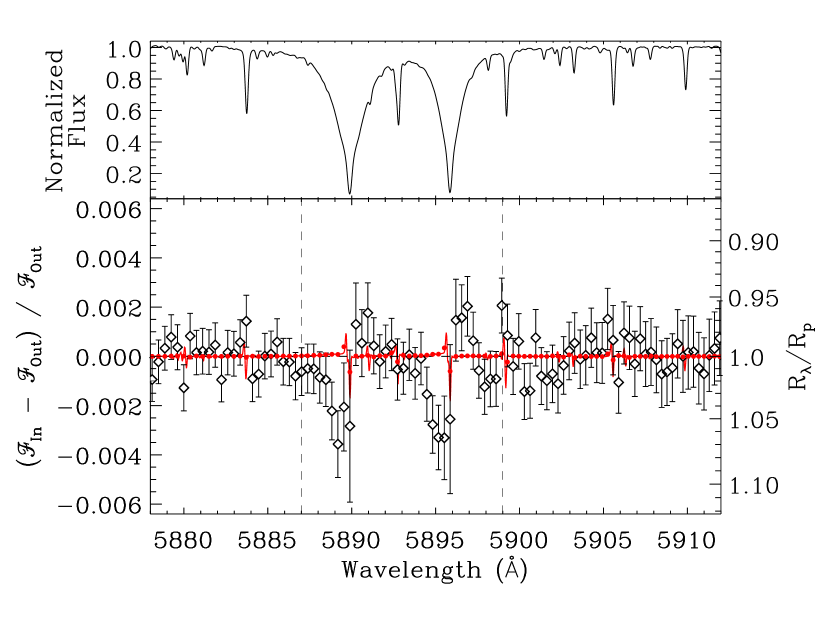
Figure 1 shows the observed Na I region of the stellar spectrum. The doublet is fully resolved and accompanied by many weak stellar lines. The bottom plot shows the transmission spectrum, or the difference of the relative fluxes, , of the ultra high in-transit template (; ) and the even higher out-of-transit template (; ). The signal predicted due to differential stellar limb-darkening is shown, and has been removed from the observations, although the impact is minimal.
Excess absorption is clearly detected in the in-transit spectrum () compared to the out-of-transit spectrum () for both Na I lines. Using the same “narrow” spectral region defined by Charbonneau et al. (2002), 5887–5899 Å, we measure an excess of absorption , when compared to the adjacent spectrum. This is 3 larger than measured for HD209458b ([; Charbonneau et al., 2002). We measure a random error of , comparable to that achieved by the STIS/HST observations.
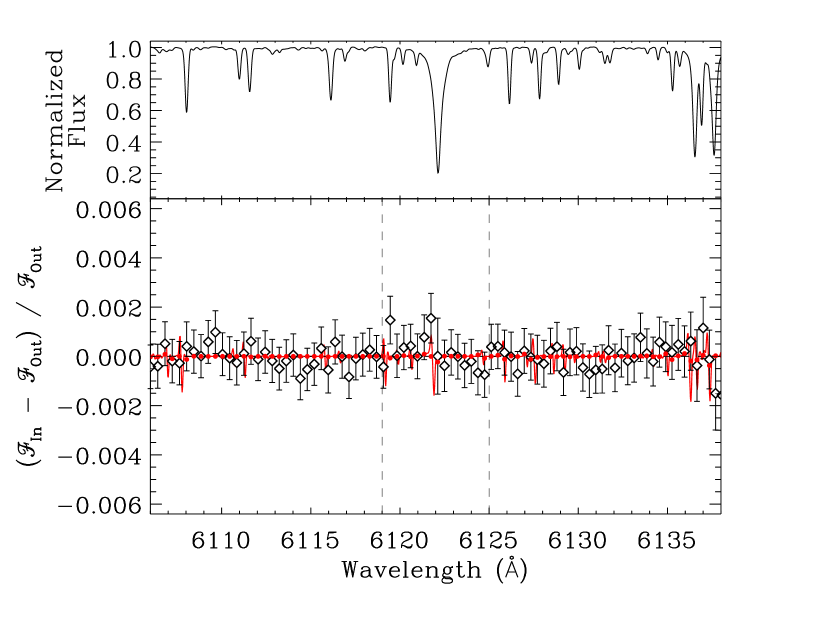
We also analyze a neighboring strong stellar line that is predicted to show no significant exoplanetary atmospheric absorption. In Figure 2, we present the same analysis near the Ca I line at 6122 Å. No absorption is detected in this region, and over a narrow spectral range from 6119–6125 Å, we measure an insignificant amount of emission , consistent with there being no difference between the in-transit and out-of-transit templates.
3.1 Stellar Limb Darkening
Differential limb-darkening, the relative difference in the limb-darkening response of the cores of spectral lines and the continuum, contributes to the transmission spectrum. Since we are dealing with a narrow spectral window, and the spectra are normalized by the adjacent continuum, these observations are not sensitive to the broadband color dependency expected due to limb-darkening (Brown et al., 2001; Ballester et al., 2007).
Essentially, the in-transit template is a collection of spectra where a small fraction, (2.5%; Pont et al. 2007), of the stellar disk is blocked. This blocked component causes a loss of flux at a particular radial velocity, and leads to the Rossiter-McLaughlin effect (Winn et al., 2006). In addition, the blocked component is associated with a specific -angle, and therefore causes the loss of a specifically limb-darkened fraction of the stellar disk. The observational distribution of angles, all necessarily 0.73 since the HD189733b transits at an angle slightly inclined from precisely edge-on (; Pont et al., 2007), will produce a unique differential limb-darkening signature. Indeed, with sufficient , a transiting exoplanet could be used as a blocking obstruction, where the resulting differential limb-darkening spectrum would constrain, among other things, the temperature profile of the stellar atmosphere. In our case, we are concerned about the contribution this signal may have on the absorption feature in the transmission spectrum.
We use a stellar model of HD189733, based on literature values, K, , and Fe/H (Bouchy et al., 2005), to calculate the stellar flux blocked by the exoplanet for each observation (Koesterke et al., 2007). We assume a 0.755 star and a 1.154 planet (Pont et al., 2007). The blocked flux is subtracted from the integrated disk flux and the continuum is normalized. The colored spectrum in the bottom panel of the left plot in Figures 1 and 2, shows the relative difference spectrum due to differential limb-darkening for our distribution of in-transit observations. The contribution of differential stellar limb-darkening is much smaller than the observed absorption, and as for HD209458 (Charbonneau et al., 2002), at Na I, it is actually a net emission, where it contributes in the “narrow” spectral window. At Ca I the contribution is . In both cases, the differential limb-darkening contribution is well below the 1 random error.
3.2 Empirical Monte Carlo
Given the weakness of any atmospheric absorption in a transmission spectrum, it is critical to assess the contribution of systematic errors. Systematic errors associated with data reduction may arise from the continuum normalization, wavelength calibration, removal of the stellar and interstellar lines from the telluric standard, and the differential limb-darkening calculation. In addition, there are systematic contributions that are unrelated to data reduction procedures, including stellar variability, the changing distribution of starspots, and transits over active regions. These issues are particularly important since HD189733 is a moderately active star that is known to exhibit photometric variability due to star spots (Henry & Winn, 2007; Pont et al., 2007). Furthermore, because our dataset is comprised of many observations, spread over a year, it is important to quantify the stability of the individual observations that contribute to our in-transit and out-of-transit templates.
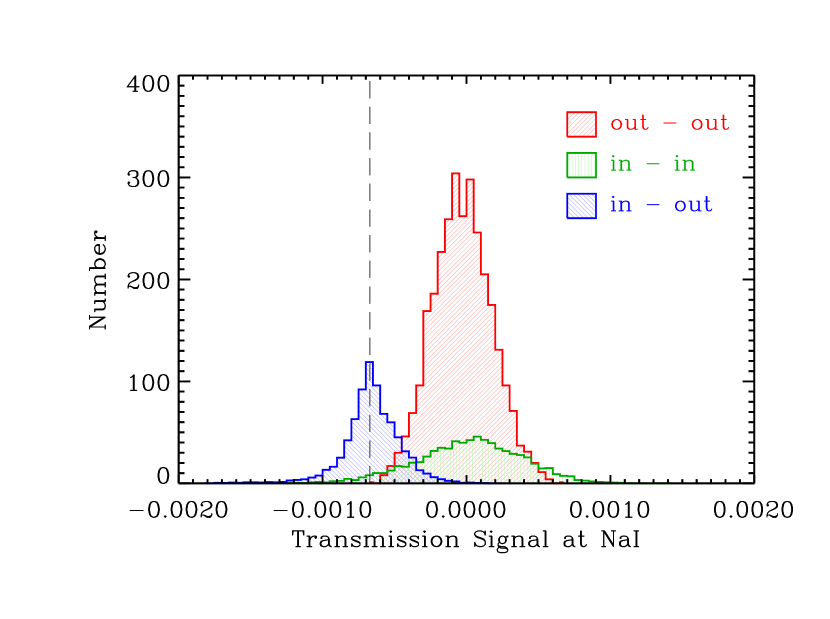
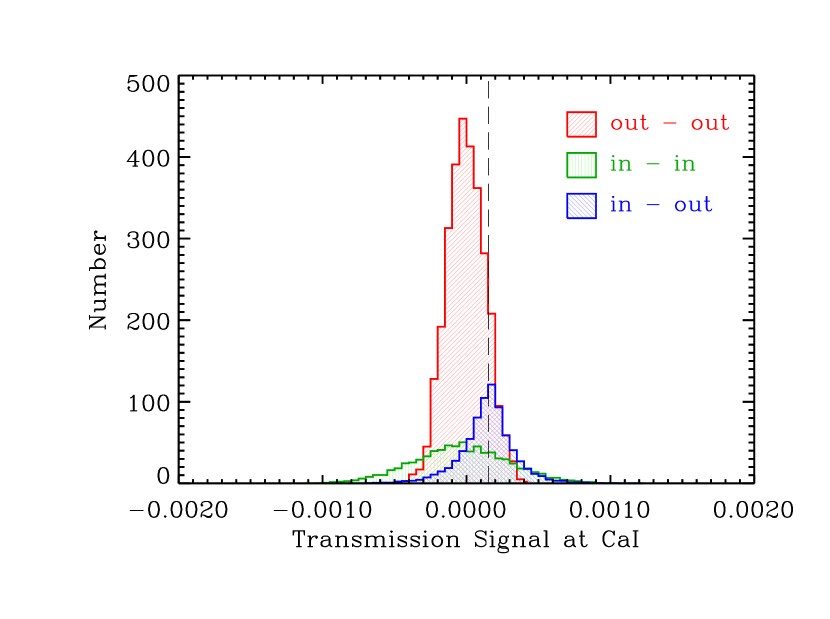
We have constructed a diagnostic that we call an empirical Monte Carlo, or bootstrapping, analysis. It involves randomly selecting from the 200 individual exposures a test sample of “in-transit” exposures, running through our entire data analysis algorithm, and measuring any signal in the transmission spectrum. We repeat this exercise thousands of times in order to establish statistical significance. Three different scenarios are explored: (1) an “out-out” comparison, where a subset of out-of-transit exposures, equal to the number of our in-transit exposures (36), is selected and compared to the rest of the out-of-transit exposures; (2) an “in-in” comparison, where a subset of in-transit exposures (8), set at the same ratio as the number of in-transit exposures to the number of out-of-transit exposures (36/165), is compared to the rest of the in-transit exposures; and (3) an “in-out” comparison, where an increasing number of in-transit exposures (up to half of the sample) is removed from the in-transit template and compared to the out-of-transit template. The distribution of the “narrow” band difference of the relative flux measurements for all realizations of the three scenarios are shown for Na I in the right panel of Figure 1 and for Ca I in Figure 2.
Both the “in-in” and “out-out” distributions are centered on zero net signal, indicating that there is no significant difference between the different out-of-transit exposures (“out-out” scenario), and no significant difference between the various in-transit exposures (“in-in” scenario). Since we have fewer in-transit exposures in order to do an “in-in” comparison, the is greatly reduced, and the distribution is much wider than the “out-out” distribution. For Na I, the mean value () of the “out-out” distribution is with a standard deviation () of , whereas the “in-in” distribution and . The results are similar for the Ca I line where for the “out-out” distribution and , and the “in-in” distribution and . The Ca I line is located more centrally on the blaze and therefore is acquired with slightly higher , which translates into a narrower distribution of measurements.
As expected, the “in-out” distributions are centered on the value we obtained from the full dataset. The width of this distribution provides a consistency check that a handful of in-transit exposures are not dominating the measurement. This demonstrates, along with the “in-in” distribution being centered at zero, that all the in-transit exposures, over 11 transits, consistently show excess absorption from the transiting exoplanetary atmosphere.
The width of the “out-out” distribution measures directly the propagation of systematic errors through our analysis. These realizations include the contribution of both reduction systematics, as well as any astrophysical systematics which are not correlated with the exoplanet orbital period. For example, if changing distributions of starspots (i.e., different phases of the stellar variability cycle) could mimic an absorption feature in the transmission spectrum, we would expect to see a significant fraction of “out-out” realizations result in such measurements. Because no such realizations are able to replicate the level of the detection, and because the orbital period is completely decoupled from the stellar variability period (Henry & Winn, 2007) such that our 11 in-transit visits are randomly distributed in stellar rotational phase, stellar variability cannot be responsible for the observed absorption in the transmission spectrum. The standard deviation of our “out-out” distribution is adopted as the appropriate 1 error for our transmission spectrum measurements since it encompasses both random and systematic errors. Our Na I absorption detection is , while the signal at Ca I is .
4 Properties of the HD189733b Atmosphere
The absorption feature in the transmission spectrum in Figure 1 is a direct measurement of the effective radius of the exoplanetary atmosphere due to the high opacity at the center of the strong Na I lines. The right axis of Figure 1 shows the magnitude of the absorption in units of exoplanetary radius. The cores of the Na I lines extend to effective radii of 1.06 .
The spectra have not been corrected for the Doppler shift of the exoplanetary absorption. During conjunction, (e.g., mid-transit), the radial velocity of the planet is 0 km s-1, although the rate of change in radial velocity is at its maximum. Over the duration of the transit, the radial velocity of HD189733b will change by 19.2 km s-1. This will cause a smearing of the absorption profile. The observed feature appears to be significantly blueshifted from the stellar line center, by 38 km s-1, and may be a combination of the planetary orbital motion and high speed winds flowing from the hot dayside, predicted by several dynamical atmospheric models (e.g., Cho et al., 2003; Cooper & Showman, 2005).
Recent infrared observations of HD209458b by Knutson et al. (2007a) show evidence for a temperature inversion in the upper atmosphere of that exoplanet. Burrows et al. (2007) presented accompanying models which require an additional absorber in the upper atmosphere of HD209458b, which could be high-altitude clouds and explain the weaker than expected Na I absorption signal in the transmission spectrum (Charbonneau et al., 2002; Fortney et al., 2003). Our measurement of strong Na I absorption argues against the presence of such clouds high in the atmosphere of HD189733b, consistent with the isothermal temperature profile presented for HD189733b (Tinetti et al., 2007).
5 Conclusions
We present the first ground-based detection of absorption in the transmission spectrum of a transiting extrasolar planet. The detection is based on the first high resolution (,000) transmission spectrum, with the Na I doublet fully resolved. The Na I transmission spectrum absorption for HD189733b, measured in a “narrow” spectral band that encompasses both lines, is . The estimated error includes both random and systematic contributions. The amount of absorption in Na I due to HD189733b is 3 larger than detected for HD209458b by Charbonneau et al. (2002), and indicates that the two exoplanets may have significantly different atmospheric properties. The excess absorption appears in a blue shifted component, while the red half of the Na I doublet lines has a net deficit of absorption during transit. Future work will include the analysis of other important optical lines (e.g., K I, H), detailed analysis of the absorption profile and comparison with atmospheric models, measurements of spectral indicators of stellar variability, and observations of other transiting systems. High resolution space-based spectroscopic observations will provide a reliable confirmation of this detection, and access to important lines in the ultraviolet. Transmission spectra do not only have the potential to probe the physical properties of hot-Jupiter and hot-Neptune exoplanets, but lay the foundation toward detailed physical diagnostics of Earth-sized extrasolar planetary atmospheres (Ehrenreich et al., 2006).
References
- Bakos et al. (2006) Bakos, G. Á., et al. 2006, ApJ, 650, 1160
- Ballester et al. (2007) Ballester, G. E., Sing, D. K., & Herbert, F. 2007, Nature, 445, 511
- Barman (2007) Barman, T. 2007, ApJ, 661, L191
- Bouchy et al. (2005) Bouchy, F., et al. 2005, A&A, 444, L15
- Bozorgnia et al. (2006) Bozorgnia, N., Fortney, J. J., McCarthy, C., Fischer, D. A., & Marcy, G. W. 2006, PASP, 118, 1252
- Brown (2001) Brown, T. M. 2001, ApJ, 553, 1006
- Brown et al. (2001) Brown, T. M., Charbonneau, D., Gilliland, R. L., Noyes, R. W., & Burrows, A. 2001, ApJ, 552, 699
- Bundy & Marcy (2000) Bundy, K. A., & Marcy, G. W. 2000, PASP, 112, 1421
- Burrows et al. (2007) Burrows, A., Hubeny, I., Budaj, J., Knutson, H., & Charbonneau, D. 2007, ApJ, in press (ArXiv: 0709.3980)
- Castelli & Kurucz (2006) Castelli, F., & Kurucz, R. L. 2006, A&A, 454, 333
- Charbonneau et al. (2002) Charbonneau, D., Brown, T. M., Noyes, R. W., & Gilliland, R. L. 2002, ApJ, 568, 377
- Cho et al. (2003) Cho, J. Y.-K., Menou, K., Hansen, B. M. S., & Seager, S. 2003, ApJ, 587, L117
- Cooper & Showman (2005) Cooper, C. S., & Showman, A. P. 2005, ApJ, 629, L45
- Deming et al. (2006) Deming, D., Harrington, J., Seager, S., & Richardson, L. J. 2006, ApJ, 644, 560
- Ehrenreich et al. (2006) Ehrenreich, D., Tinetti, G., Lecavelier Des Etangs, A., Vidal-Madjar, A., & Selsis, F. 2006, A&A, 448, 379
- Fitzpatrick & Massa (2005) Fitzpatrick, E. L., & Massa, D. 2005, AJ, 129, 1642
- Fortney et al. (2003) Fortney, J. J., Sudarsky, D., Hubeny, I., Cooper, C. S., Hubbard, W. B., Burrows, A., & Lunine, J. I. 2003, ApJ, 589, 615
- Hébrard & Lecavelier Des Etangs (2006) Hébrard, G., & Lecavelier Des Etangs, A. 2006, A&A, 445, 341
- Henry & Winn (2007) Henry, G. W., & Winn, J. N. 2007, ApJ, submitted (ArXiv: 0709.2142)
- Knutson et al. (2007a) Knutson, H. A., Charbonneau, D., Allen, L. E., Burrows, A., & Megeath, S. T. 2007a, ApJ, in press (ArXiv: 0709.3984)
- Knutson et al. (2007b) Knutson, H. A., et al. 2007b, Nature, 447, 183
- Koesterke et al. (2007) Koesterke, L., Allende Prieto, C., & Lambert, D. L. 2007, ApJ, submitted
- Moutou et al. (2001) Moutou, C., Coustenis, A., Schneider, J., St Gilles, R., Mayor, M., Queloz, D., & Kaufer, A. 2001, A&A, 371, 260
- Narita et al. (2005) Narita, N., et al. 2005, PASJ, 57, 471
- Pont et al. (2007) Pont, F., et al. 2007, A&A, submitted (ArXiv: 0707.1940)
- Ramsey et al. (1998) Ramsey, L. W., et al. 1998, in Proc. SPIE Vol. 3352, Advanced Technology Optical/IR Telescopes VI, ed. L. M. Stepp, 34
- Redfield & Linsky (2002) Redfield, S., & Linsky, J. L. 2002, ApJS, 139, 439
- Seager & Sasselov (2000) Seager, S., & Sasselov, D. D. 2000, ApJ, 537, 916
- Tinetti et al. (2007) Tinetti, G., et al. 2007, Nature, 448, 169
- Tody (1993) Tody, D. 1993, in ASP Conf. Ser. 52: Astronomical Data Analysis Software and Systems II, ed. R. J. Hanisch, R. J. V. Brissenden, & J. Barnes (San Francisco: ASP), 173
- Tull (1998) Tull, R. G. 1998, in Proc. SPIE Vol. 3355, Optical Astronomical Instrumentation, ed. S. D’Odorico, 387
- Vallerga et al. (1993) Vallerga, J. V., Vedder, P. W., Craig, N., & Welsh, B. Y. 1993, ApJ, 411, 729
- Vidal-Madjar et al. (2003) Vidal-Madjar, A., Lecavelier des Etangs, A., Désert, J.-M., Ballester, G. E., Ferlet, R., Hébrard, G., & Mayor, M. 2003, Nature, 422, 143
- Vidal-Madjar et al. (2004) Vidal-Madjar, A., et al. 2004, ApJ, 604, L69
- Welsh et al. (1991) Welsh, B. Y., Vedder, P. W., Vallerga, J. V., & Craig, N. 1991, ApJ, 381, 462
- Winn et al. (2004) Winn, J. N., Suto, Y., Turner, E. L., Narita, N., Frye, B. L., Aoki, W., Sato, B., & Yamada, T. 2004, PASJ, 56, 655
- Winn et al. (2006) Winn, J. N., et al. 2006, ApJ, 653, L69
- Winn et al. (2007) Winn, J. N., et al. 2007, AJ, 133, 1828