Recombination kinetics of a dense electron-hole plasma in strontium titanate
Abstract
We investigated the nanosecond-scale time decay of the blue-green light emitted by nominally pure SrTiO3 following the absorption of an intense picosecond laser pulse generating a high density of electron-hole pairs. Two independent components are identified in the fluorescence signal that show a different dynamics with varying excitation intensity, and which can be respectively modeled as a bimolecular and unimolecolar process. An interpretation of the observed recombination kinetics in terms of interacting electron and hole polarons is proposed.
pacs:
78.55.-m,78.47.+p,73.50.Gr,71.35.EeI Introduction
Transition-metal oxides with a perovskite-type structure form a fascinating class of materials, with an extraordinarily varied physics. Among them, SrTiO3 (STO) is a prototype material, with a simple cubic perovskite structure at room temperature. Its electrical properties appear deceptively simple: it is a band-gap insulator, with a very large dielectric constant due to the high polarizability of its ionic lattice. Mobile charges can be however added to STO by chemical doping or photon excitation, turning it into a polaronic conductorYasunaga (1968); Kéroack et al. (1984) and, at very low temperatures, even into a superconductor.Schooley et al. (1964) STO interfaces with other polar oxides have recently shown surprising transport properties,Ohtomo et al. (2002); Yamada et al. (2004) in connection with charge transfer through the interface and with polaron localization effects.Pentcheva and Pickett (2006) Even in bulk STO, the precise nature of the electron and hole polarons is still fairly unclear.Yasunaga (1968); Kéroack et al. (1984); Eagles et al. (1996); Stashans (2001); Eglitis et al. (2003); Nasu (2003); Grigorjeva et al. (2004); Yu and Nasu (2005) As for its optical properties, STO has recently gained renewed attention following the discovery of a significant blue-light photoemission from Ar+-irradiated or -doped STO samples.Kan et al. (2005, 2006) This finding, besides its interest for potential applications, adds to the rather puzzling luminescence phenomenology of this material.Grabner (1969); Aguilar and Agullo-Lopez (1982); Leonelli and Brebner (1986); Hasegawa et al. (2000); Mochizuki et al. (2005) The photoluminescence from a material is also a direct probe of the dynamics and recombination processes of its photoexcited charge carriers.
Motivated by these considerations, in this work we investigated the nanosecond-scale time-resolved fluorescence of nominally pure STO, following excitation from an intense picosecond laser pulse generating a “plasma” of electrons and holes having initial densities well above cm-3. To our knowledge, no study probing this regime was reported hitherto, for STO or any other perovskite-type oxide. To avoid any possible misunderstandings, we should however emphasize that, in this paper, we are using the term “dense plasma” in a generic sense, i.e., to indicate a system with a very large number of interacting electrons and holes that are, at least initially, freely mobile (although it is possible, in our case, that at least a fraction of them will localize a short time after being generated), regardless of the strength of their electrostatic interaction and of the clear manifestation of many-body effects. It must be also noted that photoluminescence spectroscopy in this regime, with a photogenerated carrier density much higher than impurity concentration, is likely probing mainly intrinsic properties of the material.
This article is organized as follows. Section II describes the samples and the experimental procedure. The experimental results and their modeling are reported in Section III. These results are then discussed and tentatively interpreted within a microscopic framework in Section IV. Section V contains some conclusive statements.
II Experiment
We investigated five transparent stoichiometric STO crystals produced by four different companies (all with specified impurity levels below 150 ppm), in the form of 1 mm thick plates. All measurements discussed in this paper were taken at room temperature. In our photoluminescence experiments, the excitation was induced by ultraviolet (UV) pulses having a wavelength of 355 nm, obtained as third-harmonic of the output of a mode-locked Nd:YAG laser. The corresponding excitation photon energy is 3.49 eV, well above the indirect band-gap of STO (3.26 eV) and just above its direct-transition edge (3.46 eV).Cardona (1965); Capizzi and Frova (1970) The UV pulses had a duration of 25 ps (full-width at half-maximum), a repetition rate of 10 Hz, and an energy of mJ. The UV beam was weakly focused on the sample, with a spot size of mm (radius at of the maximum). The resulting fluence in the spot-center was therefore mJ/cm2. Since at a wavelength of 355 nm the optical penetration depth is of about 1 m and the reflectance is about 25%,Cardona (1965); Capizzi and Frova (1970) the estimated peak (spot-center) energy density absorbed in the material surface layer is J/cm3. This corresponds to a peak density of photo-generated electron-hole () pairs of up to cm-3. During all our experiments, no visible photoinduced damage of the sample surfaces was induced and no irreversible variation of the signal with time was seen.
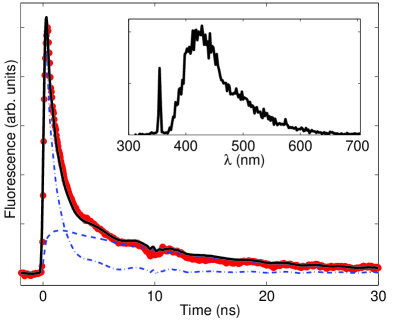
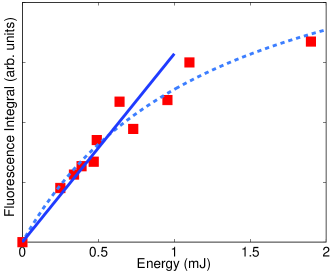
The luminescence emitted from the sample was collected by a lens system imaging the illuminated sample spot onto the detector head, after blocking the (much stronger) elastic scattering by a long-pass filter with a cutoff wavelength of 375 nm. A typical (time-integrated) luminescence spectrum is shown in the inset of Fig. 1. It peaks at 425 nm, in the blue, corresponding to 2.9 eV of photon energy, with a long tail reaching about 650 nm (1.9 eV). All samples, independent of the manufacturer, had a roughly comparable fluorescence yield, with a maximum sample-to-sample variation of 80%. The initial emission intensity was found to be even more stable, with a sample-to-sample variation below 30%. This stability is a clear indication that this luminescence is intrinsic, although a dependence on intrinsic lattice defects (i.e., not associated with impurities) cannot be excluded. Although we have not performed absolute yield measurements, the photoluminescence is clearly weak, indicating the dominance of non-radiative energy relaxation. Finally, in all samples the spectrum profile and the overall yield were found to be independent of excitation intensity, with no significant sign of saturation, up to about 1 mJ of pump pulse energies. We see instead a significant decrease of the yield above 1 mJ, as shown in Fig. 2. This extremely high saturation intensity clearly cannot be ascribed to the filling of impurity levels and therefore is a further confirmation of the intrinsic nature of this photoluminescence. This saturation might be instead related with the onset of the Auger recombination effect (we will discuss this possibility later) or with plasma electromagnetic screening effects (while we may probably exclude the contribution of absorption “bleaching”, which would increase the optical penetration length and therefore reduce the absorbed energy density, but would not reduce the overall absorbed energy and hence the luminescence emission). The estimated plasma frequency of the photogenerated carriers, assuming free electron masses for both electrons and holes, is of about Hz at the highest excitation intensities, corresponding to an electromagnetic wavelength of 500 nm. Therefore it is possible that some partial screening of the UV excitation light is taking place at these energies, thus decreasing the sample absorption efficiency. In the rest of this paper, our analysis will be mainly focused on the non-saturated energy range 0-1 mJ.
In time-resolved measurements, the luminescence was detected with a photodiode (PD) having a rise-time of about 150 ps. In most experiments the entire luminescence spectrum was integrated (with a weight given by the PD detection efficiency), but in some cases we inserted another filter in the detection line in order to select a portion of the spectrum. The PD signal was acquired by a 20 Gsample/s digital oscilloscope having an analog bandwidth of 5 GHz. With careful data analysis, taking into account the instrumental response function (see below), this set-up has a time resolution of about 100 ps. An example of a typical measured decay of the luminescence is shown in Fig. 1. The acquired signal is actually the result of a convolution between the real luminescence decay and the detection-system response function , where denotes time. The response function was measured by detecting the elastic-scattered light of the excitation pulse. Once and are known, the actual decay may in principle be calculated by a deconvolution procedure. However, in order to avoid the typical problems associated with numerical deconvolutions of data, we prefer here to compare the unprocessed raw signals with the theoretical luminescence decays convoluted with .
III Results and analysis
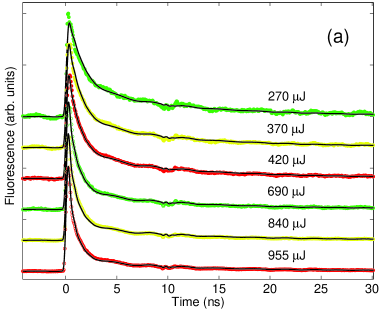
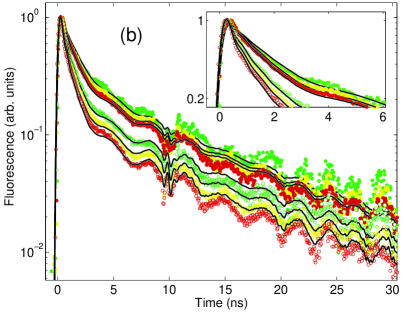
When varying the excitation intensity, the measured decay profile changes markedly, as shown in Fig. 3. In particular, the initial decay becomes clearly faster for higher excitation intensities (see also the inset in Fig. 3b), while the slower “tail” changes only its amplitude, but not its decay rate. This dependence on excitation intensity excludes an interpretation as a simple “unimolecular” exponential decay (UD) process and implies that particle correlations are relevant. A “bimolecular” non-exponential decay (BD) naturally arises from a model in which holes and electrons (or the corresponding polarons) have a “partner-capture” probability per unit time that is proportional to the density of partners, and this capture event is also the rate-limiting step for recombination (i.e., it may correspond either to a direct recombination or to a recombination via an intermediate short-lived state). Labeling with the (equal) density of photo-generated electrons and holes, the simplest “pure BD” model is described by the following rate equation
| (1) |
where is a constant. For excitation pulse energies below the saturation level, the initial condition to be associated to this equation is , where is the excitation energy density and is a constant. We tried this model and found that it provides an excellent fit to the energy dependence of the initial faster decay but cannot account for the slower tail. An obvious extension of the model is then to introduce also a UD contribution in the decay. A unimolecular recombination arises when there is decay channel in which the rate-limiting step is the annihilation of bound pairs, while the binding dynamics is much faster. There are different ways of combining UD and BD processes together, and we tried some of the simplest possibilities (see below). The model that gave the best results is based on the assumption that there is a very rapid initial branching of the charge carrier populations into two separate non-communicating channels, respectively decaying with a UD and BD law. In other words, we assume that, immediately after the UV excitation, two separate charge-carrier populations of electrons and holes are formed, with densities and (hole and electron densities remain equal in each population). We further assume that this initial separation has a fixed branching ratio, so that, for any excitation energy density , at time we have and , with and constants (this is valid only for excitation energies below the saturation level). Next, we assume that is governed by a standard UD rate equation, , where is an intensity-independent characteristic decay time. For we assume that Eq. (1) remains valid. Finally we introduce two different fluorescence quantum yields and for the two channels. This model leads to the following predicted luminescence decay:
| (2) |
where we have introduced the UD and BD amplitude coefficients
| (3) |
and the (excitation-energy dependent) characteristic BD time . Expression (2) (after convolution with the response function) provides an excellent fit to the data, as shown for example in Fig. 1, where the UD and BD terms are also drawn separately. Further validation of our model was obtained by requiring that Eq. (2) should successfully fit the whole data set collected as a function of excitation energy, with a single choice of the adjustable parameters and . We note that such parameters determine the BD and UD decay times for each given excitation energy , and are therefore independently constrained by each single decay. The excellent fits reported in Fig. 3 demonstrate that and , corresponding in our model to material properties, are indeed independent of excitation energy, thus providing a strong confirmation of our model validity. This same global fit procedure allowed to rule out alternative models.
Besides the successful model, we tried the following alternative ones: (i) a pure BD equation such as Eq. (1), but acting on unbalanced electron-hole populations (e.g., ), as could arise due to trapping or impurity doping; (ii) a balanced undivided population of electrons and holes obeying the single rate equation . The first model cannot fit the single decay. The second can fit the single decay, but not the whole set.
Moreover, we tested a model in which a trimolecular-decay process of the kind , such as the Auger effect, takes place in the initial stage of the decay, but found that it could not fit the observed excitation-energy dependence. Since the Auger effect is entirely non-radiative, its presence should also result in a saturated quantum yield versus excitation intensity, which in our case starts to appear only above about 1 mJ of excitation energy. We may conclude that the role of Auger effect is negligible in our experiments, at least for pulse energies below 1 mJ. This result allows us to set the following approximate upper limit for the Auger recombination coefficient: cm6s-1. This value is two-three orders of magnitude smaller than the typical values of the Auger coefficient found in indirect semiconductors, such as germanium or silicon.Zarrabi et al. (1985); Linnros (1998) The reason is probably the larger band gap of STO, as the Auger recombination coefficient is known to decrease exponentially with increasing gap width.Massé et al. (2007)
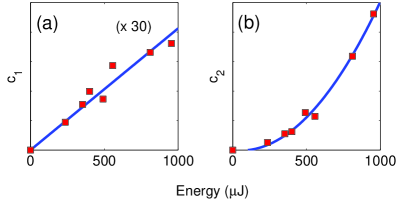
In our BD+UD model, the best-fit values of were found to range from 5 to 10 s-1cm3/J, depending on the sample (corresponding to a BD time ps for a UV pulse energy of 1 mJ). Since the ratio is unknown, we cannot determine the value of from this result. However, a plausible order-of-magnitude estimate is obtained by assuming a balanced branching ratio , which yields cm3s-1 (by a similar reasoning, we can set the following, well defined, lower limit: cm3s-1). This value is two-three orders of magnitude larger than the bimolecular coefficient for indirect-gap semiconductors such as silicon, usually ascribed to phonon-assisted radiative and defect-assisted Auger recombination processes,Linnros (1998) but it is about one-two orders of magnitude smaller than the value found in direct band-gap semiconductors.Zarrabi et al. (1985); Juršėnas et al. (1996) The best-fit values of ranged from 11 to 24 ns. The coefficients and giving the initial amplitude of the UD and BD terms in the luminescence were adjusted separately for each excitation energy. The resulting best-fit values are shown in Fig. 4, where the energy dependence predicted by Eqs. (3) is seen to be well verified in the non-saturated regime. Besides further confirming the validity of our model, this shows that both decay channels are non-saturated in this energy range. For higher energies, we observe the onset of saturation in both channels (data not shown). The measured yield ratio of the BD to UD channels is of , with 20% sample-to-sample variations but independent of excitation intensity, within our experimental uncertainties.
Finally, we tried to resolve possible spectral differences between our UD and BD processes by inserting additional filters in the detection line and checking for variations in the relative yields or decay times of UD and BD components. In particular we used a bandpass filter for the range 390-480 nm, which therefore selects only the blue section of the spectrum, and a long-pass filter with a cutoff wavelength at 495 nm, selecting only the green tail of the spectrum. In both cases, no significant changes were found, indicating that the emission spectra of UD and BD processes are largely overlapping.
IV Discussion
Let us now discuss the possible underlying nature of the UD and BD contributions seen in our data. We start from the consideration that the small photoluminescence absolute yield implies that most electron-hole recombination processes occurring in STO are non-radiative, i.e., the radiative transitions that give rise to the luminescence represent only a small fraction of the total. This in turn implies that for a given homogeneous population of excited electrons and holes in STO, the photo-luminescence signal kinetics is mainly controlled by non-radiative decay channels, regardless of the fact that it is actually detected through the radiative ones. On the other hand, the spectrum of the photoluminescence characterizes only the radiative processes. Therefore, one must be careful when trying to fit kinetic and spectral pieces of evidence in a single scenario, as they are likely associated with distinct physical processes.
As we mentioned in the introduction, charge carriers in STO are believed to have a polaronic nature, owing to the strong polarizability of the STO ionic lattice. Electron carriers in STO are very mobile, especially at low temperatures, as expected from large polarons,Yasunaga (1968); Kéroack et al. (1984); Itoh et al. (2006); Thiel et al. (2006) although there is some evidence that localized small polarons also exist in the system.Eagles et al. (1996); Hasegawa and Tanaka (2001); Yu and Nasu (2005) The intrinsic mobility of hole polarons is unknown, as at low densities STO holes are usually trapped in mid-gap impurities. Therefore the observed BD kinetics is to be probably ascribed to the direct non-radiative recombination of conduction-band electrons and valence-band holes, with at least one of the two species remaining mobile and delocalized. This recombination process may be either phonon- or defect-assisted. We emphasize that the intrinsic BD behavior of the STO luminescence reported here is quite different from that reported in the past.Leonelli and Brebner (1986); Hasegawa et al. (2000) The latter occurs on a much longer (s-to-ms) time-scale and at much smaller charge-carrier densities and is usually ascribed to carrier trapping-untrapping processes, dominated by extrinsic effects.footnote2
Focusing now on the radiative processes involved in the BD signal, we must ask ourselves why the luminescence spectrum peak is red-shifted by about 0.35 eV with respect to the (indirect) band-gap (Stokes’ shift) and why the luminescence band extends down to more than 1 eV below the excitation energy. Both energies are far too large to be associated with the emission of a single phonon in a phonon-assisted inter-band recombination process (the highest-energy phonon in STO has an energy of about 0.1 eV). Midgap impurities also cannot be invoked to explain this energy shift, as the number of estimated pairs well above cm-3 exceeds by orders of magnitude the impurity density, so that the impurity emission would be saturated, in contrast to our results. Furthermore, the expected sample-to-sample yield fluctuation would be much larger. If small polarons are indeed formed in STO, the involved lattice relaxation could instead account for the 0.35 eV Stokes shift of the blue luminescence peak.Yu and Nasu (2005) However, intrinsic lattice defects such as oxygen vacancies or dislocations may also play an important role in the radiative processes, either by introducing mid-gap electronic states or by locally enhancing the polarizability of the lattice, thus allowing the polaron-like self-localization of charge carriers.
To account for the UD contribution, we must assume that a fraction of photo-generated carriers is rapidly converted into bound pairs of electrons and holes, which then decay more slowly with the characteristic lifetime of the bound pair. Due to the indirect nature of the gap, pair binding is difficult unless localization takes place. Again, it is not understood whether this localization is a purely intrinsic phenomenon or it is somehow defect-assisted, although the latter hypothesis seems more plausible, as we find significant sample-to-sample fluctuations in the UD component yield and lifetime . If lattice deformation is instrumental in the localization (both in the perfect crystal or close to a defect), the localized bound pair may be identified with the so-called “self-trapped vibronic exciton” (STVE).Eglitis et al. (2003); Nasu (2003); Grigorjeva et al. (2004); Vikhnin et al. (2002) STVE has been often invoked in the literature to explain the strong luminescent emission peaking in the green (at 2.4 eV) seen from STO at low temperature (below 40 K),Grabner (1969); Aguilar and Agullo-Lopez (1982); Leonelli and Brebner (1986); Hasegawa et al. (2000); Kan et al. (2005), although this interpretation has been recently criticized.Mochizuki et al. (2005, 2006) In our case, since the spectrum of the UD component seems roughly similar to the total spectrum, the STVE should be associated with an emission peaking in the blue, as was also recently proposed for the case of electron-induced luminescence in STO.Grigorjeva et al. (2004)
V Conclusions
Summarizing, the time-resolved luminescence decay observed from STO under intense pulsed UV excitation is well explained by a model that assumes the presence of two separate decay channels, one associated with a direct recombination of unbound mobile electron-hole charge carriers and the other with the recombination of bound electron-hole pairs. The exact nature of the microscopic recombination processes taking place in this system remains uncertain, although the polaronic character of the charge carriers and the presence of intrinsic crystal defects are both likely ingredients of a future understanding. Our experiment also demonstrates the possibility of probing this photoinduced high charge-density regime without damaging the sample, thus opening the way to several other possible investigations of this interesting regime, which may eventually help us clarifying the exact nature of the charge carriers occurring in these ever-surprising materials.
Acknowledgements.
We thank F. Ciccullo for assistance in some experimental runs.References
- Yasunaga (1968) H. Yasunaga, J. Phys. Soc. Japan 24, 1035 (1968).
- Kéroack et al. (1984) D. Kéroack, Y. Lépine, and J. L. Brebner, J. Phys. C: Solid State Phys. 17, 833 (1984).
- Schooley et al. (1964) J. F. Schooley, W. R. Hosler, and M. L. Cohen, Phys. Rev. Lett. 12, 474 (1964).
- Ohtomo et al. (2002) A. Ohtomo, D. A. Muller, J. L. Grazul, and H. Y. Hwang, Nature (London) 419, 378 (2002).
- Yamada et al. (2004) H. Yamada, Y. Ogawa, Y. Ishii, H. Sato, M. Kawasaki, H. Akoh, and Y. Tokura, Science 305, 646 (2004).
- Pentcheva and Pickett (2006) R. Pentcheva and W. E. Pickett, Phys. Rev. B 74, 035112 (2006).
- Eagles et al. (1996) D. M. Eagles, M. Georgiev, and P. C. Petrova, Phys. Rev. B 54, 22 (1996).
- Stashans (2001) A. Stashans, Materials Chem. and Phys. 68, 124 (2001).
- Eglitis et al. (2003) R. I. Eglitis, E. A. Kotomin, G. Borstel, S. E. Kapphan, and V. S. Vikhnin, Computat. Mater. Sci. 27, 81 (2003).
- Nasu (2003) K. Nasu, Phys. Rev. B 67, 174111 (2003).
- Grigorjeva et al. (2004) L. Grigorjeva, D. Millers, V. Trepakov, and S. Kapphan, Ferroelectrics 304, 947 (2004).
- Yu and Nasu (2005) Q. Yu and K. Nasu, J. Physics: Conference Series 21, 1 (2005).
- Kan et al. (2005) D. Kan, T. Terashima, R. Kanda, A. Masuno, K. Tanaka, S. Chu, H. Kan, A. Ishizumi, Y. Kanemitsu, Y. Shimakawa, et al., Nat. Mater. 4, 816 (2005).
- Kan et al. (2006) D. Kan, R. Kanda, Y. Kanemitsu, Y. Shimakawa, M. Takano, T. Terashima, and A. Ishizumi, Appl. Phys. Lett. 88, 191916 (2006).
- Grabner (1969) L. Grabner, Phys. Rev. 177, 1315 (1969).
- Aguilar and Agullo-Lopez (1982) M. Aguilar and F. Agullo-Lopez, J. Appl. Phys. 53, 9009 (1982).
- Leonelli and Brebner (1986) R. Leonelli and J. L. Brebner, Phys. Rev. B 33, 8649 (1986).
- Hasegawa et al. (2000) T. Hasegawa, M. Shirai, and K. Tanaka, J. Luminescence 87-89, 1217 (2000).
- Mochizuki et al. (2005) S. Mochizuki, F. Fujishiro, and S. Minami, J. Phys. Cond. Matt. 17, 923 (2005).
- Cardona (1965) M. Cardona, Phys. Rev. 140, A651 (1965).
- Capizzi and Frova (1970) M. Capizzi and A. Frova, Phys. Rev. Lett. 25, 1298 (1970).
- Zarrabi et al. (1985) H. J. Zarrabi, W. B. Wang, and R. R. Alfano, Appl. Phys. Lett. 46, 513 (1985).
- Linnros (1998) J. Linnros, J. Appl. Phys. 84, 275 (1998).
- Massé et al. (2007) N. F. Massé, A. R. Adams, and S. J. Sweeney, Appl. Phys. Lett. 90, 161113 (2007).
- Juršėnas et al. (1996) S. Juršėnas, G. Kurilčik, and A. Žukauskas, Phys. Rev. B 54, 16706 (1996).
- Itoh et al. (2006) C. Itoh, M. Sasabe, H. Kida, and K. i Kan’no, J. Luminescence 112, 263 (2006).
- Thiel et al. (2006) S. Thiel, G. Hammerl, A. Schmehl, C. W. Schneider, and J. Mannhart, Science 313, 1942 (2006).
- Hasegawa and Tanaka (2001) T. Hasegawa and K. Tanaka, J. Luminescence 94-95, 15 (2001).
- (29) It cannot be excluded, but seems unlikely, that the two phenomena would merge after taking into account the temperature behavior. Our preliminary measurements of this behavior do not show a significant increase of the BD times down to 90 K. Moreover, the blue-peaked luminescence we are studying in this work corresponds to the “A band” reported in Ref. Mochizuki et al., 2005, where it is shown to decay faster than 50 ns down to 13 K.
- Vikhnin et al. (2002) V. S. Vikhnin, R. I. Eglitis, S. E. Kapphan, G. Borstel, and E. A. Kotomin, Phys. Rev. B 65, 104304 (2002).
- Mochizuki et al. (2006) S. Mochizuki, F. Fujishiro, K. Ishiwata, and K. Shibata, Physica B 376-377, 816 (2006).