Galaxy Mergers at in the HUDF: Evidence for a Peak in the Major Merger Rate of Massive Galaxies111Based on observations made with the NASA/ESA Hubble Space Telescope, obtained from the Data Archive at the Space Telescope Science Institute, which is operated by the Association of Universities for Research in Astronomy, Inc., under NASA contract NAS 5-26555.
Abstract
We present a measurement of the galaxy merger fraction and number density from observations in the Hubble Ultra Deep Field for . We fit the combination of broadband data and slitless spectroscopy of 1308 galaxies with stellar population synthesis models to select merging systems based on stellar mass of M⊙. When correcting for mass incompleteness, the major merger fraction is not simply proportional to , but appears to peak at . From this merger fraction, we infer that % of massive galaxies have undergone a major merger since . We show that the major merger number density peaks at , which marks the epoch where major merging of massive galaxies is most prevalent. This critical redshift is comparable to the peak of the cosmic star formation rate density, and occurs roughly Gyr earlier in cosmic time than the peak in the number density of the -ray selected active galactic nuclei. These observations support an indirect evolutionary link between merging, starburst, and active galaxies.
Subject headings:
galaxies: evolution — galaxies: formation — galaxies: interaction1. Introduction
The hierarchical formation scenario suggests that galaxy merging is the driving mechanism in galaxy formation (eg. White & Frenk, 1991; Kauffmann, White, & Guiderdoni, 1993). Since galaxy merging has been linked to numerous astrophysical processes, including star formation and the fueling of a supermassive black hole (SMBH), which triggers an active galactic nucleus (AGN), the merger history of galaxies is critical for a complete understanding of galaxy evolution.
The redshift evolution of the galaxy merger fraction has been well studied for , and is roughly proportional to , where typically (Zepf & Koo, 1989; Burkey et al., 1994; Carlberg, Pritchet, & Infante, 1994; Yee & Ellingson, 1995; Neuschaefer et al., 1997; Patton et al., 1997; Le Fèvre et al., 2000; Patton et al., 2002; Lin et al., 2004; Xu, Sun, & He, 2004; Bell et al., 2006; Kartaltepe et al., 2007). Toomre (1977) predicted the galaxy pair fraction to be proportional to the matter space density at low redshift, and Carlberg (1991) refined this idea to show that the power-law index should be somewhat sensitive to the Cosmological Constant. Based on -body simulations, Berrier et al. (2006) argue that while the galaxy merger rate per halo is increasing with redshift, the number of halos massive enough to host a galaxy pair is decreasing. This balance will result in a flattening of the high redshift pair counts consistent with some high redshift observations (eg. Lin et al., 2004). Fakhouri & Ma (2007) suggest that this power-law form is a particular representation of a universal merger rate which scales as a power-law with the progenitor mass ratio and depends only weakly on the halo mass. Additionally, (Conselice, 2006) have suggested that the merger fraction may peak at some critical redshift. However, until now there have been very few observational studies for to constrain the redshift of this possible peak, and hence the detailed physics of the galaxy merging at high redshift is still uncertain.
The standard hierarchical formation model has been modified to incorporate the feedback effects of a central SMBH (eg. Silk & Rees, 1998). Hydrodynamical simulations have suggested that as galaxies merge, they evolve into a starburst system, and a substantial amount of gas is eventually funneled onto their SMBHs. This triggers a visible AGN typically 1–2 Gyr after the onset of the merger (Springel, Di Matteo, & Hernquist, 2005). While previous authors have discussed an evolutionary link between mergers and starburst galaxies (eg. Larson & Tinsley, 1978; Sanders & Mirabel, 1996; Bell et al., 2005), this “duty cycle” of merging, followed by a starburst, followed by an AGN, has only recently been suggested (Hopkins et al., 2006). This formation scheme implies that we should observe similarities in the redshift evolution of merging galaxies, their star formation history (eg. Madau et al., 1996), the mass assembly in galaxies (eg. Dickinson et al., 2003), their AGN activity (eg. Ueda et al., 2003; Hasinger, Miyaji, & Schmidt, 2005; Schneider et al., 2005), and resulting galaxy morphologies (eg. Driver et al., 1995; Abraham et al., 1996). Since these other phenomena have been well studied at , we desire corresponding measurements of galaxy merging at comparable redshifts, which is the focus of this work.
While there may be some convergence on the theoretical front, there is little consensus regarding the observational connections between merging and active galaxies. In general, AGN host galaxies do not exhibit strong merger-type morphologies (eg. Bahcall et al., 1997; Cohen et al., 2006; Guyon, Sanders, & Stockton, 2006) or show enhanced image asymmetry (Grogin et al., 2005). Conversely, Canalizo et al. (2007) find evidence for recent merger activity in the quasar host galaxy, MC2 1635+119, which was previously classified as an undisturbed elliptical galaxy. Some of this disagreement may be resolved in the context of the above “duty cycle,” wherein the morphological indications of the recent merger have subsided by the time the AGN is observationally identified. This debate will surely continue owing, in part, to the difficulties interpreting morphological studies (eg. de Propris et al., 2007).
This work is organized as follows: In § 2 we describe the dataset and the mass estimates, § 3 we outline our merger selection, § 4 we measure the merger fraction and number density, § 5 we compare this study to published work, and conclude with a general discussion of the result in the context of galaxy evolution in § 6. We adopt the three-year results from the Wilkinson Microwave Anisotropy Probe (Spergel et al., 2007), where , , and km s-1 Mpc-1 with . All magnitudes quoted herein are in the AB system (Oke & Gunn, 1983).
2. Data
The deep fields observed by the Hubble Space Telescope (HST) provide an unprecedented view of the distant universe (), and are therefore the ideal datasets for studying the high redshift evolution of the galaxy merger rate. The GRism ACS Program for Extragalactic Science (GRAPES; Pirzkal et al., 2004) has provided low-resolution () spectroscopy of 1400 objects with mag in the Hubble Ultra Deep Field (HUDF; Beckwith et al., 2006). From these data, Ryan et al. (2007) computed spectrophotometric redshifts for 1308 galaxies at . When the Balmer or 4000 Å break occurs in these optical spectra (for ), the standard deviation in is 0.037, and it is only 0.050 for , which make these among the most accurate photometric redshifts computed using the standard maximum-likelihood technique (Bolzonella, Miralles, & Pelló, 2000) to date.
Since the primary aim of this work is to measure the high redshift evolution of the galaxy merger rate, we require a set of criteria to select our merger candidates. While this has traditionally been performed using the rest-frame luminosity, we will select our systems based on their mass. Ideally, we desire their total gravitational mass, since it is expected to drive galaxy merging (eg. Khochfar & Burkert, 2001). However, since this mass is exceedingly difficult to determine for a large sample of faint galaxies, we will adopt the stellar mass as our selection quantity.
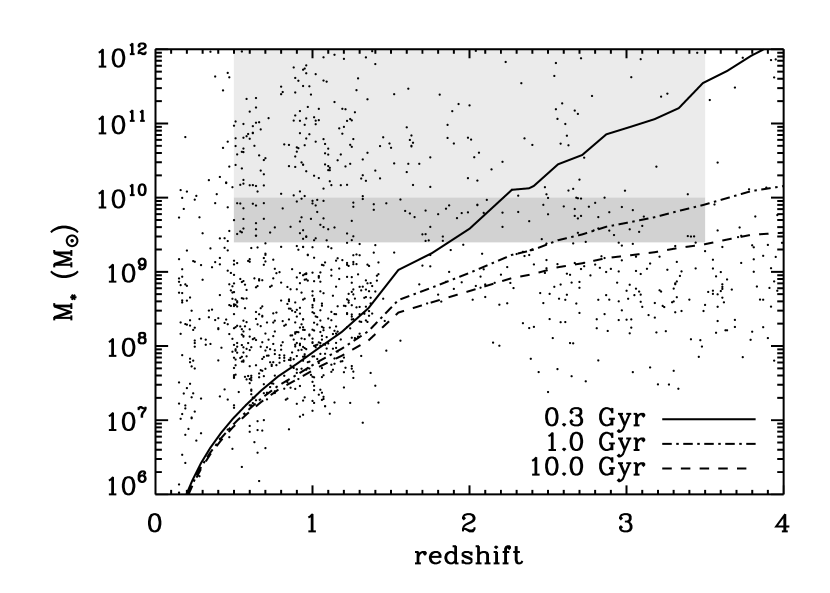
To determine the required stellar masses of our sample, we fit the combination of GRAPES spectra and broadband observations in the -, -, and -bands with a grid of stellar population synthesis models (Bruzual & Charlot, 2003, BC03 hereafter). The masses are determined by minimizing the reduced between the spectrophotometry and these models, following the method of Papovich, Dickinson, & Ferguson (2001). By parameterizing the star formation history of these galaxies as , our model grid consists of three parameters: the extinction in the restframe -band, the -folding time in the star formation history, and stellar population age. If we assume a Salpeter initial mass function (Salpeter, 1955) and solar metallicity, then the parameter space consists of independent models. By varying the values of the grid points, we estimate the uncertainty on the stellar masses to be %. In 1, we show the stellar mass as a function of redshift for these galaxies. The different tracks show the mass of a maximally old stellar population for the various values of listed in the lower-right corner. The shaded region shows the mass selection for the primary galaxies, which is % complete for mag. The darker area indicates the selection region for the lower mass companion galaxies to be discussed below.
3. Identification of Merging Galaxies
Since we have reasonable redshift information for the entire sample of galaxies, it is natural that we adopt the dynamically close pair method (eg. Carlberg, Pritchet, & Infante, 1994). However, since our redshift uncertainty is roughly a factor of larger than that of a traditional spectroscopic survey, our approach will be somewhat akin to the more common pair count analysis (eg. Zepf & Koo, 1989). This technique has several key virtues not present in other approaches: it has simple and well understood statistics to compute (Abraham, 1999) and does not rely on calibration datasets (de Propris et al., 2007). Patton et al. (2000, P2000 hereafter) demonstrate that the galaxy merger rate () can be computed from the galaxy merger or pair fraction () and the galaxy number density () as , where is the typical merger timescale.
3.1. Pair Criteria
Using the redshift catalog of Ryan et al. (2007), we require the following four criteria to be satisfied to identify a galaxy pair as a merger system: (1) at least one neighboring galaxy 20 kpc away to ensure that close galaxy pairs will merge (eg. de Propris et al., 2005; Bell et al., 2006) on a timescale Gyr (eg. Khochfar & Burkert, 2001; Patton et al., 2002); (2) we require the mass ratio of primary galaxy to the putative companion to be , which is consistent with a flux ratio between the galaxies of mag; (3) we require the stellar mass of the primary galaxy to be M⊙; and (4) we require the redshifts of the primary and the companion to agree within the 95% confidence interval of the spectrophotometric redshifts of Ryan et al. (2007).
3.2. Accounting for the Flux and Mass Limit
While the GRAPES survey is complete to very faint flux levels (see 2), we may expect it to be volume-limited at high redshift and that no corrections to the pair statistics are needed. To investigate this notion, we show the absolute -band magnitude as a function of the spectrophotometric redshift in 3 where the solid line shows our flux limit of mag for a flat spectrum in following Driver (1999). While this figure shows the expected volume-limited behavior (eg. de Propris et al., 2005), there is a more subtle question to address since this is a mass-selected sample: Is there a population of galaxies which are fainter than our flux limit and more massive than our mass limit? If such a population exists, then our mass selection would be incomplete in these galaxies (Dickinson et al., 2003). At the redshifts of interest, such objects must have a relatively high stellar mass-to-light ratio ( M⊙ L) and therefore be very red in the HST images.


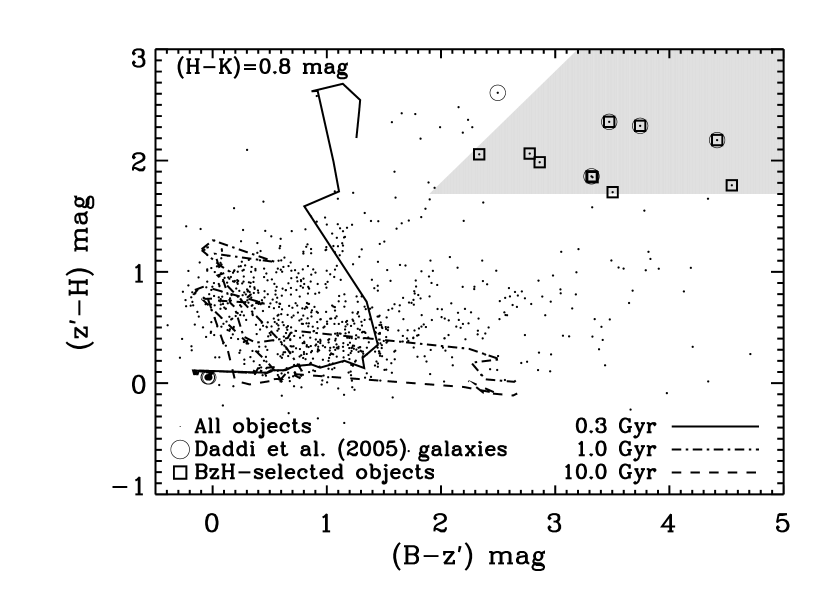
To find these dark, red galaxies at , Daddi et al. (2004) have developed a technique based on the observed and colors (the method). When this is applied to the HUDF, Daddi et al. (2005) identify only seven old, passively-evolving galaxies with mag. They argue that these systems must have been formed in a quick burst ( Gyr), since they emit little restframe, ultraviolet flux. While these objects meet the above mass-to-light criteria, they are brighter than our flux limit and are included in our redshift survey. Therefore, to estimate the number of galaxies satisfying this mass-to-light criterion and are fainter than our flux limit, we must perform a similar analysis on deeper data. Since there is no sufficiently deep -band imaging in the HUDF, we must use the NICMOS imaging in the -band (Thompson et al., 2005) and assume that these galaxies typically have mag (Förster Schreiber et al., 2004). In 4, we show the corresponding color-color space for the selection for the objects in the NICMOS imaging with fluxes from Coe et al. (2006). The shaded polygon shows the selection region defined by mag and mag. The open squares represent all objects satisfying these criteria while the open circles show the five objects of Daddi et al. (2005) which are in this portion of the HUDF. As in 1, the various tracks show BC03 stellar population models as indicated in the lower-left. Since we recover 4/5 objects from Daddi et al. (2005), we conclude that this is a viable method to find the maximally old, passively-evolving galaxies which satisfy the mass-to-light requirement. There are only 9 galaxies (or 1% of all objects with mag) which are expected to be burst-type systems (or a Gyr; Daddi et al., 2005). However, the abundance of galaxies with masses and colors comparable to the maximally old, passively-evolving models with Gyr in 1 and 4 suggests that corrections to the pair statistics are necessary.
To correct the observed pair counts, we will adopt the method of P2000, and for brevity only highlight our modifications for the mass-selection and give the essential details. In the P2000 method, one computes the maximal -correction from a set of galaxy SED templates to derive the low luminosity limit when selecting objects based on absolute magnitudes (see Figures 1 and 2 from Patton et al., 2002). However, since we select candidates based on their stellar mass, we must determine the corresponding maximal mass limit. While Patton et al. (2002) adopt the empirical templates of Coleman, Wu, & Weedman (1980), we choose the stellar population synthesis models of BC03. As in § 2, we parameterize the star formation rate as and restrict Gyr, since objects with Gyr are extremely rare (as discussed above). Since the aim is to generate a population of maximal stellar mass, we set , where is the age of the Universe at redshift .
We define the stellar mass limit to be the more massive between the fiducial limit () and the maximal mass model ():
| (1) |
With this mass selection, we compute the selection function to correct the counts of the flux-limited survey as
| (2) |
where is the galaxy mass function (not to be confused with the luminosity function). Elsner, Feulner, & Hopp (2007) show that the galaxy mass function can be well modeled as the Schechter function (Schechter, 1976) with M⊙ and for . Finally, the optimal weights to apply to the pair statistics will be , where the various remaining terms (such as boundary effects and spectroscopic completeness) are computed following Patton et al. (2002). Using these optimal weights, the number of close companions for the th primary galaxy is computed as , where runs over the companions which satisfy the above merger criteria. Finally, the mean number of close companions per primary galaxy is found as
| (3) |
following the notation of Patton et al. (2002).
3.3. Error Budget
While it may be appropriate to assume Poisson uncertainties on the pair counts, we require a more detailed analysis to incorporate the effects of the redshift uncertainties. Despite having redshifts for each component of the merging pair, the relatively large uncertainties on the proper distance ( Mpc) can lead to false positives. To estimate the magnitude of this effect, we randomize the redshifts and masses in such a manner to preserve the selection discussed above and recompute the pair counts. In realizations of the redshift catalog, we estimate that pairs per redshift bin may arise from superpositions identified by erroneous redshifts. This approach allows us to bootstrap the uncertainties on the pair counts to include the effects of Poisson shot noise, chance superpositions, and redshift uncertainties.
Since the HUDF covers , the uncertainties resulting from cosmic variance must also be addressed. By assuming the correlation function of the galaxies is , then the relative cosmic variance in the number counts is given as for cell volume , correlation length , and (Somerville et al., 2004). For comparable sampled volumes, Beckwith et al. (2006) estimate the cosmic variance to be for the HUDF cell geometry.
4. Redshift Evolution
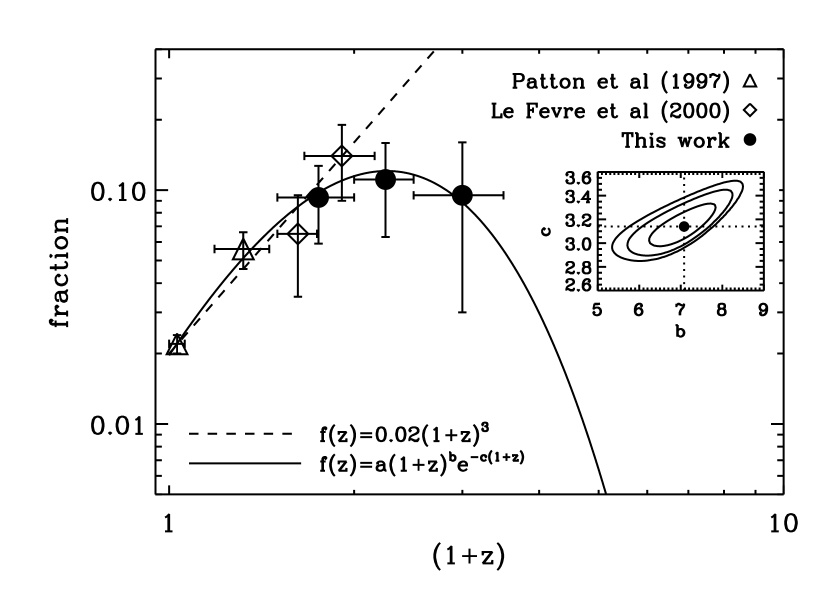
In 5, we show the resulting galaxy merger fraction as a function of as filled circles with uncertainties that reflect the contributions from chance superpositions, cosmic variance, redshift uncertainty, and Poisson shot noise. Since these galaxies are typically very young (an age Myr as inferred from the SED fitting described in § 2), their median stellar mass-to-light ratio in the restframe -band is M⊙ L, and therefore the mass limit of M⊙ roughly corresponds to mag. Since this luminosity limit is similar to that imposed by Patton et al. (1997) and Le Fèvre et al. (2000), we show those measurements for comparison as open triangles and diamonds, respectively. We show a standard parameterization of as a dashed line. While this model can fit the low redshift () observations, it fails to reproduce our higher redshift () data. Therefore, we also show the empirical formed proposed by Conselice (2006) of
| (4) |
as a solid line. Using a standard least-squares technique, we find , , and for . This model has a maximum at , when accounting for the correlated uncertainties on and . In the inset, we show the 68%, 95%, and 99% confidence intervals in the - plane for the fit to these data. The peak in the fraction is likely a consequence of the strict mass limit and mass ratio imposed, and not a result of flux incompleteness (see 1). Our observations can rule out the standard power-law model which has a reduced .
While the merger fraction may provide excellent information on galaxy evolution, the galaxy merger number density is more relevant when comparing to other extragalactic observations. From the merger fraction (), we compute the merger number density as
| (5) |
where is the completeness corrected redshift distribution from the Ryan et al. (2007) catalog. Then the merger rate is (P2000). In 6, we show the merger number density for the same data as discussed in 5. As a solid line, we show empirical model of equation (4), converted to a number density using the redshift distribution of equation (23) in Benítez (2000). The merger number density peaks at a , which is a slightly lower redshift than the peak in the merger fraction. Finally, we tabulate our measured galaxy merger fraction and number density in Table 1.

| $\dagger$$\dagger$Computed from the merger fraction by equation (5). | ||
|---|---|---|
| (10-4 Mpc-3) | ||
| 0.750.25 | 0.090.03 | 6.312.34 |
| 1.250.25 | 0.110.04 | 3.561.52 |
| 2.000.50 | 0.090.06 | 2.041.39 |
5. Comparison to Previous Work
For low to moderate redshifts (), there have been numerous measurements of the galaxy pair fraction. While many studies disagree on the precise values of the pair fraction, they generally agree that the fraction rises from % at to % at as a power-law in . Where our observations overlap with previous work, we find a merger fraction of % at , which is in good agreement with published values (eg. Le Fèvre et al., 2000; Lin et al., 2004; Kartaltepe et al., 2007). At higher redshift (), there are no other studies of merging using the pair fraction, due to the difficulty in acquiring sufficiently deep redshift datasets. However, if the redshift of the primary galaxy can be obtained, then a morphological approach can be a viable method for determining the merger status. Conselice et al. (2003) has shown a roughly power-law form to using the (concentration, asymmetry, clumpiness) morphological system (Bershady, Jangren, & Conselice, 2000; Conselice, 2003). When these measurements are coupled with restframe colors, the refined merger fraction is substantially higher than our observations (Conselice, 2006). However, de Propris et al. (2007) discuss some of the limitations of this system and caution that merger studies using image asymmetry require careful interpretation. Based on the matched Two Micron All Sky Survey (2MASS)/Two-Degree Field Galaxy Redshift Survey (2dFGRS; Cole et al., 2001), Xu, Sun, & He (2004) identify 38 merging systems with similar close pair criteria at . By adopting a standard stellar mass-to-light ratio in the restframe -band ( M⊙ L), these galaxies are selected to have M⊙. While they restricted their work to a smaller range of mass ratios for their systems ( mag), they find a pair fraction of %, consistent with other values at these redshifts (eg. Patton et al., 1997).
6. Discussion
Using the deepest imaging and spectroscopic data available, we show that the fraction and number density of major mergers between massive galaxies peak at relatively low redshifts. These peaks are likely not an artifact of the data nor the measurement process, given the careful attention to the mass limits, spectrophotometric redshift accuracy, accounting of measurement uncertainties, unprecedented flux limit, and the good agreement with published data in the redshift range of overlap. Since the high redshift portion of our observed merger rate dramatically differs from what is found by numerous authors, it is interesting to explore some of the consequences which arise from this difference. In particular, one implication of our merger rate concerns the fraction of galaxies which have undergone a major merger, or the remnant fraction . By assuming a merger fraction of and a merger timescale Gyr, Patton et al. (2002) find that % of galaxies with mag have experienced a major merger since . This is in contrast with the semi-analytic models of De Lucia et al. (2006), who argue that % of stars which comprise elliptical galaxies assemble into a single dark halo between by major merging. When we apply this analysis222Our remnant fraction is found from equation (18) of Patton et al. (2002). to our slightly larger and steeper merger rate, we find that % of galaxies with M⊙ have been involved in a major merger since . Moreover, since our merger rate peaks at some critical redshift, the fraction of massive galaxies that have undergone a major merger tends to a limiting value at of %, whereas a strict power-law form increases to 100%. This suggests that % of massive galaxies may have never undergone a major merger in their lifetime, but does not preclude a series of minor mergers. The magnitude of physical processes, which are driven by galaxy merging, should be proportional to the merging galaxy number density. Many phenomena have been linked to galaxy merging, most notably, star formation, AGN activity, and galaxy morphologies. The cosmic star formation rate density, as traced by radio, ultraviolet, far infrared, and/or various emission line luminosities has been measured by numerous authors at (Lilly et al., 1996; Madau et al., 1996; Connolly et al., 1997; Steidel et al., 1999; Haarsma et al., 2000; Brinchmann et al., 2004; Wyder et al., 2005; Bouwens et al., 2006; Hopkins & Beacom, 2006). While there is reasonable consensus that the star formation rate density increases from to , the high redshift portion can differ greatly among the many authors. Nonetheless, the peak in our merger number density is consistent with the peak in the cosmic star formation rate density at . Moreover, the peak star formation rate density is M⊙ yr-1 Mpc-3 (eg. Hopkins et al., 2006), which would require the typical merger system to have a star formation rate of M⊙ yr-1. This rate is considerably higher than what is expected for major mergers (Bell et al., 2005), which suggests that major mergers are not the only source of star formation at these redshifts. However, minor merging is expected to be more frequent, and may be responsible for triggering the remaining portion of the cosmic star formation density. Many authors have addressed an evolutionary link between merging galaxies and AGN (Carlberg, 1990; Silk & Rees, 1998; Kauffmann & Haehnelt, 2000; Croton et al., 2006; Hopkins et al., 2006), and generally agree that major merging can drive AGN activity. Therefore, it is natural to compare our merger number density to the observed AGN density. The density of type-1 AGN selected in soft (0.5–2.0 keV) -ray band with luminosities of erg s-1 from Hasinger, Miyaji, & Schmidt (2005) is shown in 6 as a dotted line. This sample provides the roughly instantaneous AGN activity unobscured through any dust, and is similar to the results in the hard -rays (Ueda et al., 2003). This AGN density peaks at , or a lookback time of Gyr, whereas our observed merger number density peaks at , or Gyr in lookback time. If a major merger of two galaxies triggers an AGN, then we expect on average Gyr between the time when the galaxies are observed as a pair on the sky, and when the remnant would be observed as an AGN in the soft -rays. Springel, Di Matteo, & Hernquist (2005) have suggested that major merging can trigger the fueling of the central black hole after the merger onset, and will be observed as a visible AGN Gyr later. According to these simulations, we expect the merger number density to peak Gyr earlier in cosmic time than the AGN density which is similar to our observations. These measurements have exploited the excellent redshift accuracy, spatial resolution, and depth of ACS grism observations. The Wide Field Camera 3 for HST will provide combined ultraviolet prism, infrared grism, and numerous ultraviolet, optical, and near-infrared broadband observations. With such a rich dataset, redshifts of comparable accuracy from should become standard. This will be ideal for refining this work, and determining the role of various effects, such as galaxy environments and/or cosmic variance at .
References
- Abraham et al. (1996) Abraham, R. G., Tanvir, N. R., Santiago, B. X., Ellis, R. G., Glazebrook, K., & van den Bergh, S. 1996, MNRAS, 279, L47
- Abraham (1999) Abraham, R. G. 1999, IAUS, 186, 11
- Bahcall et al. (1997) Bahcall, J. N., Kirhakos, S., Saxe, D. H., & Schneider, D. P. 1997, ApJ, 479, 642
- Beckwith et al. (2006) Beckwith, S. V. W., et al. 2006, AJ, 132, 1729
- Bell et al. (2005) Bell, E. F., et al. 2005, ApJ, 625, 23
- Bell et al. (2006) Bell, E. F., Phleps, S., Somerville, R. S., Wolf, C., Borch, A., & Meisenheimer, K. 2006, ApJ, 652, 270
- Benítez (2000) Benítez, N. 2000, ApJ, 536, 571
- Berrier et al. (2006) Berrier, J. C., Bullock, J. S., Barton, E. J., Guenther, H. D., Zentner, A. R., & Wechsler, R. H. 2006, ApJ, 652, 56
- Bershady, Jangren, & Conselice (2000) Bershady, M. A., Jangren, A., & Conselice, C. J. 2000, AJ, 119, 2645
- Bolzonella, Miralles, & Pelló (2000) Bolzonella, M., Miralles, J.-M., & Pelló, R. 2000, A&A, 363, 476
- Bouwens et al. (2006) Bouwens, R. J., Illingworth, G. D., Blakeslee, J. P., & Franx, M. 2006, ApJ, 653, 53
- Brinchmann et al. (2004) Brinchmann, J., Charlot, S., White, S. D. M., Tremonti, C., Kauffmann, G., Heckman, T., & Brinkmann, J. 2004, MNRAS, 351, 1151
- Bruzual & Charlot (2003) Bruzual, G. & Charlot, S. 2003, MNRAS, 344, 1000 (BC03)
- Burkey et al. (1994) Burkey, J. M., Keel, W. C., Windhorst, R. A., & Franklin, B. E. 1994, ApJ, 429, 13
- Canalizo et al. (2007) Canalizo, G., Bennert, N., Jungwiert, B., Stockton, A., Schweizer, F., Lacy, M., & Peng, C. 2007, ApJ, 669, 801
- Carlberg (1990) Carlberg, R. G. 1990, ApJ, 350, 505
- Carlberg (1991) Carlberg, R. G. 1991, ApJ, 375, 429
- Carlberg, Pritchet, & Infante (1994) Carlberg, R. G., Pritchet, C. J., & Infante, L. 1994, ApJ, 435, 540
- Coe et al. (2006) Coe, D., Benítez, N., Sánchez, S., F., Jee, M., Bouwens, R., & Ford, H. 2006, AJ, 132, 926
- Cohen et al. (2006) Cohen, S. H., et al. 2006, ApJ, 639, 731
- Cole et al. (2001) Cole, S., et al. 2001, MNRAS, 326, 255
- Coleman, Wu, & Weedman (1980) Coleman, G. D., Wu, C.-C., & Weedman, D. W. 1980, ApJS, 43, 393
- Connolly et al. (1997) Connolly, A. J., Szalay, A. S., Dickinson, M., SubbaRao, M. U., & Brunner, R. J. 1997, ApJ, 486, L11
- Conselice (2003) Conselice, C. J. 2003, ApJS, 147, 1
- Conselice et al. (2003) Conselice, C. J., Bershady, M. A., Dickinson, M., & Papovich C. 2003, ApJ, 126, 1183
- Conselice (2006) Conselice, C. J. 2006, ApJ, 638, 686
- Croton et al. (2006) Croton, D. J., et al. 2006, MNRAS, 356, 1155
- Daddi et al. (2004) Daddi, E., et al. 2004, ApJ, 617, 746
- Daddi et al. (2005) Daddi, E., et al. 2005, ApJ, 626, 680
- Daddi et al. (2007) Daddi, E., et al. 2007, ApJ, in press, arXiv/0705.2832
- De Lucia et al. (2006) De Lucia, G., Springel, V., White, S. D. M., Croton, D., & Kauffmann, G. 2006, MNRAS, 366, 499
- Dickinson et al. (2003) Dickinson, M., Papovich, C., Ferguson, H. C., & Budavári, T. 2003, ApJ, 587,25
- Driver et al. (1995) Driver, S. P., Windhorst, R. A., Ostrander, E. J., Keel, W. C., Griffiths, R., E., Ratnatunga, K. U. 1995, ApJ, 449, L23
- Driver (1999) Driver, S. P. 1999, ApJ, 526, L69
- Elsner, Feulner, & Hopp (2007) Elsner, F., Feulner, G., & Hopp, U. 2007, A&A, accepted, astro-ph/0711.0384
- Fakhouri & Ma (2007) Fakhouri, O. & Ma, C.-P. 2007, MNRAS, submitted, astro-ph/0710.4567
- Förster Schreiber et al. (2004) Förster Schreiber, N. M., et al. 2004, ApJ, 616, 40
- Grogin et al. (2005) Grogin, N. A., et al. 2005, ApJ, 627, L97
- Guyon, Sanders, & Stockton (2006) Guyon, O., Sanders, D. B., & Stockton, A. 2006, ApJS, 166, 89
- Haarsma et al. (2000) Haarsma, D. B., Partridge, R. B., Windhorst, R. A., & Richards, E. A. 2000, ApJ, 544, 641
- Hasinger, Miyaji, & Schmidt (2005) Hasinger, G., Miyaji, G., & Schmidt, M. 2005, A&A, 441, 417
- Hopkins & Beacom (2006) Hopkins, A. M. & Beacom, J. F. 2006, ApJ, 651, 142
- Hopkins et al. (2006) Hopkins, P. F., Hernquist, L., Cox, T. J., Di Matteo, T., Robertson, B., & Springel, V. 2006, ApJS, 163, 1
- Kartaltepe et al. (2007) Kartaltepe, J. S., et al. 2007, ApJS, 172, 320
- Kauffmann & Haehnelt (2000) Kauffmann, G. & Haehnelt, M. 2000, MNRAS, 311, 576
- Kauffmann, White, & Guiderdoni (1993) Kauffmann, G., White, S. D. M., & Guiderdoni, B. 1993, MNRAS, 264, 201
- Khochfar & Burkert (2001) Khochfar, S. & Burkert, A. 2001, ApJ, 561, 517
- Larson & Tinsley (1978) Larson, R. B. & Tinsley, B. M. 1978, ApJ, 219, 46
- Le Fèvre et al. (2000) Le Fèvre, O., et al. 2000, MNRAS, 311, 565
- Lilly et al. (1996) Lilly, S. J., Le Fèvre, O., Hammer, F., & Crampton, D. 1996, ApJ, 406, L1
- Lin et al. (2004) Lin, L., et al. 2004, ApJ, 617, L9
- Madau et al. (1996) Madau, P., Ferguson, H. C., Dickinson, M. E., Giavalisco, M., Steidel, C. C., & Fruchter, A. 1996, MNRAS, 283, 1388
- Neuschaefer et al. (1997) Neuschaefer, L. W., Im, W., Ratnatunga, K. U., Griffiths, R. E., & Casertano, S. 1997, ApJ, 480, 59
- Oke & Gunn (1983) Oke, J. B. & Gunn, J. E. 1983, ApJ, 266, 713
- Papovich, Dickinson, & Ferguson (2001) Papovich, C., Dickinson, M., & Ferguson, H. C. 2001, ApJ, 559, 620
- Patton et al. (1997) Patton, D. R., Pritchet, C. J., Yee, H. K. C., Ellingson, E., & Carlberg, R. G. 1997, ApJ, 475, 29
- Patton et al. (2000) Patton, D. R., Carlberg, R. G., Marzke, R. O., Pritchet, C. J., da Costa, L. N., & Pellegrini, P. S., 2000, ApJ, 536, 153 (P2000)
- Patton et al. (2002) Patton, D. R., et al. 2002, AJ, 565, 208
- Pirzkal et al. (2004) Pirzkal, N., et al. 2004, ApJS, 154, 501
- de Propris et al. (2005) de Propris, R., Liske, J., Driver, S. P., Allen, P. D., & Cross, N. J. G. 2005, AJ, 130, 1516
- de Propris et al. (2007) de Propris, R., Conselice, C. J., Driver, S. P., Liske, J., Patton, D., Graham, A., & Allen, P. 2007, astro-ph/0705.2528
- Ryan et al. (2007) Ryan Jr., R. E., et al. 2007, ApJ, 668, 839
- Salpeter (1955) Salpeter, E. E. 1955, ApJ, 121, 161
- Sanders & Mirabel (1996) Sanders, D. B. & Mirabel, I. F. 1996, ARA&A, 34, 749
- Schechter (1976) Schechter, P. 1976, ApJ, 203, 297
- Schneider et al. (2005) Schneider, D. N., et al. 2005, AJ, 130, 367
- Silk & Rees (1998) Silk, J. & Rees, M. J. 1998, A&A, 331, L1
- Somerville et al. (2004) Somerville, R., S., Lee, K., Ferguson, H. C., Gardner, J. P., Moustakas, L., A., & Giavalisco, M. 2004, 600, L171
- Spergel et al. (2007) Spergel, D. N., et al. 2007, ApJS, 170, 377
- Springel, Di Matteo, & Hernquist (2005) Springel, V., Di Matteo, T., & Hernquist, L. 2005, MNRAS, 361, 776
- Steidel et al. (1996) Steidel, C. C., Giavalisco, M., Pettini, M., Dickinson, M., & Adelberger, K. L. 1996, ApJ, 462, L17
- Steidel et al. (1999) Steidel, C. C., Adelberger, K. L., Giavalisco, M., Dickinson, M., & Pettini, M. 1999, ApJ, 519, 1
- Thompson et al. (2005) Thompson, R. I., et al. 2005, AJ, 130, 1
- Toomre (1977) Toomre, A. 1977, in “Evolution of Galaxies and Stellar Populations,” ed. B. M. Tinsley & R. B. Larson (New Haven: Yale Univ. Press), 401
- Ueda et al. (2003) Ueda, Y., Akiyama, M., Ohta, K., & Miyaji, T. 2003, ApJ, 598, 886
- White & Frenk (1991) White, S. D. M. & Frenk, C. S. 1991, ApJ, 379, 52
- Wyder et al. (2005) Wyder, T. K., et al. 2005, ApJ, 619, L15
- Xu, Sun, & He (2004) Xu, C. K., Sun, Y. C., & X. T. 2004, ApJ, 603, L73
- Yee & Ellingson (1995) Yee, H. K. C. & Ellingson, E. 1995, ApJ, 445, 37
- Zepf & Koo (1989) Zepf, S. E. & Koo, D. C. 1989, ApJ, 337, 34