Random and Longest Paths: Unnoticed Motifs of Complex Networks
Abstract
Paths are important structural elements in complex networks because they are finite (unlike walks), related to effective node coverage (minimum spanning trees), and can be understood as being dual to star connectivity. This article introduces the concept of random path applies it for the investigation of structural properties of complex networks and as the means to estimate the longest path. Random paths are obtained by selecting one of the network nodes at random and performing a random self-avoiding walk (here called path-walk) until its termination. It is shown that the distribution of random paths are markedly different for diverse complex network models (i.e. Erdős-Rényi, Barabási-Albert, Watts-Strogatz, a geographical model, as well as two recently introduced path-based network types), with the BA structures yielding the shortest random walks, while the longest paths are produced by WS networks. Random paths are also explored as the means to estimate the longest paths (i.e. several random paths are obtained and the longest taken). The convergence to the longest path and its properties ire characterized with respect to several networks models. Several results are reported and discussed, including the markedly distinct lengths of the longest paths obtained for the different network models.
pacs:
89.75.Fb, 02.10.Ox, 89.75.Da‘The longest journey starts with a single step.’ (Old Chinese proverb.)
I Introduction
A good deal of the attention so far focused on complex networks (e.g. Albert and Barabási (2002); Dorogovtsev and Mendes (2002); Newman (2003); Boccaletti et al. (2006); da F. Costa et al. (2007a)) has been motivated by properties involving high degree nodes (hubs in scale free models) and shortest paths between pairs of nodes (small world networks). The former model is characterized by scale free degree distribution, which accounts for the heterogeneity of the local connectivity of nodes and the presence of hubs. Scale free models are also small-world because each hub establishes shortcuts among all nodes to which it is connected to. Recently da F. Costa (2007a, b), the concept of a star was suggested in order to represent the network motifs defined by the edges connected to each node. As discussed in those works, a star can be understood as the dual of a path 111A walk is any sequence of adjacent edges along the network. A path is a special type of walk which never repeats edges or nodes.. Particularly long paths can therefore be related to hubs through such a duality. Stars and paths, inter-related by the path-star transformation and its inverse da F. Costa (2007a, b), present completely opposite intrinsic properties: stars are centralized, while paths are sequential.
While great attention has been given to the degree (e.g. presence of hubs) and shortest paths, other types of paths — such as random and longest — have received little attention. It is particularly interesting to study paths because: (i) they have finite length (unlike walks); (ii) they correspond to the connected subgraph with the smallest possible number of edges linking a set of nodes (a concept related to that of minimum spanning tree); and (iii) as outlined above, they can be understood as duals of stars, a fundamentally important motif in complex networks.
Random paths, as suggested in this work, can be obtained by selecting a node at random and performing a random path-walk (i.e. a walk not allowed to repeat nodes and edges) until unvisited edges or nodes are no longer available. Such paths are therefore closely related to the exploration da F. Costa (2006); da F. Costa and Travieso (2007), sampling Boas et al. (2007) and coverage da F. Costa (2006); da F. Costa et al. (2007b) of the nodes in a network while trying to minimize the number of edges crossed (not a single edge or node in a path are visited more than once). Actually, it is interesting to observe that maximal paths, such as Hamiltonian paths 222Hamiltonian paths are related to the more widely-known Hamiltonian cycles, in the sense that these two types of structures can be transformed one into the other by adding/removing a single edge. covering all the nodes of a network, are special cases of minimum spanning trees Bonanno et al. (2002). Random paths can also be understood as being produced by moving agents which destroy the edges and nodes as they are visited, as it could happen during the spreading of a disease or attack on a network. In addition to being related to such dynamical processes, paths can be considered in order to get insights about the structure and topological properties of networks. For instance, if the several random paths obtained from a given network are found to have short lengths, it may be inferred that the network contains many bottlenecks (e.g. hubs or edges with large betweeness centrality). Therefore, the analysis of random paths can provide additional valuable information about the structure of the analyzed networks.
The longest path in a complex network corresponds to the path (or one of the equal-length paths) involving the largest number of edges (and therefore nodes). Alternatively, the longest path can be defined as the random path involving the largest number of edges. While the distribution of the shortest path lengths bears important implications for communications and distributions taking place in the network, the longest path is naturally related to effective coverage of the nodes by a moving agent. For instance, the presence of a Hamiltonian path indicates that all nodes of the network can be visited while crossing the minimal number of edges. Therefore, the existence of long paths in a specific network may indicate that these structures are intrinsically important for the dynamics or that the network has been constructed around or by incorporating such paths (e.g. da F. Costa (2007b)). One of the possible reasons why scant attention has been focused on longest paths is that, while shortest paths can be determined in polynomial time, longest path identification is an NP-complete problem (e.g. Gibbons (1985)).
The current article aims at investigating random and longest paths in diverse theoretical complex networks models. It starts by describing the basic concepts and methodology, including a simple stochastic method for estimating the longest path, and proceeds with the experimental investigation of the random and longest paths in six theoretical complex networks models.
II Basic Concepts
A undirected complex undirected network, formed by nodes and edges among those nodes, can be fully represented in terms of its adjacency matrix of dimension . Each existing edge implies , with being otherwise imposed. Two edges are said to be adjacent whenever they share one of their extremities. A walk corresponds to any sequence of adjacent edges , where is the length of the walk. A walk which does not repeat any edge or node is a path. An Hamiltonian path Diestel (2000) is a path that encompass all nodes in the networks. The length of a path is equal to the number of its constituent edges. The shortest path between two nodes is defined as one of the paths between those nodes which has the smallest length.
The immediate neighbors of a node are those nodes which are connected to through shortest paths of length 1. A star is a motif containing a node and the edges attached to it. The degree of a node is equal to the number of edges in its respective star. The node degree averaged within a network is called average degree. The clustering coefficient of a node is the ratio between the number of undirected edges between the immediate neighbors of and the maximum possible number of undirected edges among those nodes.
Six theoretical models of complex networks are considered in the present work including four traditional models — Erdős-Rényi (ER), Barabási-Albert (BA), Watts-Strogatz (WS) and a geographical model (GG) — as well as two recently introduced knitted types of complex networks da F. Costa (2007b) — the path-transformed BA model (PA) and path-regular networks (PN). The ER, BA and WS networks are grown as traditionally done (e.g. Albert and Barabási (2002); Dorogovtsev and Mendes (2002); Newman (2003); Boccaletti et al. (2006); da F. Costa et al. (2007a)). The GG network is obtained by randomly distributing nodes within a square and connecting those nodes which are closer than a parameter . The PA and PN networks are grown as described in da F. Costa (2007b). Basically, the PA networks (path-transformed BA networks) are obtained by star-path transforming all nodes in an original BA network. The PN (path regular networks) model, on the other hand, is easily obtained by defining paths involving all network nodes in random order and without repetition.
All networks have and or ( is the number of spokes in the added nodes in the BA model), which implies average degree . Because the average degrees considered in this work are above the percolation critical density, most of the nodes in each network belong to the largest connected component, which is the only part of the network considered for the analyses reported in this article.
III Methodology
This section describes the simple stochastic algorithm for estimation of the longest path used this article as well as the several path-based measurements which can be applied in order to characterize the global connectivity of networks. Given a network, the longest path estimation approach involves finding many random paths while keeping track of the longest obtained path length. Despite the fact that the determination of the longest path is NP-complete, the method is verified, at least for the considered networks, to converge steady and quickly to the longest path.
Given a complex network, one may choose a node at random and start a self-avoiding random walk (or path-walk 333Because a path is usually applied to a static structure in a network, here we use the name path-walk in order to express the process of obtaining a path through a self-avoiding random walk. Observe that the result of a path-walk consequently is a path.) from two outbound edges of , until unvisited edges and nodes are no longer available to the walker at both sides of the walk (a situation which will be called here saturation or termination of the path). It is proposed in this work that such a random path can provide valuable information for complex networks studies. More specifically, provided several random paths are obtained by using such a simple algorithm, the distribution of their properties, especially their length, can provide valuable information about the global structure of the network connectivity.
The algorithm adopted for picking a random path is simple and involves the following steps:
-
(i) Select a node at random;
-
(ii) Chose two edges and emanating from (in case that node has degree one, chose only one edge);
-
(iii) Perform a path-walk along both edges and until the walk stops (i.e. a node is reached which leads to no unvisited node or edge).
The length of a random path is henceforth represented by .
The algorithm proposed here for the estimation of the longest path is also very simple and involves obtaining several random paths and taking the one exhibiting the largest length as the longest path. Given that the determination of the longest path is NP-complete, it is important to consider the convergence of such a simple algorithm. This is performed experimentally in Section IV.2.
IV Results and Discussion
The experimental investigations reported in this section, reported in the following subsections, involved 50 realizations of each model (PA, PN, ER, BA, WE and GG) with nodes and considering and and .
IV.1 Random Paths in Network Models
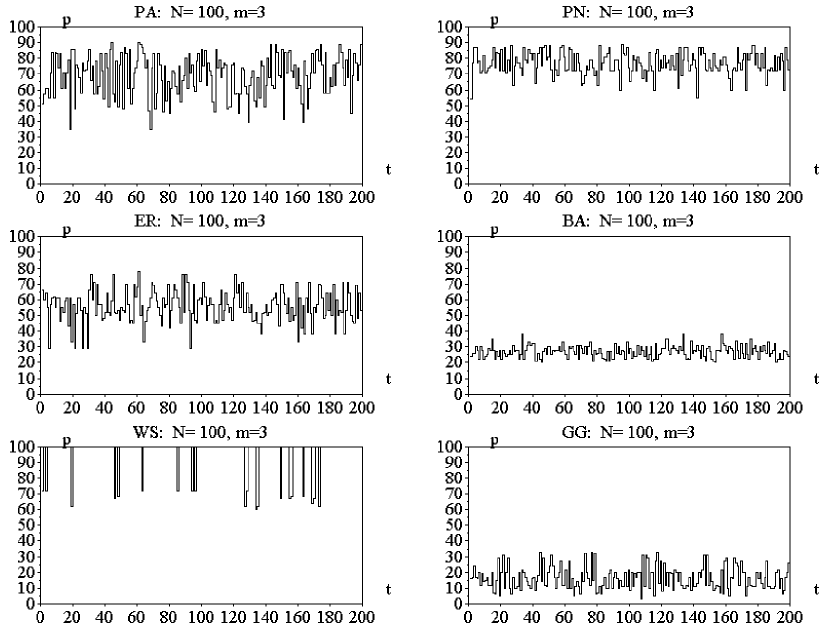
The first important point to be investigated regards the properties of random paths extracted from the several theoretical models of complex networks considered here, (i.e. PA, PN, ER, BA, WS and GG). In order to understand random paths in these several models, random paths were extracted from a network ( and ) of each type by using the algorithm described in Section III and their lengths determined. Figure 1 shows the length of the first 200 obtained random paths. Although this figure considers just one randomly chosen network of each type, it was verified that similar results are obtained for other network samples, except for the WS network, which tended to produce diverse signatures for each specific network. It is clear from this figure that the lengths of the random paths varied substantially for each type of network. The first interesting result is that the values of present relatively small variation, except mainly for the PA and ER models; the BA, PN and GG structures tended to produce random paths with similar lengths. The GG and BA networks led to the shortest random paths, while the ER and PA were characterized by medium size lengths. The longest lengths were obtained for the PN, PA and WS models. Observe also that the standard deviation of the random path lengths tend to increase with the respective average values.
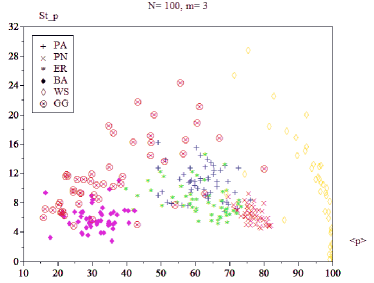
Before interpreting the variations of the random path lengths for each model, an additional, more systematic study was performed considering the mean and standard deviation of the length of 2500 random paths for and and . Figure 2 shows the respectively obtained scatterplots. Observe that each point in these scatterplots was obtained from the measurement of the mean and standard deviation of considering 2500 random paths from each of the 50 realizations performed for each configuration (i.e. and ).
A series of interesting effects can be inferred from these scatterplots. Let us discuss first the case , shown in Figure 2(a). The BA networks, shown in filled diamonds, yielded the smallest average value of , followed by the GG, ER, PA, PN and WS models. The BA structures are also characterized by relatively small standard deviations of . In other words, paths randomly extracted from BA networks tend to be short (about 30 edges long) and with similar lengths. On the other hand, random paths in WS networks tend to be long (from 70 to 100 edges) and with widely varying lengths. The PA and ER networks presented remarkably similar measurements, indicating that these two models are very similar as far as random path properties are concerned for . The PN structures resulted remarkably uniform, in the sense that the mean and standard deviation of resulted particularly similar for each of the 50 realizations, defining a compact cluster in the scatterplot in Figure 2. The GG networks yielded widely varying random path lengths extending from 10 to 80 edges.
We now proceed to the scatterplot obtained for , i.e. . Such an increase of average degree implied some changes relatively to the situation discussed for . First, the random path lengths increased for all network models. The BA cluster, for instance, shifted from values in the range to . The largest increase of random path lengths was achieved for the GG model, which now extends to the maximum length of 100 and over. Observe that, because of the way in which they are grown, GG networks may sometimes exceed 100 nodes (see Section II). Another interesting effect caused by the average degree increase regards the separation of the PA and ER cases, with the respective clusters now presenting substantially less overlap. Also, the dispersions of the PN and WS networks were substantially reduced.
Let us know try to discuss each of the main findings above, which is done as follows:
(a)Longest random paths are obtained for larger average degree: Usually, the higher the average number of edges in a network (reflected in a high average node degree), the more possibilities the agent performing the path-walk will have to keep proceeding to unvisited nodes and edges. Observe that the extreme case where the network is fully connected (i.e. each node is linked to all other nodes in the network), all random paths will always have maximum length of .
(b)Short random paths in the BA model: Consider a typical BA network, with its respective hubs. Once started, a path-walk is very likely to pass through hubs. Once such hubs are visited, they can no longer be part of a path. Because several of the network edges are connected to hubs, the paths soon become saturated.
(c)Long random paths in the WS model: Recall that the WS model is grown by starting with a regular network (a ring) where each node is connected to a number of previous and subsequent nodes. Therefore, by distributing the connectivity almost regularly amongst the nodes, the chances of having at least one unvisited edge leading to an unvisited node increases substantially. Interestingly, being small world does not imply short random paths. On the other hand, the large variances of obtained for this network model are accounted by the rewirings used to induce the small-world effect. Because several of the paths in this model encompass all nodes, this type of network can be understood to frequently contain Hamiltonian paths, implying high efficiency of node coverage by moving agents.
(d)Uniformity of random path lengths in the PN model: As shown in da F. Costa (2007b), PN networks are highly regular regarding several topological measurements. Such an enhanced topological regularity tends to produce similar random path lengths. Still, the substantially distinct values of average and standard deviation of the random path lengths obtained for the WS and PN suggest some intrinsic property for each of those models as far as random paths are concerned.
(e)Similarity of random path lengths in PA and ER models: This effect is particularly intense for (see Figure 2a). Interestingly, these two models had been found da F. Costa (2007b) to present similar values of several topological properties. Such an intrinsic structural congruence between the BA and PA models seems to have implied also in similar random path lengths. Given that the PA model is obtained by applying the star-path transformation over a BA model, it is surprising that such a type of networks would result similar to the ER model in so many aspects.
(f)Large dispersion of random path lengths in the GG model: This effect is particularly interesting given that the way in which such networks are construct could be expected to result in nearly degree regular networks (i.e. most nodes with similar degrees because of the randomly uniform spatial distribution of nodes). However, the random paths obtained from the GG model exhibited widely varying lengths extending from too short (about 5 edges) to very long (over 80 edges). No other considered model yielded such a large variance of random path lengths. This property is interesting because it implies that it is in principle very difficult to foresee how well a geographical model (at least of the GG type) can be effectively covered by a moving agent. In order to understand better the reason for such a large variance of path lengths in this model, it would be interesting to consider configurations involving larger values of (see Section II).
IV.2 Convergence to the Maximum Random Path
Having investigated random paths in the considered complex networks models, we now proceed to study the longest paths in those structures.
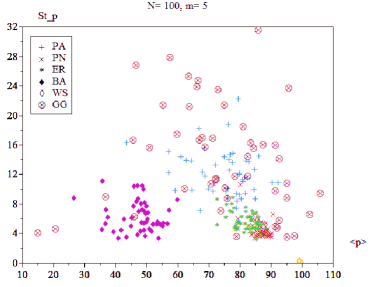
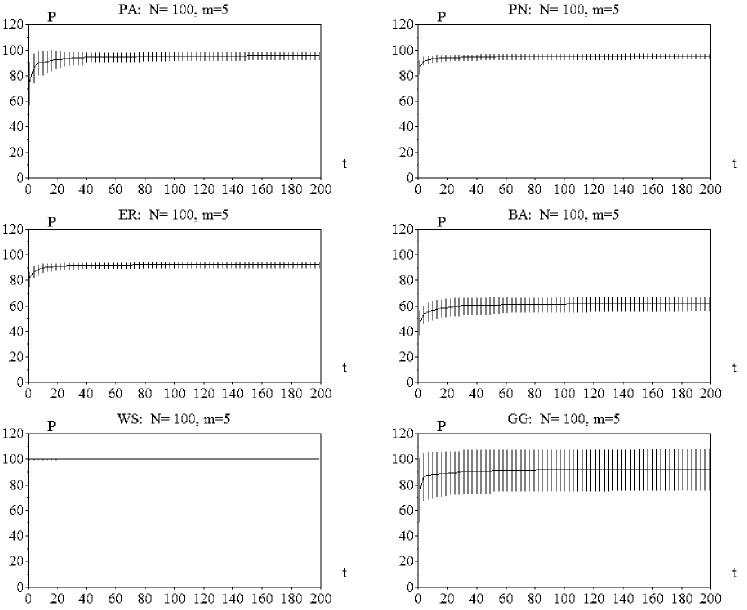
Figure 3 illustrates the length of the longest random path obtained along the following of successive random paths in a single network of each considered type with and considering the initial 200 random paths. It is clear from these examples that the length of the currently maximum random path tends to increase fast and steadily to a stable value, defining a plateau, which tends to correspond to the maximum random path length . Experiments involving 2500 steps confirmed that the plateaux tend to remain stable, suggesting that the longest path has indeed been identified after 200 steps. Though the standard deviations vary from one case to another, they are mostly small (except for the GG networks).
Figure 4 presents the longest path lengths for and along the 200 steps (recall that each step involving obtaining a random path and comparing its length with that of the longest current path). Observe that the increase in , implying higher average degree, tended to augment the length of the longest path in all cases, particularly for the GG structures where the longest path length almost doubled. It is also interesting to notice that the standard deviations tended to decrease in all models for this higher value of .
The above results suggest that the simple methodology adopted in this work for identification of the longest path tends to converge fast to the longest path (or at least to a path very similar to that in length) at least for the considered values of and . Also, the obtained results indicate that most models, except mainly for the BA networks, contain longest paths passing through the great majority of the network nodes. Several Hamiltonian paths have been found for WS networks.
IV.3 Similarity between random paths and the maximum random path
Though the method for longest path identification tends to converge fast and steadily to a putative longest path, possibly representing the longest one in the network, it is interesting to consider how much each of these putative longest paths followed during the algorithm resembles the longest path obtained for a very large number of steps (henceforth called the reference longest path). The importance of such an investigation becomes clear when we consider that a single network may have more than one longest path (with the same or very similar lengths), possibly even involving the same nodes. Provided we can quantify the difference between the reference longest path and each considered random path, the study of the variation of such a difference along the steps can supply a valuable information about the eventual multiplicity of longest paths in the network. As an example of a extreme situation, a completely connected network will contain a large number of Hamiltonian paths, i.e. paths covering all nodes in the network.
In this section we report experiments aimed at quantifying the difference between the subsequent random paths and the reference longest path considering the overlap of nodes and edges.
Given two paths and , each with and nodes (and therefore and edges), it is possible to estimate the dissimilarity between these two paths through the following index
| (1) |
where is the number of nodes which are different in both paths. Therefore, the index varies between 0 and 1, achieving its minimum value for identical paths. However, such a minimum value does not imply that the two paths are identical (though they have the same nodes), because each of them may involve different edges from the original network.
It is also possible to define a dissimilarity index considering the overlap of edges along the two paths, i.e.
| (2) |
where is the number of different edges in both paths. Again, we have that . The minimum dissimilarity between the edges of the two paths again provides no guarantee that the two paths are identical because the order of the edges is not taken into account in Equation 2. Though it would be possible to obtain a completely strict measurement of similarity between the two paths by considering distances between the two respective adjacency matrices representing the paths, such a measurement would not work for cases where the two paths involve the same nodes but different edges. For such reasons, the similarities between each random path and the reference longest path are henceforth performed in terms of the dissimilarity indices given in Equations 1 and 2.
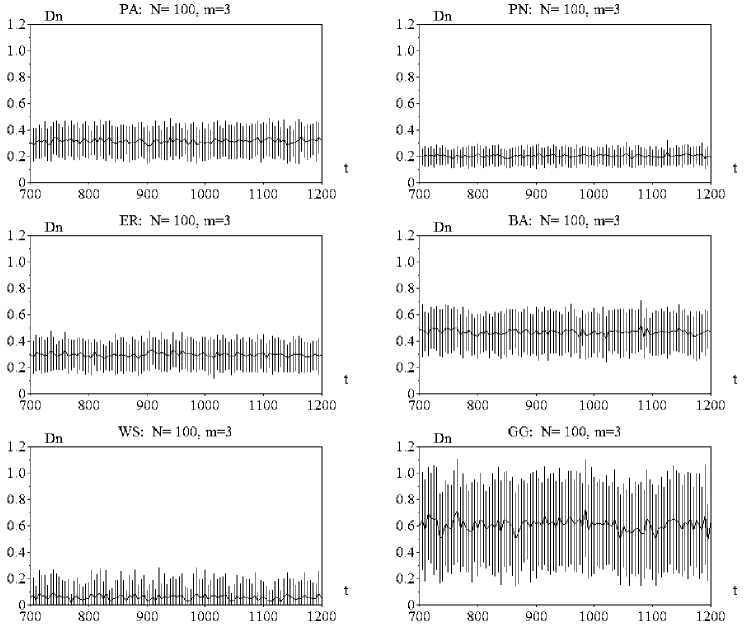
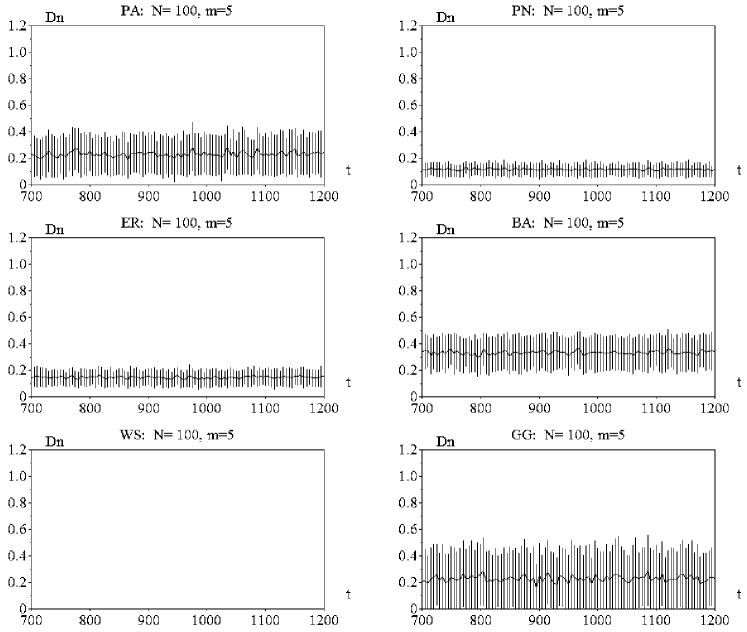
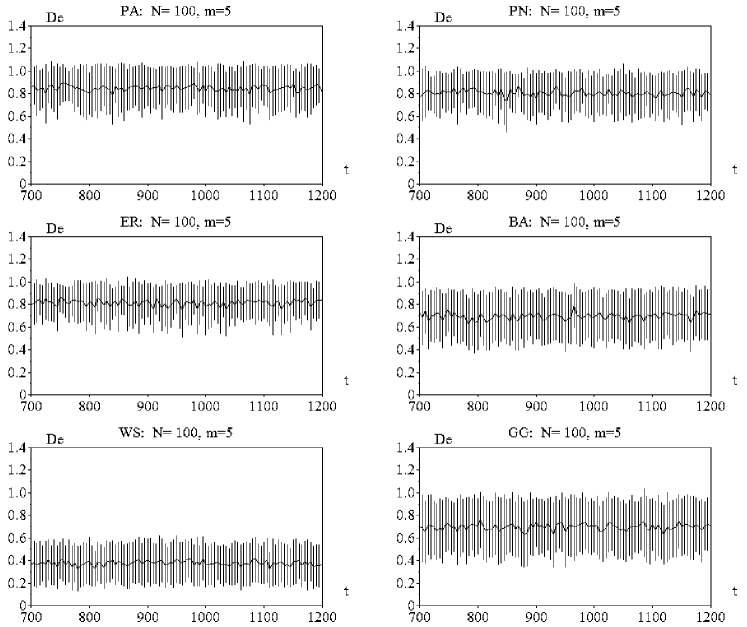
Figure 5 shows the node dissimilarity for all cases, considering and , along 500 steps (from step 700 to 1200) of the algorithm for longest path estimation. The reference longest path corresponds to that obtained after 2500 steps in each case. The results in this figure indicate that each network model is characterized by different dismilarities. The smallest dissimilarities (about ) were obtained for the WS networks. Combined with the fact that the WS tends to lead to long random paths, the above result means that the longest paths in these structures tend to incorporate the same nodes. The largest dissimilarities (both average and standard deviations) were obtained for the geographical model, reflecting the large dispersion of random path lengths already observed for that type of networks. Figure 6 shows the node dissimilarities obtained for , all of which smaller than the respective counterparts in Figure 5.
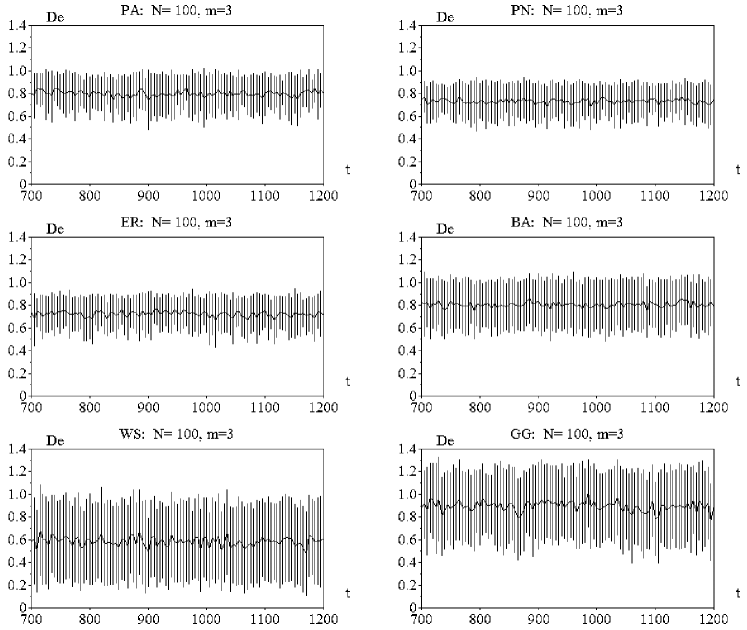
The edge dissimilarities for and are shown in Figure 7. All such relative values are higher than those respectively obtained for the node dismilarity (please refer to figure 5). It is also clear from Figure 7 that, except for the WS model, the edges dissimilarities were all close to . Therefore, despite the fact that the random paths tend to share several nodes with the longest path in those networks, they involve significantly different edges. The edges similarities obtained for and are presented in Figure 8. These results are remarkably similar to those in Figure 7, except for the lower dissimilarity obtained for the WS model. Such a result suggests that the average degree seems to affect relatively little the edge dissimilarities obtained for the considered models, at least for .
V Concluding Remarks
The node degree and shortest path length have received special attention from the complex network community as measurements of the topology of complex networks because of their intimate relationship with the critical properties of scale-free and small-world, respectively. Though important, such measurements are not sufficient to describe the complete topology of complex networks, in the sense that many distinct networks may yield identical average node degree or average shortest path length (e.g. da F. Costa et al. (2007a)). It is therefore important to devise different ways of looking at complex networks. While random walks have been largely applied in statistical physics and complex networks, random path-walks (random paths for short) have received substantially less attention (e.g. da F. Costa (2006)). Paths are important because: (a) they necessarily terminate (a walk can proceed forever by passing through repeated edges and nodes); (b) paths are special cases of minimal spanning trees West (2001), therefore containing the smallest number of edges required to cover the respective nodes; and (c) they exist in smaller number than walks, as implied by the requirement of not repeating edges or nodes. The current work explored the possibility to investigate the structural properties of complex networks as far as two types of paths are concerned: random and longest.
Random paths are obtained by selecting a node randomly from the network and initiating a path from that node, until the path terminates at its both extremities. The statistical study of the distribution of type of paths is interesting because the variation of such structures can reflect intrinsic structural properties in the networks. Indeed, the experimental results reported and discussed in this article indicated that the several types of considered networks — namely ER, BA, WS, GG, PA and PN — are characterized by distinctive average and standard deviation values of their random path lengths. The BA model, in particular, yielded the smallest random paths, which is explained by the fact that once a hub is visited it will block access to many other nodes to which it is connected. The longest random paths were obtained for the WS model. Random paths arising from PN networks tended to present remarkably similar lengths. The random path lengths tended to increased with the average degree in all cases.
Largely overlooked in the literature, the longest path of a network constitutes a particularly interesting global underlying structure. Though the determination of the longest path in a network represents an NP-complete, we have shown in the current article — at least for relatively small networks () and considered average degrees — that a simple algorithm involving the comparison of subsequent random paths tend to converge to a long path fast and steadily. Such an efficiency paves the way to comprehensive investigations of the distribution and properties of the longest paths in the several considered network models. Again, and for similar reasons, the BA structures tended to present the shortest longest paths, while the WS networks systematically yielded longest paths comprising all the nodes. The longest paths tended to increase with the average degree in all cases. At the same time, the longest path lengths were characterized by surprisingly small standard deviations, except for the GG model.
Several are the future investigations motivated by the reported results. First, it would be interesting to investigate the stochastic distribution of the random and longest paths considering alternative network models. It would be also interesting to try to relate intrinsic random and longest path properties to specific network measurements in addition to the average degree. In another direction, it would be relatively easy to extend the considered concepts and methods to the analysis of random and longest cycles, which are closely related to random and longest paths. The concept of similarity between paths (as well as walks) can also be refined and explored further in order to quantify how diverse are the paths performed in different networks can be. Such investigations could provide valuable information about the transient dynamics of the respective networks.
Acknowledgements.
Luciano da F. Costa thanks CNPq (308231/03-1) and FAPESP (05/00587-5) for sponsorship.References
- Dorogovtsev and Mendes (2002) S. N. Dorogovtsev and J. F. F. Mendes, Advs. in Phys. 51, 1079 (2002).
- Newman (2003) M. E. J. Newman, SIAM Rev. 45, 167 (2003).
- Boccaletti et al. (2006) S. Boccaletti, V. Latora, Y. Moreno, M. Chavez, and D. Hwang, Phys. Rep. 424, 175 (2006).
- da F. Costa et al. (2007a) L. da F. Costa, F. A. Rodrigues, G. Travieso, and P. R. V. Boas, Adv. in Phys. 56, 167 (2007a).
- Albert and Barabási (2002) R. Albert and A. L. Barabási, Rev. Mod. Phys. 74, 47 (2002).
- da F. Costa (2007a) L. da F. Costa (2007a), arXiv:0711.1271.
- da F. Costa (2007b) L. da F. Costa (2007b), arXiv:0711.2736.
- da F. Costa (2006) L. da F. Costa, Phys. Rev. E 74, 026103 (2006).
- da F. Costa and Travieso (2007) L. da F. Costa and G. Travieso, Phys. Rev. E 75, 016102 (2007).
- Boas et al. (2007) P. R. V. Boas, F. A. Rogrigues, G. Travieso, and L. da F. Costa, arXive (2007), arXiv:0706.2365.
- da F. Costa et al. (2007b) L. da F. Costa, F. A. Rodrigues, and G. Travieso, Phys. Rev. E 76, 046106 (2007b).
- Bonanno et al. (2002) G. Bonanno, G. Caldarelli, F. Lillo, and R. N. Mantegna, arXive (2002), arXiv:cond-mat/0211546.
- Gibbons (1985) A. Gibbons, Algorithmic graph theory (Cambridge University Press, 1985).
- Diestel (2000) R. Diestel, Graph Theory (Springer, 2000).
- West (2001) D. B. West, Introduction to Graph Theory (Prentice Hall, 2001).