Interaction-induced star formation in a complete sample of nearby star-forming galaxies
Abstract
We investigate the clustering properties of a complete sample of star-forming galaxies drawn from the data release 4 (DR4) of the Sloan Digital Sky Survey. On scales less than 100 kpc , the amplitude of the correlation function exhibits a strong dependence on the specific star formation rate of the galaxy. We interpret this as the signature of enhanced star formation induced by tidal interactions. We then explore how the average star formation rate in a galaxy is enhanced as the projected separation between the galaxy and its companions decreases. We find that the enhancement depends strongly on , but very weakly on the relative luminosity of the companions. The enhancement is also stronger in low mass galaxies than in high mass galaxies. In order to explore whether a tidal interaction is not only sufficient, but also necessary to trigger enhanced star formation in a galaxy, we compute background subtracted neighbour counts for the galaxies in our sample. The average number of close neighbours around galaxies with low to average values of SFR/ is close to zero. At the highest specific star formation rates, however, more than 40% of the galaxies in our sample have a companion within a projected radius of 100 kpc. Visual inspection of the highest SFR/ galaxies without companions reveals that more than 50% of these are clear interacting or merging systems. We conclude that tidal interactions are the dominant trigger of enhanced star formation in the most strongly star-forming systems. Finally, we find clear evidence that tidal interactions not only lead to enhanced star formation in galaxies, but also cause structural changes such as an increase in concentration.
keywords:
galaxies: clustering - galaxies: distances and redshifts - large-scale structure of Universe - cosmology: theory - dark matter1 Introduction
It has been known for more than thirty years that galaxy interactions lead to enhanced star formation. Toomre & Toomre (1972) pioneered the use of numerical simulations to study the interactions of galaxies and suggested that gas may be funnelled to the central regions of the systems as a result of the strong tidal forces that operate during the encounter. This gas is then able to fuel a burst of star formation. Since then, there have been many studies, both observational and theoretical, that have examined the relationship between star formation and galaxy interactions.
Most early observational studies adopted broad band colours (e.g. Larson & Tinsley, 1978), H equivalent widths, (e.g. Keel et al., 1985; Bushouse, 1986; Kennicutt et al., 1987), far-infrared luminosities (e.g. Bushouse et al., 1988), or molecular (CO) emission (Young et al., 1986; Sanders et al., 1986; Solomon & Sage, 1988; Tinney et al., 1990; Young et al., 1996) as indicators of star formation. These studies all demonstrated that galaxy interactions are statistically linked to enhanced rates of star formation (see the review of Keel, 1991; Struck, 1999).
Recent studies of star formation in interacting galaxies have been based on redshift surveys such as the Center for Astrophysics redshift survey (CfA2; Barton et al., 2000; Woods et al., 2006), the Two Degree Field Redshift Survey (2dFGRS; Lambas et al., 2003), and the Sloan Digital Sky Survey (SDSS; Nikolic et al., 2004; Woods & Geller, 2007; , Ellison et al.2008). These studies have also provided observational evidence that star formation is enhanced as a consequence of tidal interactions. Most of these studies have also demonstrated that the degree of enhancement is a strong function of the projected separation between the two galaxies as well as their difference in redshift. In addition, some studies investigated how galaxy properties such as concentration (Nikolic et al., 2004), luminosity ratio (Woods et al., 2006; Woods & Geller, 2007), stellar mass ratio (, Ellison et al.2008), colour, and AGN activity (Woods & Geller, 2007) depend on separation.
Although most studies have supported the picture that interactions induce star formation, there have been number of dissenting papers. For example, Bergvall et al. (2003) analyzed optical/near-IR observations of a sample of 59 interacting/merging systems and concluded that they do not differ very much from isolated galaxies in terms of their global star formation rates. Brosch et al. (2004) found that interaction-induced star formation is not significant for dwarf galaxies. A more recent study by Smith et al. (2007) analyzed Spitzer mid-infrared (MIR) imaging of a sample of 35 interacting galaxy pairs selected from the Arp Atlas (Arp, 1966). They compared the global MIR properties of these systems with those of normal spiral galaxies. The MIR colors of interacting galaxies were found to be redder than normal spirals, implying enhancements to the specific SFRs of a factor of 2. However, in contrast to results from previous investigations, they did not find any evidence that the enhancement depended on separation. This may be due to the small size of their sample and fact that the galaxies were selected to be tidally disturbed (Smith et al., 2007).
On the theoretical side, -body simulations that treat the hydrodynamics of the gas (Negroponte & White, 1983; Barnes & Hernquist, 1992; Mihos & Hernquist, 1996; Springel, 2000; Tissera et al., 2002; Meza et al., 2003; Kapferer et al., 2005; Cox et al., 2006) have demonstrated that interactions between galaxies can bring gas from the disc to the central regions of the galaxy, leading to enhanced star formation in the bulge. Recently, Di Matteo et al. (2007) investigated star formation in a suite of several hundred numerical simulations of interacting galaxies with different gas fractions, bulge-to-disk ratios and orbital parameters. Their work confirmed that galaxy interactions and mergers can trigger strong nuclear starbursts. However, the authors pointed out that this is not always the case, because strong tidal interactions at the first pericenter passage can remove a large amount of gas from the galaxy disks, and this gas is only partially re-acquired by the galaxies in the last phase of the merging event.
In summary, although it is now well established that interactions/mergers between galaxies can enhance star formation, a number of important questions remain to be answered:
-
•
Are interactions not only sufficient but also necessary to enhance star formation?
-
•
Do interactions always trigger enhanced star formation?
-
•
How does the enhancement in star formation depend on parameters such as the separation between the two galaxies and their mass ratio? Does the enhancement also depend on properties such as stellar mass or galaxy morphology?
To answer these questions, we adopt three different methods to analyse a sample of star-forming galaxies selected from the Data Release 4 (DR4) of the SDSS. First, we compute the cross-correlation between star-forming galaxies and a reference sample of galaxies drawn from the DR4. In the standard model of structure formation, the amplitude of the correlation function on scales larger than a few Mpc provides a direct measure of the mass of the dark matter haloes that host the galaxies. As we will show, the amplitude of the correlation function on scales less than kpc can serve as a probe of physical processes such as mergers and interactions. We then compute the average enhancement in star formation as a function of the projected separation between two galaxies and we explore how the enhancement depends on galaxy properties such as stellar mass and concentration index. Finally, we compute counts around our galaxies as a function of separation and explore how this changes as a function of the specific star formation rate SFR/. This allows us to investigate whether the majority of galaxies with specific star formation rates above some critical threshold are experiencing merger-induced starbursts. In a separate paper, we explore whether AGN activity is also triggered by tidal interactions using the same set of analysis techniques.
Throughout this paper, We assume a cosmological model with the density parameter and a cosmological constant . To avoid the factor, a Hubble constant , in units of , is assumed throughout this paper when computing absolute magnitudes.
2 Samples
2.1 The SDSS Spectroscopic Sample
The data analyzed in this study are drawn from the Sloan Digital Sky Survey (SDSS). The survey goals are to obtain photometry of a quarter of the sky and spectra of nearly one million objects. Imaging is obtained in the u, g, r, i, z bands (Fukugita et al., 1996; Smith et al., 2002; Ivezić et al., 2004) with a special purpose drift scan camera (Gunn et al., 1998) mounted on the SDSS 2.5 meter telescope (Gunn et al., 2006) at Apache Point Observatory. The imaging data are photometrically (Hogg et al., 2001; Tucker et al., 2006) and astrometrically (Pier et al., 2003) calibrated, and used to select stars, galaxies, and quasars for follow-up fibre spectroscopy. Spectroscopic fibres are assigned to objects on the sky using an efficient tiling algorithm designed to optimize completeness (Blanton et al., 2003). The details of the survey strategy can be found in York et al. (2000) and an overview of the data pipelines and products is provided in the Early Data Release paper (Stoughton et al., 2002). More details on the photometric pipeline can be found in Lupton et al. (2001).
Our parent sample for this study is composed of 397,344 objects which have been spectroscopically confirmed as galaxies and have data publicly available in the SDSS Data Release 4 (Adelman-McCarthy et al., 2006). These galaxies are part of the SDSS ‘main’ galaxy sample used for large scale structure studies (Strauss et al., 2002) and have Petrosian magnitudes in the range after correction for foreground galactic extinction using the reddening maps of Schlegel et al. (1998). Their redshift distribution extends from to 0.30, with a median of 0.10.
The SDSS spectra are obtained with two 320-fibre spectrographs mounted on the SDSS 2.5-meter telescope. Fibers 3 arcsec in diameter are manually plugged into custom-drilled aluminum plates mounted at the focal plane of the telescope. The spectra are exposed for 45 minutes or until a fiducial signal-to-noise (S/N) is reached. The median S/N per pixel for galaxies in the main sample is . The spectra are processed by an automated pipeline, which flux and wavelength calibrates the data from 3800 to 9200 Å. The instrumental resolution is R = 1850 – 2200 (FWHM Å at 5000 Å).
2.2 Star-forming galaxies
Our sample of star-forming galaxies is drawn from the DR4 spectroscopic sample using the criteria described in Brinchmann et al. (2004). In order for a galaxy to be securely classified as star-forming, we require that the four emission lines [OIII], H, H and [NII] all be detected with signal-to-noise greater than 3 and that the ratios [OIII]/H and [NII]/H have values that place them within the region of the Baldwin et al. (1981, BPT) diagram occupied by galaxies in which the primary source of ionizing photons is from HII regions rather than an AGN. We refer to this sample as the high S/N star-forming class. In certain cases, we supplement the sample with the low S/N star-forming class defined by Brinchmann et al. These are the galaxies that are left over after all the AGN and high S/N star-forming galaxies have been removed, and they have S/N in H. Star formation rates can still be estimated from their emission line strengths, but the errors on these estimates will be significantly larger than for the high S/N sample.
The reader is referred to Brinchmann et al. (2004) for a detailed description of how star formation rates are derived for the various samples. We will be making use of the specific star formation rate estimated within the 3 arsecond SDSS fibre aperture. These star formation rates are more accurate than the total star formation rates derived by Brinchmann et al, because they depend only on the emission line fluxes measured from the spectra and they do not involve any uncertain colour corrections. The disadvantage of the fibre-based specific star formation rates is that they are only sensitive to the emission from the inner region of the galaxy, which includes one third of the total light on average.
2.3 Reference Samples
We work with two different reference samples: (i) a spectroscopic reference sample, which is used to compute the projected cross-correlation function between star-forming galaxies and reference galaxies, and (ii) a photometric reference sample, which is used to calculate counts of close neighbours around star-forming galaxies. We use the New York University Value Added Galaxy Catalogue (NYU-VAGC) to construct the reference samples. The original NYU-VAGC is a catalogue of local galaxies (mostly below ) constructed by Blanton et al. (2005) based on the SDSS DR2. Here, we use a new version of the NYU-VAGC (Sample dr4), which is based on SDSS DR4. The NYU-VAGC is described in detail in Blanton et al. (2005).
The reference samples are exactly the same as used in Li et al. (2006b). In short, the spectroscopic reference sample is constructed by selecting from Sample dr4 all galaxies with that are identified as galaxies from the Main sample, in the redshift range , and with absolute magnitudes . The spectroscopic reference sample contains 292,782 galaxies. The photometric reference sample is also constructed from Sample dr4 by selecting all galaxies with . The resulting sample includes 1,065,183 galaxies. In certain cases, we will work with photometric reference samples with a range of differing limiting magnitudes.
3 Cross-correlation functions
Our methodology for computing correlation functions has been described in detail in our previous papers (Li et al., 2006a, b). We present here a brief description and the reader is referred to the earlier papers for details. Random samples are constructed that have the same selection function as the reference sample. The redshift-space two-point cross-correlation function (2PCCF) between star-forming galaxies and the reference sample is then calculated using the estimator presented in Li et al. (2006b). Finally, the redshift-space projected 2PCCF is estimated by integrating along the line-of-sight direction with ranging from 0 to 40 . We have also corrected carefully for the effect of fibre collisions and a description and tests of the method are given in Li et al. (2006b). The errors on the clustering measurements are estimated using the bootstrap resampling technique (Barrow et al., 1984).
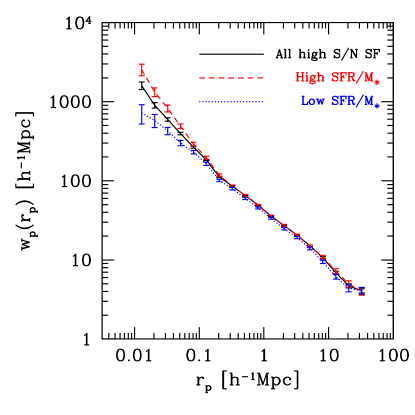
We first compute for our sample of high S/N star-forming galaxies from the SDSS DR4. In order to study how this depends on star formation rate (SFR), we rank all the high S/N star-forming galaxies according to the values of their specific star formation rates (SSFR), , and define subsamples of ’high SSFR’ and ’low SSFR’ galaxies as those contained within the upper and lower 25th percentiles of the distribution of this quantity. The results are shown in Figure 1. The dashed (dotted) line corresponds to the high (low) SSFR subsample, while the solid line shows the result for the sample as a whole.
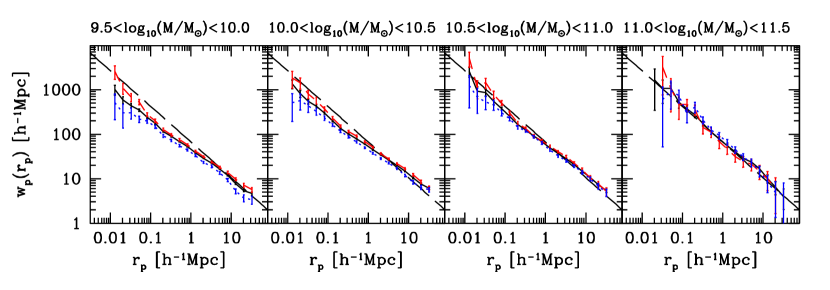
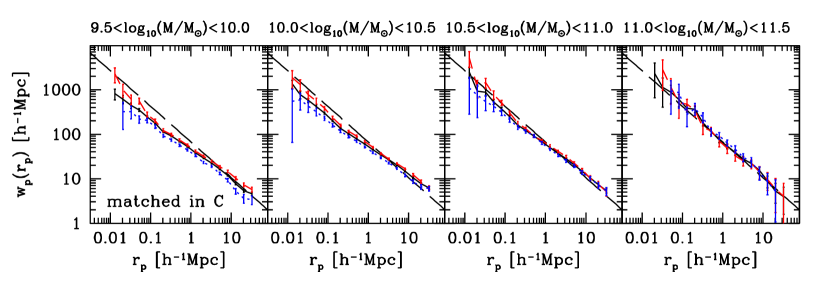
Figure 1 shows that galaxies with higher have stronger clustering on scales smaller than 0.1 Mpc and the effect becomes stronger at smaller projected separations. As pointed out by Li et al. (2006b), the clustering amplitude of galaxies depends on a variety of galaxy properties, including stellar mass and galaxy structure. If we wish to isolate the effect of the specific star formation rate, it is important that we make sure that the galaxy samples that we study are closely matched in terms of other properties, so that the effect on the star formation rate can be isolated. We have thus divided all the high S/N star-forming galaxies into four subsamples according to . For each subsample we repeat the clustering analysis as above. The results are shown in Figure 2. The four panels correspond to different intervals of . To guide the eye, a power law corresponding to a real-space 2PCF of is plotted as a long-dashed line in each panel. We see that the amplitude of increases for galaxies with larger stellar masses. This is consistent with our previous findings about the mass dependence of galaxy clustering. We also see that the difference in clustering between galaxies with high and low SFR/ on scales smaller than 0.1 Mpc is most pronounced in the lowest stellar mass interval. Next, in each of the four intervals, we match the three samples in concentration parameter by requiring that the distribution of is exactly the same as in each of these samples. The measurements for such matched samples are shown in Figure 3. The results are very similar to those shown in the previous figure.
We conclude that the small scale clustering dependences shown in Figure 1 are genuinely related to the differing specific star formation rates of the galaxies in the different samples. Galaxies with the highest specific star formation rates apparently have an excess of companions on scales less than 100 kpc when compared to the average star-forming galaxy. The fact that the increase in clustering occurs only on very small scales suggests that the excess star formation is being triggered by tidal interactions with these companions. Another intriguing result shown in these figures is that galaxies with low are less clustered on small scales. This suggests that there might be a continuous trend linking average number of close neighbours and .
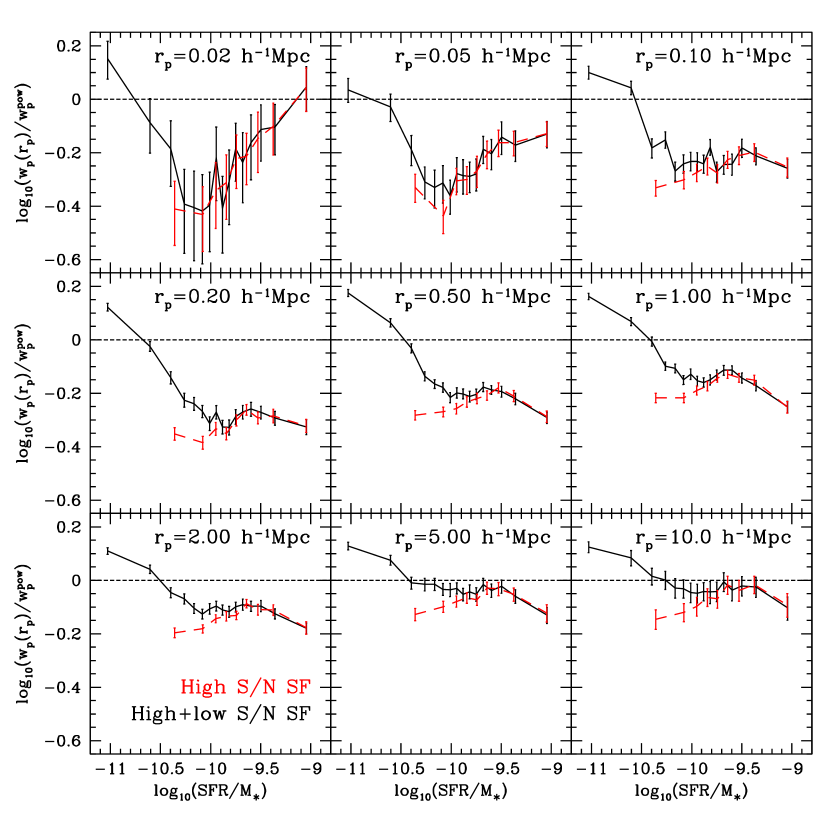
To investigate this in more detail, we calculate how the clustering amplitude depends on at a variety of different physical scales. The results are shown in Figure 4 (red dashed lines). One problem with the high S/N star-forming sample is that it does not extend to values much below . To extend our analysis to lower values, we include the sample of low S/N star-forming galaxies defined by Brinchmann et al. (2004). As discussed in section 2.2, the star formation rates in these galaxies are estimated from the H line luminosity, but the dust correction is quite uncertain because H is not usually detected with high S/N. Results where the low S/N star-forming galaxies have been included are plotted as black solid lines in Figure 4. As can be seen, extends down to values around for this sample.
On scales larger than 100 kpc, there is very little dependence of clustering amplitude on specific star formation rate for . At lower values of , the clustering amplitude increases. This is a manifestation of the strong relation between star formation and local density or environment. It is well-known that galaxies located in dense, massive structures such as clusters have lower specific star formation rates than “field” galaxies (e.g. Kauffmann et al., 2004). It is currently accepted that after a galaxy is accreted onto a larger structure, such as a group or cluster, its star formation rate will decline, either because its gas is removed by processes such as ram-pressure stripping, or simply because no further gas accretion takes place and the galaxy runs out of the fuel to make new stars.
On scales less than 100 kpc, the dependence of clustering amplitude on specific star formation rate is more complicated. At values of less than -10, we see the same increase in clustering amplitude that we saw on larger scales. This may appear somewhat surprising at first. In a recent paper, however, Barton et al. (2007) use cosmological simulations to show that a substantial fraction of galaxies selected as “close pairs” from surveys such as SDSS or 2DF, do in fact reside in very massive dark matter halos. Based on this work, we conjecture that the rise in clustering amplitude seen at all separations at low values of SFR/ rate is the result of star formation shutting down in galaxy groups and clusters. At values of greater than -10 and at separations less than kpc, the clustering amplitude shows a strong and continuous increase towards larger values of . This is a clear signal that mergers or interactions play an important role in triggering enhanced star formation in galaxies.
4 Star formation enhancement functions
In this section, we probe the relationship between star formation and galaxy interactions by quantifying the enhancement in star formation as a function of the projected separation between two galaxies. We also study how the enhancement depends on the physical properties of the main galaxy. We compute how the average value of changes as a function of the projected distance to the neighbours. From now on, we restrict our attention to the sample of high star-forming galaxies. These lie in low density environments where processes such as ram-pressure stripping, gas starvation etc should play a much less important role (see Figure 4).
The neighbours of a galaxy are identified using the photometric reference sample. The advantage of using the photometric sample is that the result is not affected by incompleteness (e.g. the effect of fibre collisions). However, the disadvantage is that some fraction of the close neighbours will not be true nearby systems, but rather chance projections of foreground and background galaxies that lie along the line-of-sight. We correct for this as follows: We count the number of companions in the photometric reference sample at a projected physical distance for each galaxy with a high S/N measure of the specific star formation rate . We also generate 10 random samples that have the same geometry as the photometric reference sample by randomizing the sky position of the photometric objects and keeping all the other quantities (e.g. the magnitudes) fixed. We use these random catalogues to estimate the mean number of projected companions expected at random around each galaxy. The true number of companions at separation is given by the difference between the observed and the projected random companion count. We then calculate a weighted average specific star formation rate at projected distance by weighting each galaxy by its true companion number. The enhancement in ), , is defined as the difference between the weighted average and the unweighted one. This can be written as
| (1) |
where is the specific star formation rate of the i’th galaxy, and and are the observed and projected random companion counts as described above.
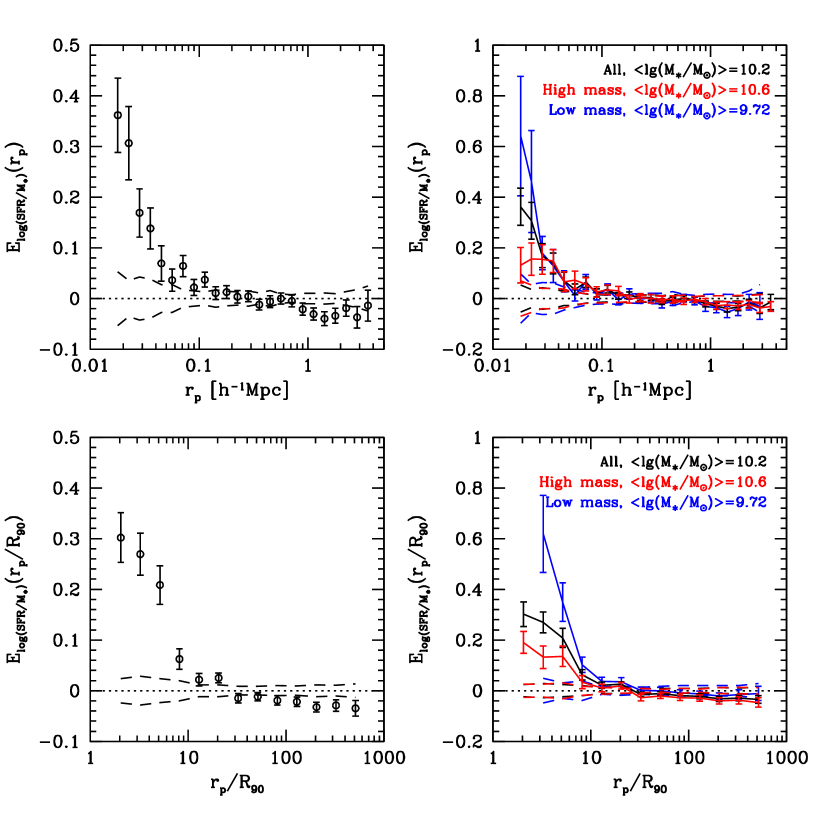
We first consider all high S/N star-forming galaxies with -band apparent magnitude in the range . To begin, we restrict the photometric reference sample to galaxies with -band magnitudes . In order to ensure that we are finding similar neighbours at all redshifts, we only consider neighbouring galaxies that are brighter than mag. The result is shown in Figure 5. The errors are estimated using Bootstrap resampling techniques. The dashed lines indicate the variance between 10 samples in which we randomize the sky positions of the star-forming galaxies.
The top left panel of Figure 5 gives the result for the sample as a whole. On scales larger than a Mpc or so is constant at a slightly but significantly negative value. This is because the average in equation 1 is pair-weighted, and galaxies in massive halos have lower specific star formation rates than average, but more ”companions” at large than average as a result of large-scale bias effects. On scales below about 100 kpc, increases sharply and reaches values corresponding to a factor of about two at projected separations less than 20 kpc. In the top right panel of Figure 5, we plot results for galaxies divided into two different ranges in stellar mass. These results show that there is a strong dependence of star formation enhancement on galaxy mass, in that star formation in small galaxies is more strongly enhanced at a given projected separation.
In the bottom panels, we scale the projected separation by the physical size of the galaxy. We use , the radius containing 90% of the total -band light, to calculate a scaled projected separation and recompute the enhancement function as a function of this scaled quantity. One can see that the results are quite similar. Star formation is enhanced at separations less than times the optical radius of the galaxy and the effect is stronger for lower mass systems.
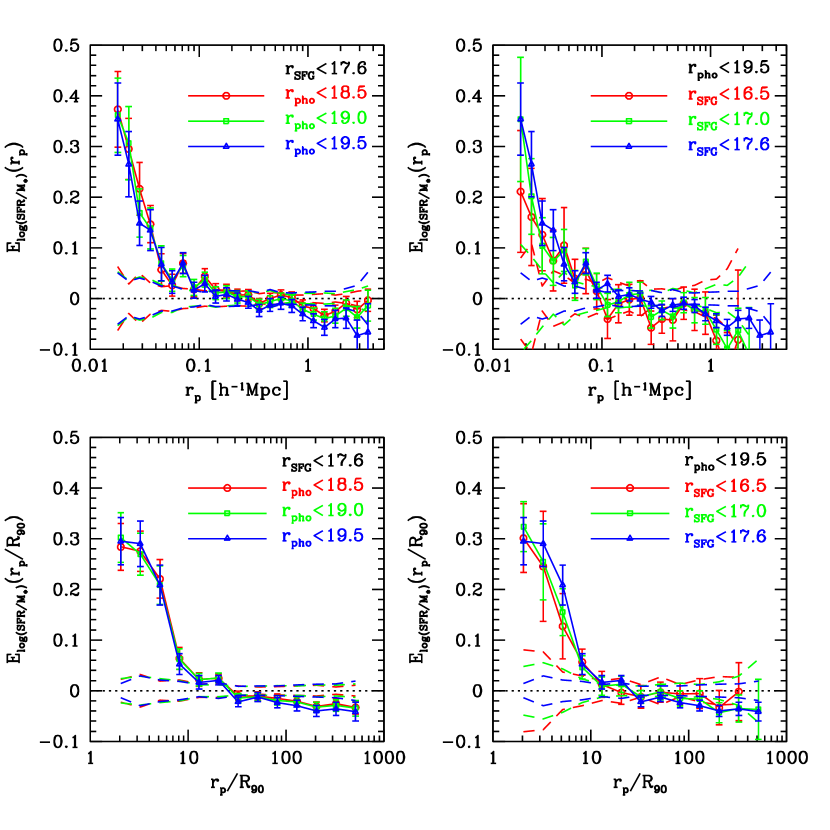
We now investigate the importance of the relative mass of the companion galaxy in determining the degree to which star formation is enhanced in the primary galaxy by analyzing galaxy samples with different limiting magnitudes. We first keep the magnitude limit of star-forming sample constant at , and explore what happens if we change the limiting magnitude of the reference sample. The results are plotted as circles for and as triangles for in the left-hand panels of Figure 6. The result shown in the previous figure is plotted as squares. Next, we fix the limiting magnitude of the reference sample at , but decrease the magnitude limit of the star-forming sample. The maximum allowed difference in magnitude between the star-forming galaxy and its companion is also increased accordingly. Results are shown for and . in the right-hand panels of Figure 6.
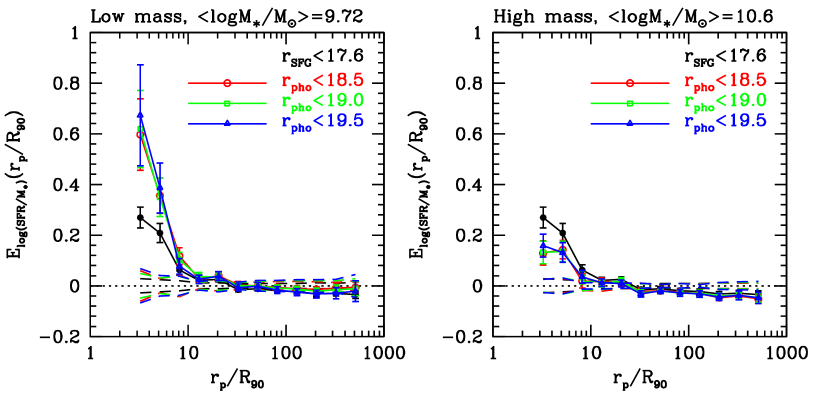
We see from Figure 6 that the star formation enhancement depends very little on the mass ratio between the star-forming galaxy and its companion. There are small changes in the expected direction (i.e. there is slightly less enhancement for companions with lower relative mass), but to first order the enhancement function remains remarkably constant for different mass ratios. In Figure 7, we divide the star-forming sample into two different stellar mass intervals and explore if our results change. We find that the enhancement function has very little dependence on the mass ratio of the companion for both low mass and high mass star-forming galaxies.
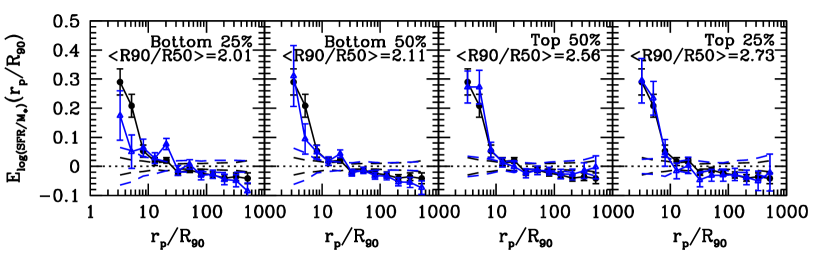
Finally, we investigate the enhancement function for galaxies with different structural properties. We divide all the high S/N star-forming galaxies into different intervals of concentration parameter and repeat the analysis described above for each of these subsamples. In Figure 8, we plot the results for star-forming galaxies with and for reference galaxies with . We see that the star formation enhancement does depend on , in that the galaxies with larger values are more strongly enhanced. One possible explanation for this effect is that interaction-induced starbursts occur when gas flows into the core of a galaxy, causing it to become more centrally concentrated (Sanders & Mirabel, 1996).
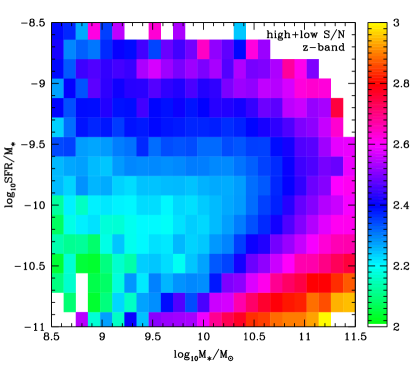
In Figure 9, we investigate how the concentration index of a star-forming galaxy depends on its location in the plane of specific star formation rate versus stellar mass. We see that at fixed stellar mass, the average concentration index is highest for galaxies that are currently experiencing both higher-than-average and lower-than-average rates of star formation. One interpretation of this plot is that tidal interactions cause gas to flow from the disk to the nucleus and this triggers a starburst at the centre of the galaxy. The formation of new stars in the central regions causes the concentration index to increase. The starburst is then followed by a period of relative quiescence, which lasts until the galaxy is able to accrete more gas into its disk. Formation of stars in the disk brings the galaxy back into the ”central plane” occupied by galaxies with in Figure 9. In the bottom-right corner of the plot, both stellar mass and concentration are high, but the specific star formation rate is low. This is the regime of early-type galaxies.
5 Close neighbour counts
In this section, we investigate whether tidal interactions are not only a sufficient, but also a necessary condition for a galaxy to experience enhanced star formation. We count the number of galaxies in the photometric sample in the vicinity of the star-forming galaxies and make a statistical correction for the effect of chance projections by subtracting the average count around randomly placed galaxies.
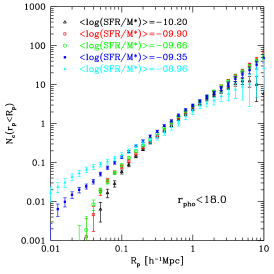
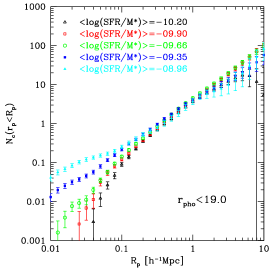
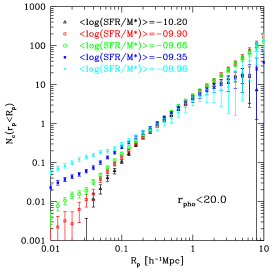
In Figure 10 we plot the average correlated neighbour count (i.e. after statistical correction for uncorrelated projected neighbours) within a given value of the projected radius . Results are shown for high S/N star-forming galaxies in different intervals of specific star formation rate. We have trimmed each subsample so that they each have the same distribution in redshift and in stellar mass . Panels from left to right correspond to photometric reference samples that are limited at and . The star-forming sample always has a limiting magnitude of 17.6.
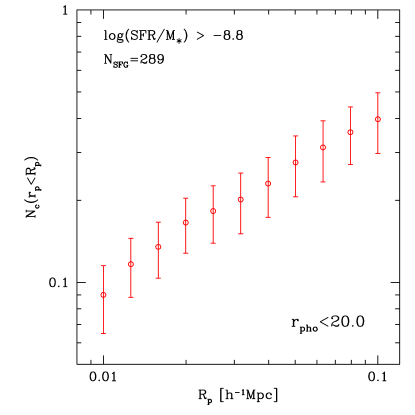
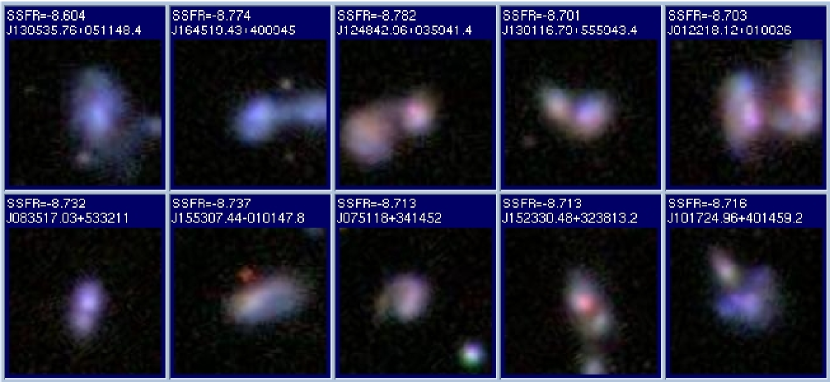
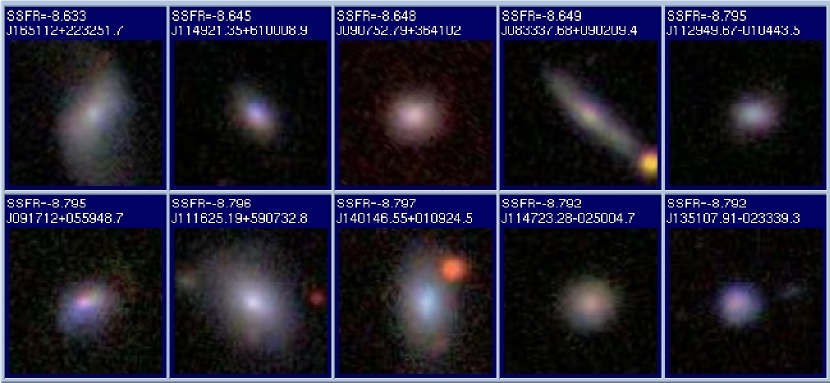
Figure 10 shows that the counts around the star-forming galaxies with different specific star formation rates match well on large scales. On scales smaller than kpc, there are strong trends in the number of neighbours as a function of SFR/; galaxies with higher star formation rates are more likely to have a near neighbour.
It is interesting that the average number of close neighbours around galaxies with low-to-average values of is close to zero on scales less than 20-30 kpc. On scales less than 100 kpc, only around 3% of the galaxies in the lowest SFR/ bin have a companion. This implies that tidal interactions that do not result in enhanced star formation are a rare occurrence. This is consistent with the findings of Di Matteo et al. (2007) who find that about 85% of their simulated sample of interacting galaxies show an enhancement in star formation by a factor 2. As the specific star formation rate increases, the average number of close neighbours also rises. Fifteen percent of galaxies in our highest SFR/ bin have a companion within 20-30 kpc and this rises to a value close to 30% if we consider companions within 100 kpc from the primary galaxy. In Figure 11, we show the result for 289 galaxies with the very highest specific star formation rates in our sample. The fraction of galaxies that have a companion within 100 kpc increases to values close to 40%. However, it is still true that not every star-bursting galaxy in our sample has a close companion.
How can we explain those galaxies with very high but no close neighbours? We have visually examined the SDSS -band images of 160 star-forming galaxies that are included in the highest subsample but have no companions within 50 kpc. We classified the systems according to whether or not they show clear signs of mergers or interactions, including double nuclei and tidal tails. Three of us (CL, GK and Roderik Overzier) did this independently to make sure that we obtained the same answer. We find that more than half of such galaxies show clear evidence of recent mergers. In Figure 12, we show some examples of our classifications. We thus conclude that, at least for galaxies with very high , interactions or mergers are the dominant mechanism for triggering and enhancing their star formation.
6 Effect of rich environments
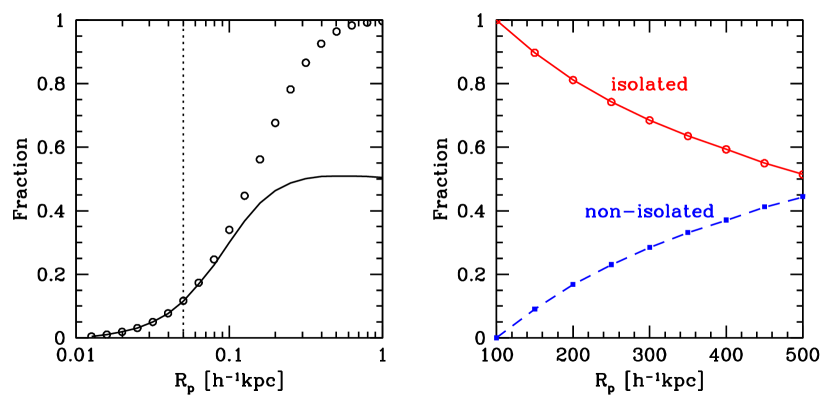
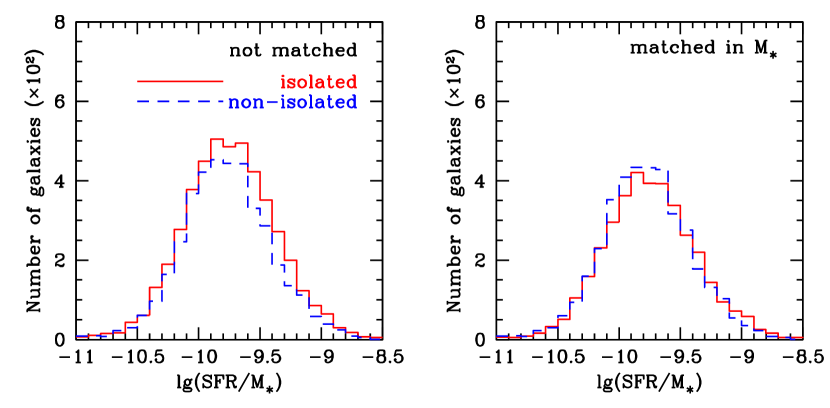
Fig. 5 (§ 4) shows that the enhancement in on large scales is not zero. Rather, it is constant at a small but significantly negative value. We have attributed this large-scale bias to the well-known anti-correlation of the star formation rates in galaxies with the richness of their local environment. The question then arises whether the star formation enhancements that we compute may not be a true reflection of the effect of galaxy-galaxy interactions, but may be biased because some close pairs are not real interacting systems, but are associated with group/cluster environments.
In order to address this problem, we have selected a sample of 9052 paired galaxies from all the high S/N star-forming galaxies. A galaxy is defined to be paired if it has at least one companion within a projected radius of 50 kpc in the photometric reference sample limited at . We use the the photometric sample rather than the sepectroscopic one to select pairs, so that the resulting sample is not biased to pairs with approximately equal masses. The maximum pair separation is chosen to yield a sample in which the contamination by chance projections is negligible. This is demonstrated in the left-hand panel of Fig. 13. The fraction of star-forming galaxies that have at least one companion in the photometric sample within a given projected radius is plotted as a function of as open circles, and is compared to the result (the solid line) after the number of companions is corrected with the help of random samples (see § 4 for details). As can be seen, at separations smaller than 50 kpc, the correction is negligible.
Next, We classify the paired galaxies as either “isolated” or “non-isolated” according to whether they have companions in the spectroscopic reference sample with projected separation in the range 100 kpc and velocity difference smaller than 500 km s-1. A galaxy is isolated if this ring-like region is completely empty. In contrast, a non-isolated galaxy is required to have at least one companion in the annulus that is brighter than that galaxy in the -band. The right-hand panel of Fig. 13 shows how the fraction of these two types of paired galaxies changes as the maximum separation increases. We see that the sample is always dominated by isolated pairs. However, even a small fraction of non-isolated galaxies may still change the enhancement function significantly, because the quantities defined in equation 1 are pair-weighted and galaxies in richer environment have more companions. In the left-hand panel of Fig. 14 we compare the distribution of specific star formation rates for the isolated and the non-isolated samples. The right-hand panel shows the results after the two samples are matched in stellar mass with each other (This is important because massive galaxies are more clustered than less massive galaxies (Li et al., 2006a)). As can be seen, the effect of a rich environment is quite small. The average specific star formation rate of the isolated sample differs from that of the non-isolated sample by 0.03 dex only. This is consistent with the findings of Balogh et al. (2004) who showed that the main effect of a dense environment on large scales is that the fraction of emission-line galaxies decreases, but that the distribution of equivalent widths of H among the star-forming population remains virtually constant. Here we show that the same thing holds for galaxies with close pairs. We thus conclude that the large-scale environment does not affect the measured star formation enhancements in our sample of high S/N star-forming galaxies on scales below 100 kpc.
7 Summary and Discussion
We find that the clustering amplitude of high S/N star-forming galaxies depends strongly on the specific star formation rate on scales less than 100 kpc. The clustering amplitude increases smoothly as a function of SFR/ and the increase in amplitude is largest at the smallest projected separations. We interpret this behaviour as the signature of tidal interactions, which lead to inflow of gas and an enhancement in star formation in the two interacting galaxies. At low values of SFR/, the clustering amplitude again increases. The increase occurs on all scales and probably reflects the fact that star formation in galaxies switches off after they are accreted onto larger structures such as groups and clusters.
We have explored how the average star formation rates of galaxies are enhanced as a function of the projected separation of their companions. The enhancement is a strong function of separation, increasing from zero at to factors of 1.5-4 at kpc. We find that the enhancement at given separation is stronger for lower mass galaxies. Remarkably, we find that the enhancement has almost no dependence on the relative luminosity of the companions.
The tidal force between two objects is expected to scale as and , where is the separation and is the mass ratio between the two objects, so it is perhaps not surprising that we see stronger star formation enhancement as a function of separation than as a function of mass ratio. Nevertheless, in this study, we find that the effect of a companion that is 3 magnitudes fainter than the primary galaxy is very similar to that of a companion that is only a factor of 3 less luminous than the primary. This is quite startling and is worthy of further investigation.
In order to explore whether tidal interactions are not only sufficient, but also a necessary condition for enhanced star formation in a galaxy, we have computed background subtracted neighbour counts around the galaxies in our sample. We find that the average number of galaxies around galaxies with low values of SFR/ is very small. At the very highest specific star formation rates, more than 40% of the galaxies in our sample have a companion within a projected radius of 100 kpc. Visual inspection of the high SFR/ galaxies without companions reveals that more than 50% of these are clear interacting or merging systems. We thus conclude that tidal interactions are the primary mechanism for inducing the highest rates of star formation in galaxies in the local Universe.
Finally, we find clear evidence that tidal interactions not only lead to enhanced star formation, but also cause structural changes in galaxies. Many of the most strongly star-forming galaxies in our sample have concentration indices similar to those of normal early-type galaxies. We note that the concentration index is measured for the -band light and not for the stellar mass, so more careful analysis is needed before one can definitely conclude that the interactions will result in the formation of a galaxy with a high bulge mass fraction. Nevertheless, we conclude that our results are in general accord with the theoretical picture first laid out by Toomre & Toomre (1972), which showed that galaxy interactions can lead to the growth of bulges and spheroids in galaxies.
Acknowledgements
CL is supported by the Joint Postdoctoral Programme in Astrophysical Cosmology of Max Planck Institute for Astrophysics and Shanghai Astronomical Observatory. CL and YPJ are supported by NSFC (10533030, 10643005, 10633020), by the Knowledge Innovation Program of CAS (No. KJCX2-YW-T05), and by 973 Program (No.2007CB815402). We are grateful to the referee for his/her comments which have helped to improve the paper, and Roderik Overzier for visually examining and classifying the images of our galaxies. CL, GK and SW would like to thank the hospitality and stimulating atmosphere of the Aspen Center for Physics while this work was being completed.
Funding for the SDSS and SDSS-II has been provided by the Alfred P. Sloan Foundation, the Participating Institutions, the National Science Foundation, the U.S. Department of Energy, the National Aeronautics and Space Administration, the Japanese Monbukagakusho, the Max Planck Society, and the Higher Education Funding Council for England. The SDSS Web Site is http://www.sdss.org/. The SDSS is managed by the Astrophysical Research Consortium for the Participating Institutions. The Participating Institutions are the American Museum of Natural History, Astrophysical Institute Potsdam, University of Basel, Cambridge University, Case Western Reserve University, University of Chicago, Drexel University, Fermilab, the Institute for Advanced Study, the Japan Participation Group, Johns Hopkins University, the Joint Institute for Nuclear Astrophysics, the Kavli Institute for Particle Astrophysics and Cosmology, the Korean Scientist Group, the Chinese Academy of Sciences (LAMOST), Los Alamos National Laboratory, the Max-Planck-Institute for Astronomy (MPIA), the Max-Planck-Institute for Astrophysics (MPA), New Mexico State University, Ohio State University, University of Pittsburgh, University of Portsmouth, Princeton University, the United States Naval Observatory, and the University of Washington.
References
- Adelman-McCarthy et al. (2006) Adelman-McCarthy J. K., Agüeros M. A., Allam S. S., Anderson K. S. J., Anderson S. F., Annis J., Bahcall N. A., Baldry I. K., et al., 2006, ApJS, 162, 38
- Arp (1966) Arp H., 1966, Atlas of peculiar galaxies. Pasadena: California Inst. Technology, 1966
- Baldwin et al. (1981) Baldwin J. A., Phillips M. M., Terlevich R., 1981, PASP, 93, 5
- Balogh et al. (2004) Balogh M., et al., 2004, MNRAS, 348, 1355
- Barnes & Hernquist (1992) Barnes J. E., Hernquist L., 1992, ARA&A, 30, 705
- Barrow et al. (1984) Barrow J. D., Bhavsar S. P., Sonoda D. H., 1984, MNRAS, 210, 19P
- Barton et al. (2007) Barton E. J., Arnold J. A., Zentner A. R., Bullock J. S., Wechsler R. H., 2007, ArXiv e-prints, 708
- Barton et al. (2000) Barton E. J., Geller M. J., Kenyon S. J., 2000, ApJ, 530, 660
- Bergvall et al. (2003) Bergvall N., Laurikainen E., Aalto S., 2003, A&A, 405, 31
- Blanton et al. (2003) Blanton M. R., Lin H., Lupton R. H., Maley F. M., Young N., Zehavi I., Loveday J., 2003, AJ, 125, 2276
- Blanton et al. (2005) Blanton M. R., Schlegel D. J., Strauss M. A., Brinkmann J., Finkbeiner D., Fukugita M., Gunn J. E., Hogg D. W., et al., 2005, AJ, 129, 2562
- Brinchmann et al. (2004) Brinchmann J., Charlot S., White S. D. M., Tremonti C., Kauffmann G., Heckman T., Brinkmann J., 2004, MNRAS, 351, 1151
- Brosch et al. (2004) Brosch N., Almoznino E., Heller A. B., 2004, MNRAS, 349, 357
- Bushouse (1986) Bushouse H. A., 1986, AJ, 91, 255
- Bushouse et al. (1988) Bushouse H. A., Werner M. W., Lamb S. A., 1988, ApJ, 335, 74
- Cox et al. (2006) Cox T. J., Jonsson P., Primack J. R., Somerville R. S., 2006, MNRAS, 373, 1013
- Di Matteo et al. (2007) Di Matteo P., Combes F., Melchior A. ., Semelin B., 2007, ArXiv Astrophysics e-prints
- (18) Ellison S. L., Patton D. R., Simard L., McConnachie A. W., 2008, submitted
- Fukugita et al. (1996) Fukugita M., Ichikawa T., Gunn J. E., Doi M., Shimasaku K., Schneider D. P., 1996, AJ, 111, 1748
- Gunn et al. (1998) Gunn J. E., Carr M., Rockosi C., Sekiguchi M., Berry K., Elms B., de Haas E., Ivezić Ž., et al., 1998, AJ, 116, 3040
- Gunn et al. (2006) Gunn J. E., Siegmund W. A., Mannery E. J., Owen R. E., Hull C. L., Leger R. F., Carey L. N., Knapp G. R., et al., 2006, AJ, 131, 2332
- Hogg et al. (2001) Hogg D. W., Finkbeiner D. P., Schlegel D. J., Gunn J. E., 2001, AJ, 122, 2129
- Ivezić et al. (2004) Ivezić Ž., Lupton R. H., Schlegel D., Boroski B., Adelman-McCarthy J., Yanny B., Kent S., Stoughton C., et al., 2004, Astronomische Nachrichten, 325, 583
- Kapferer et al. (2005) Kapferer W., Knapp A., Schindler S., Kimeswenger S., van Kampen E., 2005, A&A, 438, 87
- Kauffmann et al. (2004) Kauffmann G., White S. D. M., Heckman T. M., Ménard B., Brinchmann J., Charlot S., Tremonti C., Brinkmann J., 2004, MNRAS, 353, 713
- Keel (1991) Keel W. C., 1991, in Combes F., Casoli F., eds, Dynamics of Galaxies and Their Molecular Cloud Distributions Vol. 146, Star Formation and Galaxy Interactions. pp 243–+
- Keel et al. (1985) Keel W. C., Kennicutt Jr. R. C., Hummel E., van der Hulst J. M., 1985, AJ, 90, 708
- Kennicutt et al. (1987) Kennicutt Jr. R. C., Roettiger K. A., Keel W. C., van der Hulst J. M., Hummel E., 1987, AJ, 93, 1011
- Lambas et al. (2003) Lambas D. G., Tissera P. B., Alonso M. S., Coldwell G., 2003, MNRAS, 346, 1189
- Larson & Tinsley (1978) Larson R. B., Tinsley B. M., 1978, ApJ, 219, 46
- Li et al. (2006a) Li C., Kauffmann G., Jing Y. P., White S. D. M., Börner G., Cheng F. Z., 2006a, MNRAS, 368, 21
- Li et al. (2006b) Li C., Kauffmann G., Wang L., White S. D. M., Heckman T. M., Jing Y. P., 2006b, MNRAS, 373, 457
- Lupton et al. (2001) Lupton R., Gunn J. E., Ivezić Z., Knapp G. R., Kent S., 2001, in Harnden Jr. F. R., Primini F. A., Payne H., eds, Astronomical Data Analysis Software and Systems X Vol. 238, The SDSS Imaging Pipelines. pp 269–+
- Meza et al. (2003) Meza A., Navarro J. F., Steinmetz M., Eke V. R., 2003, ApJ, 590, 619
- Mihos & Hernquist (1996) Mihos J. C., Hernquist L., 1996, ApJ, 464, 641
- Negroponte & White (1983) Negroponte J., White S. D. M., 1983, MNRAS, 205, 1009
- Nikolic et al. (2004) Nikolic B., Cullen H., Alexander P., 2004, MNRAS, 355, 874
- Pier et al. (2003) Pier J. R., Munn J. A., Hindsley R. B., Hennessy G. S., Kent S. M., Lupton R. H., Ivezić Ž., 2003, AJ, 125, 1559
- Sanders & Mirabel (1996) Sanders D. B., Mirabel I. F., 1996, ARA&A, 34, 749
- Sanders et al. (1986) Sanders D. B., Scoville N. Z., Young J. S., Soifer B. T., Schloerb F. P., Rice W. L., Danielson G. E., 1986, ApJL, 305, L45
- Schlegel et al. (1998) Schlegel D. J., Finkbeiner D. P., Davis M., 1998, ApJ, 500, 525
- Smith et al. (2007) Smith B. J., Struck C., Hancock M., Appleton P. N., Charmandaris V., Reach W. T., 2007, AJ, 133, 791
- Smith et al. (2002) Smith J. A., Tucker D. L., Kent S., Richmond M. W., Fukugita M., Ichikawa T., Ichikawa S.-i., Jorgensen A. M., et al., 2002, AJ, 123, 2121
- Solomon & Sage (1988) Solomon P. M., Sage L. J., 1988, ApJ, 334, 613
- Springel (2000) Springel V., 2000, MNRAS, 312, 859
- Stoughton et al. (2002) Stoughton C., Lupton R. H., Bernardi M., Blanton M. R., Burles S., Castander F. J., Connolly A. J., Eisenstein D. J., et al., 2002, AJ, 123, 485
- Strauss et al. (2002) Strauss M. A., Weinberg D. H., Lupton R. H., Narayanan V. K., Annis J., Bernardi M., Blanton M., Burles S., et al., 2002, AJ, 124, 1810
- Struck (1999) Struck C., 1999, Physics Report, 321, 1
- Tinney et al. (1990) Tinney C. G., Scoville N. Z., Sanders D. B., Soifer B. T., 1990, ApJ, 362, 473
- Tissera et al. (2002) Tissera P. B., Domínguez-Tenreiro R., Scannapieco C., Sáiz A., 2002, MNRAS, 333, 327
- Toomre & Toomre (1972) Toomre A., Toomre J., 1972, ApJ, 178, 623
- Tucker et al. (2006) Tucker D. L., Kent S., Richmond M. W., Annis J., Smith J. A., Allam S. S., Rodgers C. T., Stute J. L., et al., 2006, Astronomische Nachrichten, 327, 821
- Woods & Geller (2007) Woods D. F., Geller M. J., 2007, AJ, 134, 527
- Woods et al. (2006) Woods D. F., Geller M. J., Barton E. J., 2006, AJ, 132, 197
- York et al. (2000) York D. G., Adelman J., Anderson Jr. J. E., Anderson S. F., Annis J., Bahcall N. A., Bakken J. A., Barkhouser R., et al., 2000, AJ, 120, 1579
- Young et al. (1996) Young J. S., Allen L., Kenney J. D. P., Lesser A., Rownd B., 1996, AJ, 112, 1903
- Young et al. (1986) Young J. S., Kenney J. D., Tacconi L., Claussen M. J., Huang Y.-L., Tacconi-Garman L., Xie S., Schloerb F. P., 1986, ApJL, 311, L17