via di Santa Marta 3, 50139 Firenze, Italy 22institutetext: CSDC, Centro interdipartimentale per lo Studio di Dinamiche Complesse, Università degli Studi di Firenze, Italy 33institutetext: INFN, Sez. Firenze
Abstract
We present a method for measuring the distance among records based on the correlations of data stored in the corresponding database entries. The original method (F. Bagnoli, A. Berrones and F. Franci. Physica A 332 (2004) 509-518) was formulated in the context of opinion formation. The opinions expressed over a set of topic originate a “knowledge network” among individuals, where two individuals are nearer the more similar their expressed opinions are. Assuming that individuals’ opinions are stored in a database, the authors show that it is possible to anticipate an opinion using the correlations in the database. This corresponds to approximating the overlap between the tastes of two individuals with the correlations of their expressed opinions.
In this paper we extend this model to nonlinear matching functions, inspired by biological problems such as microarray (probe-sample pairing). We investigate numerically the error between the correlation and the overlap matrix for eight sequences of reference with random probes. Results show that this method is particularly robust for detecting similarities in the presence of traslocations.
Keywords:
knowledge network, microarray1 Introduction
Cluster analysis is used to classify a set of items into two or more mutually exclusive groups based on combinations of internal variables. The goal of cluster analysis is to organize items into groups in such a way that the degree of similarity is maximized for the items within a group and minimized between groups.
Clustering problems arise in various domains of science, for example in opinion formation, microarray analysis and antibody-antigens systems.
In opinion formation, one can assume that one’s opinion on a certain item is given by the characteristics of the item, weighted by individual “tastes”. The tastes result from past experiences, but they do not change abruptly from time to time. In principle, tastes can be decomposed into independent “dimensions”. It is rather difficult to identify such dimensions, as testified by the limited success of market campaigns. However, it can be shown [1] that exploiting the correlations among the expressed opinions, it is possible to deduce the distance between the tastes of two individuals.
A DNA microarray is a collection of microscopic DNA spots of probes, commonly complementary to some region of a gene, arrayed on a solid surface by covalent attachment to a chemical matrix. DNA arrays are commonly used for expression profiling, namely monitoring expression levels of thousands of genes simultaneously, or for comparative genomic hybridization. Gene expression microarray experiments can generate data sets with multiple missing expression values. However, many algorithms for gene expression analysis require a complete matrix of gene array values as input, and may lose effectiveness even with a few missing values. Methods for imputing missing data are needed, therefore, to minimize the effect of incomplete data sets on analyses, and to increase the range of data sets to which these algorithms can be applied [2]. Moreover, comparison between a “forecasted ” value based on correlations in the dataset, and the measured one, can be considered a consistency “check” of the dataset itself.
Antibodies are proteins that are used by the immune system to identify and neutralize foreign objects, such as bacteria and viruses. Classifying antibodies, based on the similarity of their binding to the antigens, is essential for progress in immunology and clinical medicine.
A striking feature of the natural immune system is its use of negative detection in which “self” is represented (approximately) by the set of circulating lymphocytes that fail to match self. This suggests the idea of a negative representation, in which a set of data elements is represented by its complement set. That is, all the elements not in the original set are represented (a potentially huge number), and the data itself are not explicitly stored. This representation has interesting information-hiding properties when privacy is a concern and it has implications for intrusion detection. One of the example where this idea has been concretised is the case of a negative database [3].
In a negative database, the negative image of a set of data records is represented rather than the records themselves. Negative databases have the potential to help prevent inappropriate queries and inferences. Under this scenario, it is desirable that the database supports only the allowable queries while protecting the privacy of individual records, say from inspection by an insider. A second goal involves distributed data, where one would like to determine privately the intersection of sets owned by different parties. For example, two or more entities might wish to determine which of a set of possible ”items” (transactions) they have in common without reveling the totality of the contents of their database or its cardinality.
In this paper we use the microarray example to test the introduction of nonlinearities in the computation. Since in our model a datum is essentially stored as the set of matching items plus the set of nonmatching ones, our results can be applied both to positive and negative representation of data.
2 Matching model
Let us first illustrate the problem summarizing the main results reported in [1].
Consider a population of individuals experiencing a set of products. Assume that each product is characterized by an -dimensional array of features, while each individual has the corresponding list of personal tastes on the same features . The opinion of individual on product , denoted by , is defined proportional to the scalar product between and : , where is a suitably chosen normalization factor. In general, should scale as and depend on the ranges of and .
In order to predict whether the person will like or dislike a certain product , assuming to know , it is sufficient to obtain the individual tastes of that individual, i.e. the vector . The similarity between tastes of two individuals and is defined by the overlap between the preferences and .
One can build a knowledge network among people, using the vectors as nodes and the overlaps as edges. Maslov and Zhang [4] (MZ) assume that a fraction of these overlaps are known. They show that there are two important thresholds for in order to be able to reconstruct the missing information. The first one is a percolation threshold, reached when the fraction of edges is greater than where is the number of people. This means that there must be at least one path between two randomly chosen nodes, in order to be able to predict the second node starting from the first one.
Since vectors lie in an dimensional space, and a single link “kills” only one degree of freedom, a reliable prediction needs more than one path connecting two individuals. Maslov and Zhang show that there is a “rigidity” threshold , of the order of , such that for the mutual orientation of vectors in the network is fixed, and the knowledge of the preferences of just one person is sufficient to reconstruct those of all the other individuals.
In general one does not have access to individuals’ preferences, nor one knows the dimensionality of this space. In order to address this problem, the authors define the correlation between the opinions of agents and by
| (1) |
where is the average of the opinion matrix over column . The elements can be conveniently stored in a opinion correlation matrix .
One can compute an accurate opinion anticipation of a true value using this formula:
| (2) |
where is a factor that in general depends on and on the statistical properties of the hidden components. However, if the components of and are independent random variables, is independent of and , so it can be simply chosen in order to have defined over the same interval as .
For large values of and , the factor can be identified with the number of components , and obtain an estimate for the average prediction error
| (3) |
where
| (4) |
Formula (3) implies that the predictive power of Eq. (2) grows with and diminishes with . This fact is a consequence of the decay of the correlations among opinions with , so that more amount of information is needed in order to perform a prediction as grows. This condition can be compared with the “rigidity” threshold in the MZ analysis.
3 Test case microarray inspired
In order to investigate the introduction of nonlinearities in the function used to model the process of opinion formation, we considered the case of a microarray.
As mentioned in section 1, microarray experiments can suffer from the missing values, and this fact represents a problem for many data analysis methods, which require a complete data matrix. Although existing missing value imputation algorithms have shown good performance to deal with missing values, they also have their limitations. For example, some algorithms have good performance only when strong local correlation exists in data, while some provide the best estimate when data is dominated by global structure [5].
Here we modified the model described in the previous section to investigate the relationship between the correlation and the overlap between sequences.
To do this we considered an alphabet of four symbols, namely A, T, G, C, corresponding to the four nucleotides that constitute the DNA. We used this alphabet to generate randomly sequences of length representing the probes of the microarray111The probes in real microarray are discriminated generally carefully chosen in order to genes of interest.. Then we generated samples of length representing the sequences to be hybridized on the microarray.
The correlation between sample and sample is defined by
| (5) |
where is the maximum complementary match between sample and probe without gaps.
The aim is to test the relationship between the correlation matrix and the overlap matrix constructed using the following idea of similarity. We hypothesized to infer the similarity between sequences based on the number of subsequences of length in common. For this reason we defined the overlap between sequence and sequence as the number of subsequences of length that appear in the both sequences, divided by for normalization. This matching function is nonlinear since the effect of a mismatch depends on its position in the subsequence.
To test our hypothesis, we considered eight referential sequences:
- Seq. 0:
-
This is the first reference sequence, completely random of length .
- Seq. 1:
-
Equal to sequence 0, except for a mutation in the middle (this mimics the Affimetrix central mismatch mechanism for measuring the level of random pairing).
- Seq. 2:
-
Equal to sequence 0, but shifted of one basis.
- Seq. 3:
-
Equal to sequence 0, with shift and central mutation.
- Seq. 4:
-
First half of sequence 4 is equal to the second half of sequence 0, and vice versa.
- Seq. 5:
-
First half of sequence 0 is equal to the second half of sequence 0, the rest is random.
- Seq. 6:
-
Another reference sequence.
- Seq. 7:
-
Sequences 6 and 7 contains the same “gene”, of length , in different positions.
4 Results
To check the validity of the model described in the previous section, we measured the error for the pair of sequences and defined as the absolute value of the difference between the correlation and the overlap, namely . We performed various simulations and than we calculated the average of the error denoted by .
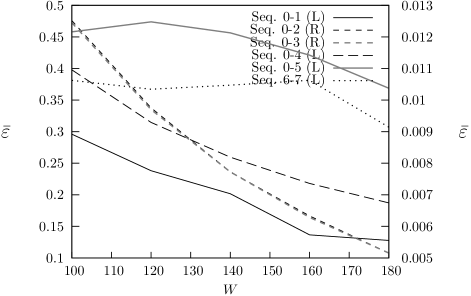
In figure 1 we plotted the error vs . One can see that for all the analysed cases the error decreases, and this result agrees with those reported in [1] (the parameter here corresponds to in the opinion formation model).
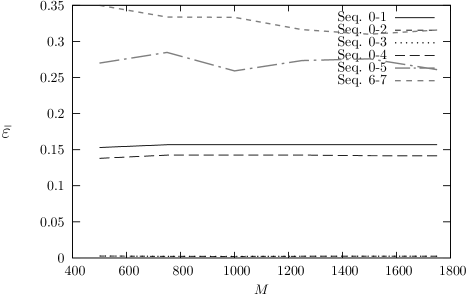
Figure 2 shows the behaviour of with respect to . The curves are approximately constant, showing that the error is independent of .
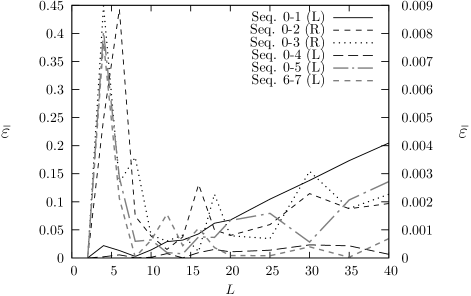
As one can see from figure 3, where we plotted the error vs , does not follow a monotonous trend, except for the pair of sequences 0-4 for which the value of is almost constant and next to zero, and for which increases. For what concerns the values of , and , one can detect that the errors decrease until , because probes too short can hybridize in many positions without a high specificity. Then they oscillate until , and for larger the errors increase. This last increase is due to the small coverage of the probes in the sequence space, since we kept the number of sequences fixed while the sequence space grows as .
5 Comments
We have proposed a method for measuring the distance among records based on the correlations of data stored in the corresponding database. We applied the method to the case of a microarray modifying the model introduced in [1] with a nonlinear matching function. More precisely, we measured the similarity between sequences based on the number of subsequences of length (the length of probes) in common.
We monitored the error for eight sequences of reference, with respect to , , and . We find that the error is low in all cases, decreasing when increase, and independent of . With respect to we find that the model is more robust for traslocation.
In conclusion we can say that the correlation matrix of our model can be used to estimate the distance between sequences. Moreover we point out that the same result can be found following the idea of negative database, namely using the subsequences of length not in common between two sequences.
References
- [1] F. Bagnoli, A. Berrones, and F. Franci. De gustibus disputandum (forecasting opinions by knowledge networks). Physica A, 332:509–518, 2004.
- [2] O. Troyanskaya, M. Cantor, G. Sherlock, P. Brown, T. Hastie, R. Tibshirani, D. Botstein, and R. Altman. Missing value estimation methods for dna microarrays. Bioinformatics, 17:520–525, 2001.
- [3] Fernando Esponda, Elena S. Ackley, Paul Helman, Haixia Jia, and Stephanie Forrest. Protecting data privacy through hard-to-reverse negative databases. In Springer LNCS, editor, In proceedings of the 9th Information Security Conference (ISC’06), pages 72–84, 2006.
- [4] S. Maslov and Y. C. Zhang. Extracting hidden information from knowledge networks. Physical Review Letters, 87:248701, 2001.
- [5] X. Gan, A. W. C. Liew, and H. Yan. Microarray missing data imputation based on a set theoretic framework and biological knowledge. Nucleic Acids Research, 34:1608–1619, 2006.