Cosmic ray spectrum by energy scattered by EAS particles in the atmosphere and galactic model
Abstract
The differential energy spectrum of cosmic rays from Cherenkov radiation measurements in EAS in the energy range of eV has been compared with an anomalous diffusion model for the particles in interstellar space having fractal properties (Lagutin et al., 2001). The close association between experimental data and calculated “all particle” spectra in form at eV is found. In this case, the average mass composition of cosmic rays calculated by five components does not contradict the average mass composition from experimental data which was obtained by several of EAS characteristics in that energy region.
I Introduction
The discovery of irregularities in the cosmic ray energy spectrum at the energy of eV (Khristiansen et al., 1956 1 ) and eV (Krasilnikov et al., 1978 2 ; 3 ; 4 ), the detection of sharp decreases in the cosmic ray intensity at eV (Greisen-Zatsepin-Kuzmin effect, 1966 5 ; 6 ) at the EAS arrays in Yakutsk, HiRes (USA), AUGER (Argentina) are the most important achievement in the investigation of the superhigh and ultrahigh energy cosmic rays in recent years. Such a character of spectrum turn out to be associated directly with processes in interstellar space, namely, with the origin, acceleration and propagation of cosmic rays in the Galaxy and beyond. The interpretation of these experimental facts using the different models of cosmic ray origin still remains to be answered.
II Method to construct the EAS spectrum
The showers at the Yakutsk array are selected with the central register by both scintillation and Cherenkov “masters” 10 ; 11 . The all showers registered form the database of the Yakutsk EAS array.
To construct the spectrum in energy, scattered by EAS particles in the atmosphere (Cherenkov radiation) the following selection criteria of showers are used: a) a shower core is to be placed within a perimeter of the array for the giant showers and near a center of the array for the showers with eV. The showers whose cores are near the observation station m are excluded from a sampling: b) the probability to register a shower by Cherenkov photons is ; c) a zenith angle is less than one-half of an aperture of Cherenkov detector, i.e. in the case of the detector of the first type and for the second type detector; d) a transmission coefficient of the atmosphere is for the wave length of nm.
Thus, more than 60000 showers with eV and 300000 showers with eV were recorded in the database. To construct the spectrum, the showers were selected by the classification parameter , i.e. by Cherenkov light flux density at a distance 150 m from a core, which was proportional to the primary shower energy. The measurement accuracy for in the individual showers was %.
The estimation of the shower energy is determined by a quasicalorimetric method which does not depend on the EAS development model. A basis of the method is experimental data about the Cherenkov light total flux, , the total number of charged particles, , and the total number of muons with , 12 ; 13 ; 14 . The energy of individual showers is determined by the following formula:
| (1) |
The intensity of cosmic ray flux in the given interval of EAS classification parameter is found as a ratio of the number of registered EAS events to .
III Results and Discussion
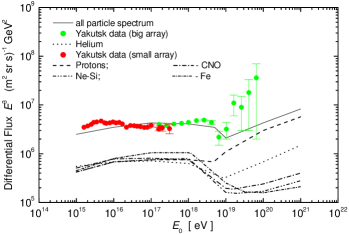
The differential energy spectrum of primary cosmic rays in the interval of eV obtained from a totality of the all Cherenkov detector measurement data at the Yakutsk EAS array is shown on the Fig. 1. Our data confirm an irregularity of the spectrum of “knee” type in the energy range of eV discovered in 1 , and the irregularity of “ankle” type at eV. It is established that in the first case the spectrum index is below the break and eV, and in the second case, the more sloping spectrum with at eV is observed.
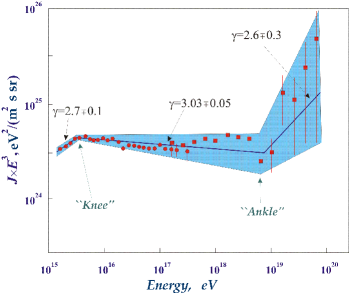
For the period of continuous observations of Cherenkov radiation more than 30 years (10% relative to one year time of EAS registration with the scintillation detectors), the showers with eV did not detect. This fact confirms once more the GZK hypothesis 5 ; 6 about the sharp break in the cosmic ray energy spectrum at eV.
The galactic model
The attempt to explain a form of obtained spectrum from the point of view of cosmic ray anomalous diffusion model and fractality of the Galaxy’s magnetic field was made by Lagutin et al 9 . The basis for the cosmic ray propagation in the Galaxy is the following assumptions: a) after the generation in the sources, the particles move in fractal interstellar medium by means of two ways: the first way is “Levy flights”, the second way is the motion along a spiral in the nonhomogeneous magnetic field, ) the particles exist during anomalous long time. The lifetime of particles is of a wide distribution and its tail is described by a power law (so-called “Levy trapping time”). Calculations of the spectrum were separately made for each of following groups of nuclei: p, He, CNO, N-Si, Fe. The resulting sum spectrum for the all particles is shown by a solid curve in Fig. 1. From the calculations it follows that the suggested model reproduces the irregularity in the energy spectrum of the “knee” type at eV and also the irregularity of the “ankle” type at eV. This model does not explain the behavior of a spectrum in the energy region of eV and the break of the spectrum at eV in more detail. The mass composition in the energy region of eV is some heavier than at eV, but this change is not very significant that is expected from an experiment (see Fig. 3).
The galactic model with the sources of two types
In contrast to 9 , in the paper 15 a scenario is considered, in which supernovae are the main sources of cosmic rays and the acceleration up to GeV takes place in the shock fronts. The particle spectrum formed in this case can be presented in the form of , where the Heaviside function reflects qualitatively the presence of a sharp cut-off in the spectrum at 16 ; 17 . The new calculations fulfilled by the above scenario of particle generation in the sources of two different types under the assumption of anomalous diffusion of particles in inhomogeneous medium show that at some parameters the anomalous diffusion model describes satisfactorily the features of cosmic ray energy spectrum and mass composition up to eV observed in an experiment. First of all, it refers to the fine structure of cosmic ray intensity change depending on the energy (see Fig. 1). By using these calculations, the sharp peaks in the mass composition depending on energy are also observed (see Fig. 3). In this connection, it is of interest to compare calculations in mass composition with experimental data obtained at the Yakutsk EAS big and small Cherenkov sub-arrays in recent years.
Mass composition of primary cosmic rays
Fig. 3 presents the results in mass composition of primary cosmic rays of the Yakutsk array. The data were obtained in the framework of QGSJET-01 model and two-component mass composition (proton-iron nucleus). The several characteristics corresponding to the radial and longitudinal development of EAS are used in the analysis 18 ; 19 ; 20 ; 21 ; 22 .
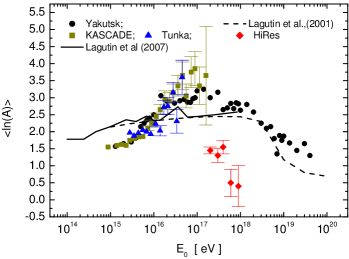
The value in each case is determined by using the interpolation method 24 . It is seen from Fig. 3 that the mass composition is varied up to heavy elements in the energy region of eV and becomes more light beginning with eV.
The lines are the calculations according to the anomalous diffusion model for the propagation of cosmic rays in the Galaxy (Fig. 3, two sources) in the case of inhomogeneous galactic medium. In the first case, the monotone change in the mass composition up to eV is observed, after of which the mass composition becomes more light. In the second case, the complicated structure in the dependence of mass composition on the energy is observed, peaks for the nuclei of different mass in the energy region of eV are noticeable. According to a hypothesis 25 and calculations from 15 , such an inhomogeneous structure can be formed by a near supernova. Our data (Fig. 3) do not contradict to this hypothesis.
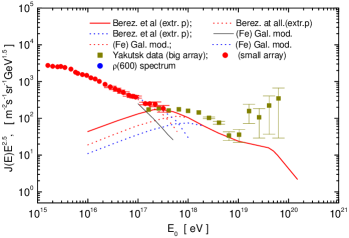
Such a sharp change of the mass composition in the energy region of eV is not explained in the framework of the galactic model and is likely associated with the existence of a transition boundary from galactic to metagalactic cosmic rays. This conclusion is confirmed by calculations from 23 , where a scenario of galactic and metagalactic origin of cosmic rays is considered. These calculations are shown in Fig.4 together with our experimental data. It can be seen from Fig. 4 that cosmic rays in the energy region of eV are most likely of galactic origin with the noticeable portion of heavy nuclei in the total flux.
It should be noted the estimations of cosmic ray mass composition in the region after the “knee”, obtained at the compact arrays, agree well with each other. The same cannot be said of the energy region of eV (see Fig. 3) where HiRes array data point to more speedy enrichment of primary radiation by the light nuclei and protons as compared with the Yakutsk array data. The Yakutsk EAS array data, on the contrary, show the gradual change from the heavy to light composition (protons and He nuclei) at eV. In both cases, data point to the existence of the tendency of “protonization” of primary cosmic rays at eV.
Conclusions
Direct measurements of the cosmic ray energy spectrum in the region of ultrahigh energies (in energy scattered by EAS particles in the atmosphere) have confirmed the complicate form of spectrum. The spectrum becomes steeper at eV and more sloping at eV. A character of energy dependence of by the Yakutsk EAS data point to the change of the mass composition of primary particles at singular points of cosmic ray energy spectrum. The value rises with the energy after the “knee” up to its maximum equal to at eV and then it begins to decrease. Such an energy dependence of does not contradict a hypothesis of cosmic rays propagation according to laws of the anomalous diffusion model in fractal interstellar medium (Lagutin et al., 2001). The value at eV decreases gradually and at eV the mass composition consists of He nuclei and protons. The cosmic ray intensity beyond eV decreases sharply and this effect is not described in the framework of the galactic model only. Such a character of spectrum does not contradict to the calculations by Berezinsky et al 23 for the metagalactic model, in which the “ankle”, observed in the experiments on ultrahigh energy cosmic ray registration, can be produced by the proton component only arriving from the Metagalaxy. Thereby, the details of experimental spectrum form, for example, “dip”, i.e. the decrease of intensity at eV, are caused by, most likely, the interaction of extragalactic protons with a relic radiation photons (). As a direct argument of this hypothesis, the anisotropy can be used which is related to the origin and sources of cosmic rays. Based on data of 26 ; 27 ; 28 , at eV the weak correlation in the arrival directions of EAS with the Galaxy plane and the close correlation with the Supergalaxy plane are observed and that the quasars can be the possible sources of cosmic rays.
References
- (1) S. N. Vernov et al. Cosmic rays and cosmophysical problems. Novosibirsk: SB AS USSR, 1964. pp. 103–110 (in Russian).
- (2) M. N. Dyakonov et al. // Izv. AN USSR. Ser. fiz., 42, 1449. 1978 (in Russian).
- (3) G. Cunningham et al., Ap. J. 236, L75 (1980).
- (4) D. D. Krasilnikov et al. Cosmic rays with energy above eV. Yakutsk: YaFSO AN USSR, 1983. pp. 117–143; D. D. Krasilnikov et al. // Izv. AN USSR. Ser. fiz. 49. 1321. 1985 (in Russian).
- (5) K. Greisen, // Phys. Rev. Lett. 16, 748 (1966).
- (6) G. T. Zatsepin and V.A. Kuzmin. // JETP Lett. 4, 78 (1966).
- (7) S. P. Knurenko et al. // Proc. 27th ICRC (Hamburg), 2001. v. 1. pp. 145–147.
- (8) A. A. Ivanov et al. // Nucl. Phys. B (Proc. Suppl.) 122 (2003) 226–230.
- (9) A. A. Lagutin et al. // Nucl. Phys. B (Proc. Suppl.) 97 (2001). 267–270; A. A. Lagutin et al. // Proc. 27th ICRC (Hamburg), 2001. V.5. pp.1896–1899.
- (10) V. P. Artamonov et al. // Izv. АN USSR. Ser. fiz. 58. 92. 1994 (in Russian).
- (11) S. P. Knurenko et al. // Nauka i Obrasovaniye. 1998, No. 4. pp. 47–50 (in Russian).
- (12) M. N. Dyakonov et al. Cosmic radiation of ultrahigh energies. Novosibirsk: Nauka (1991), 252 p. (in Russian).
- (13) S. P. Knurenko et al. // Proc. 28th ICRC (Tsukuba), 2003. v. 13. pp. 329–332.
- (14) S. P. Knurenko et al. // Pisma v ZhETF. 2006, v. 83, No. 11, pp. 563–567.
- (15) A. A. Lagutin et al. // Izv. RАN. Ser. fiz. 71. 605. 2007. (in Russian).
- (16) E. G. Berezhko et al. // UFN. 1988. Т.154. С.49. (in Russian).
- (17) E. G. Berezhko et al. // ZhETF. 1999. v. .116. p. 737. (in Russian).
- (18) M. N. Dyakonov et al. // Pisma v ZhETF. 1989, v. 50, No. 10, pp. 408–410.
- (19) S. P. Knurenko et al. // Izv. RАN. Ser. fiz. 69. 363. 2005 (in Russian).
- (20) A. A. Ivanov et al. // Proc. 29th ICRC (Pune), 2005. v. 3. pp. 329–332; S. P. Knurenko et al. // Int. Jour. of Mod. Phys. A (Proc. Suppl.) 2005. v. 20, No. 29. pp. 6900–6903.
- (21) S. P. Knurenko et al. // Nucl. Phys. B (Proc. Suppl.) 151 (2006) 92–95.
- (22) A. A. Ivanov et al.. // Izv. RАN. Ser. fiz. 71. 467. 2007 (in Russian).
- (23) V. S. Berezinsky et al. // arXiv:astro-ph/0403477; V. S. Berezinsky et al. // arXiv:astro-ph/0410650.
- (24) J. R. Horandel. // J. Phys. G: Nucl. Part. Phys. 29 (2003) 2439–2464.
- (25) E. G. Berezhko et al. // Astron. & Astroph. 400, 971 (2003).
- (26) J. Szabelsky еt al. // J. Phys. G. 1986. v. 12. pp. 1433.
- (27) T. Stanev, P. L. Bierman, J. Loyd-Evans et al. // Phys. Rev. Lett. 1995. v. 75. pp. 3056.
- (28) A. V. Glushkov. // Izv. RАN. Ser. fiz. 69. 366. 2005 (in Russian).