M-Dwarfs at Large Heliocentric Distances
Abstract
We present an analysis of the faint M star population seen as foreground contaminants in deep extragalactic surveys. We use space-based data to separate such stars from high redshift galaxies in a publically-available dataset, and consider the photometric properties of the resulting sample in the optical and infrared. The inferred distances place these stars well beyond the scale height of the thick disk. We find strong similarities between this faint sample (reaching ) and the brighter disk M dwarf population studied by other authors. The optical-infrared properties of the bulk of our sources spanning 6000Å-4.5m are consistent with those 5-10 magnitudes brighter. We also present deep spectroscopy of faint M dwarf stars reaching continuum limits of , and measure absorption line strengths in the CaH2 and TiO5 bands. Both photometrically and spectroscopically, our sources are consistent with metallicities as low as a tenth solar: metal-rich compared with halo stars at similar heliocentric distances. We comment on the possible MACHO identification of M stars at faint magnitudes.
keywords:
stars: low mass, brown dwarfs; statistics. Galaxy: stellar content1 Introduction
The advent in recent years of extremely deep imaging surveys, designed to probe distant galaxies through multiwavelength imaging extending deep into the infrared (e.g. GOODS, Giavalisco et al., 2004), has made possible studies of extremely faint, and often extremely red, sources. In order to target high redshift galaxies, colour cuts have been developed to exclude the majority of Galactic stars - including the low metallicity dwarfs expected in the halo of our own galaxy. Nonetheless, it has become clear that an unexpected number of extremely red stars remain at faint magnitudes. The spectroscopic component of high-redshift galaxy searches have confirmed the nature of such stars, in several cases obtaining deep spectroscopy as well as photometry (e.g. Stanway et al., 2004a; Vanzella et al., 2006), but the overall population has not been systematically characterised.
Low mass stars of class M or later comprise more than 80 per cent of the stellar population of our galaxy. Faint stars of late-M, L and T classes probe the tail of the stellar mass function, bridging the divide between the main sequence and low mass brown dwarfs. Such stars have unusual colours, arising from the presence of deep molecular absorption bands in their cool atmospheres.
The faintness of these stars has made their investigation challenging, particularly with increasing distance from our sun. Efforts to determine the properties of such stars in the halo and thick disk have concentrated on nearby stars with high proper motions indicative of a halo origin (e.g. Gizis & Reid, 1999). While deep surveys of the M star population in order to identify distant examples have been undertaken with WFPC2 on the Hubble Space Telescope (HST), reaching =23.2 (Zheng et al., 2001), these have been limited to wavebands shortwards of 9000Å where the coolest stars have very little flux.
Meanwhile, the more local population - late M stars at disk metallicities within 1.5 kpc of the sun - have been the subject of detailed study in recent years. The Sloan Digital Sky Survey (SDSS, York et al., 2000) is relatively shallow in the optical bands, reaching an band limit of . However, the addition of a redder band in the optical to similar depths has enabled the photometric selection of cooler, class L and T stars as sources with large flux decrements between adjacent passbands, caused by sharply-defined, strong absorption and transmission features. The -band imaging also allows the characterisation of late M stars by their colour. Such surveys have enabled templates based on thousands of local (mainly disk) dwarf stars to be constructed (Hawley et al., 2002; Bochanski et al., 2007).
At the same time, advancements in infrared detector technology have made it increasingly easy to study these faint, cool stars at wavelengths longwards of the optical. Their near and mid-infrared bands are dominated by molecular absorption, leading to extreme colours in infrared bands (Patten et al., 2006). Again, such studies have been limited to local stars, in order to attain the maximum possible signal to noise.
However, given the lower typical metallicity of stars in the halo when compared to the galactic disc, the characteristics of local disk-dominated M star samples may well be unrepresentative of fainter sources at larger distances and the colour selection methods applied locally might be expected to detect nothing at halo distances.
In this paper we present an analysis of faint low mass stars, selected for their extreme colours between two adjacent bands in high spatial resolution, deep optical imaging. Such a colour selection is expected to select either relatively-nearby late M stars at sub-solar metallicities or near-solar metallicity early M stars at the large distances more normally associated with the Galactic halo, if such a population exists. These two alternatives cannot be distinguished on the basis of a single red colour, but can be explored using spectroscopy and photometry probing well into the infrared.
In section 2 we present the data used in this analysis and we discuss the selection of stellar candidates in section 3. In sections 4 and 5 we discuss the optical and infrared properties of our sample, and in section 6 we examine the photometry of cooler stars in the same fields. In section 7 we discuss existing spectroscopy of such faint stars, including a spectroscopic sample presented here for the first time, and spectroscopic abundance indicators that may hint at a typical metallicity for this population. Finally, in section 4 we discuss the interpretation of the overall properties of the faint, cool star population including their metallicity and distance distribution.
All magnitudes in this paper (optical and infrared) are quoted in the AB system (Oke & Gunn, 1983).
2 Datasets used in this Analysis
2.1 Filters and Photometric Systems
We choose to use the AB system (Oke & Gunn, 1983) when expressing magnitudes in this analysis. The reason for this is twofold. Firstly the AB system is widely used by extragalactic astronomy and the surveys that generate much of the deepest optical imaging, including the data discussed below. The AB magnitude scheme is also used in more local large spectroscopic samples such as the Sloan Digital Sky Survey (SDSS). Secondly, AB magnitudes are also constructed on a physical basis. A source flat in flux as a function of frequency (f) has zero colour in all bands.
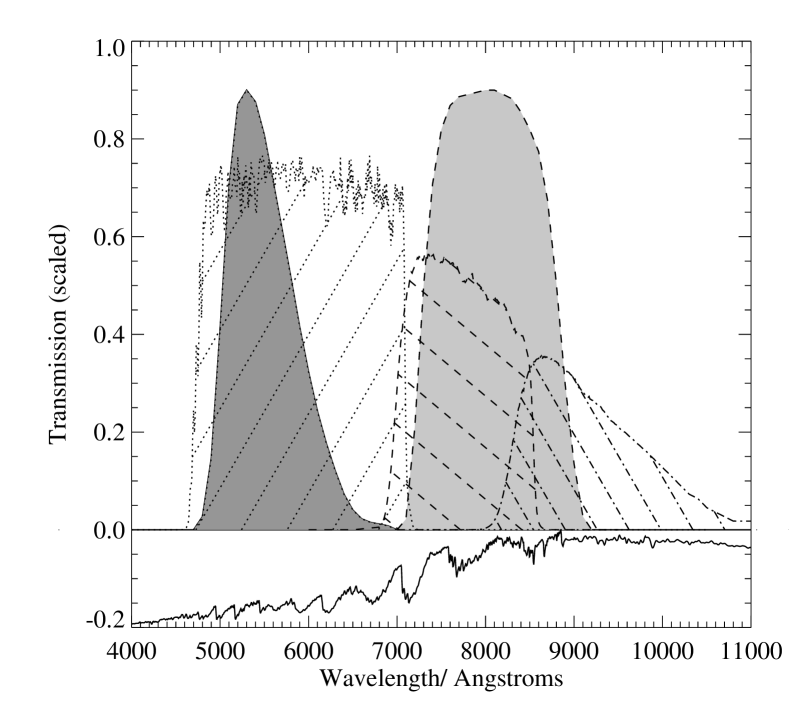
Colours are calculated throughout this paper by convolving available observational and theoretical spectra with the filter transmissions concerned (including the instrument and detector response) to accurately account for filter-specific effective wavelengths and full-width half-maxima. Our main reference spectra for faint stars the observationally-derived spectra of Bochanski et al. (2007) which were constructed for each subtype of class M and later stars from a total sample of over 700 observed spectra taken by the SDSS. As figure 2 illustrates, these template spectra trace the same stellar locus as those of Pickles (1998), although slight deviations are seen between the two template sets, particularly at late spectral types.
Use of the AB (rather than Vega) magnitude system introduces a blueward shift of 0.43 magnitudes in the “Standard” Bessell colour, which accounts for the spectral slope of Lyr at long wavelengths. In addition the () and () filter set has redder central wavelengths than their Bessell filter counterparts, and the filter is broader than the “Standard” as figure 1 illustrates.
2.2 Surveys
The analysis presented in this paper utilises two deep, multi-wavelength imaging surveys in order to combine their different strengths.
The photometric selection of cool dwarf stars parallels that of high redshift galaxies in many respects. In both cases the accurate characterisation of the sources, and their reliable separation from other sources with similar optical colours, requires multiwavelength imaging spanning a long baseline from 5000Å to 3.6m, and high angular resolution impossible to obtain from the ground without the use of adaptive optics.
The Great Observatories Origins Deep Survey111http://www.stsci.edu/science/goods/ (GOODS) satisfies the requirements for such a selection. In addition to an abundance of auxiliary data, the survey comprises two primary data sets, optical and infrared, each of which surveys a field in the northern hemisphere (GOODS-N) and a second in the south (GOODS-S). All GOODS data is publically released to the astronomical community in the form of fully reduced images.
The optical (0.3-1m) component of GOODS (Giavalisco et al., 2004) consists of deep optical imaging in the (), (), () and () bands, each reaching depths th magnitude as shown in table 1, obtained using the wide field channel of the Advanced Camera for Surveys (ACS) on the Hubble Space Telescope (HST). The imaging has been drizzled to a pixel scale of 003 per pixel, with a point source FWHM of 005 in the band. In addition, the GOODS team have made publically available catalogues of the source photometry and properties in each field, generated using the SExtractor software package (Bertin & Arnouts, 1996), and with detection parameters tuned to the survey depth and resolution. In this analysis we utilise the Kron-radius based automatic magnitudes reported by SExtractor (i.e. MAG_AUTO). These magnitudes follow the curve of growth of the source profile, and are equivalent to a corrected aperture magnitude for an unresolved source. We use version r1.1 of the GOODS catalogues222http://archive.stsci.edu/prepds/goods/.
The second primary dataset generated by the Great Observatories Origins Deep Survey comprises deep Spitzer Space Telescope infrared (3-10m) imaging of the fields targeted by Hubble (Dickinson & GOODS Team, 2005). The IRAC instrument was used to survey the GOODS fields at 3.6, 4.5, 5.8 and 8.0 m, with a pixel scale of 1.2′′/pix to a depth 26th magnitude in the first two bands and 24th magnitude at longer wavelengths as shown in table 1333The GOODS programme also obtained imaging with the MIPS instrument that is not discussed here. As discussed in section 5, confusion is a significant issue for sources at the faint magnitudes of our targets, and in imaging of this depth. As a result, the 12 arcsecond (10 pixel) apertures recommended for IRAC photometry in sparse fields seldom escape confusion in the GOODS images. Verma et al. (2007) determined that smaller apertures with a diameter of 4.5 arcseconds were suitable for compact sources in the GOODS images, and could be reliably corrected for flux in the wings of the point spread function. We apply the same prescription for aperture magnitudes as Verma et al., correcting to total magnitudes using the offsets given in table 1.
| Band | b | v | i’ | z’ | 3.6 m | 4.5 m | 5.8 m | 8.0 m |
|---|---|---|---|---|---|---|---|---|
| Depth | 28.87 | 29.46 | 28.85 | 28.55 | 26.96 | 26.38 | 24.50 | 24.37 |
| - | - | - | - | -0.180 | -0.180 | -0.326 | -0.418 |
Both GOODS fields look out of the plane of the galactic disc and away from the galactic centre, with galactic coordinates of = 125.865, =+54.808 for the GOODS-N field and =223.57, =-54.43 for the GOODS-S. Both fields were also selected to lie in regions of low Galactic extinction, selecting against structures in the galactic disk.
The spectroscopic analysis of faint M stars presented in section 7 is also based in part on GOODS data. Several of the stars identified in section 3 have deep optical spectroscopy taken with FORS2 at the Very Large Telescope (VLT) as part of the ESO GOODS survey (Vanzella et al., 2006).
In order to improve the statistical significance of our analysis, we supplement the ESO GOODS data with further M class star spectra observed as part of the BDF project. The BDF survey comprises deep multicolour imaging and spectroscopic follow-up of red sources in four near-contiguous fields, applying an colour selection to identify galaxies at , and reaching a limiting depth of . The first of these fields, BDF1, was described in Lehnert & Bremer (2003) while the remaining three fields, BDF2-4, were observed with an identical strategy and will be described in a forthcoming paper. These data are not used in the photometric analysis since with ground-based seeing it is impossible to separate mid-M stars from high redshift galaxies on the basis of optical colours alone (without band imaging reaching some four magnitudes deeper than the band limit). However, the high spectroscopic completeness of this survey for objects with extreme colours (essentially the same selection function as the HST/ACS selection discussed in section 3) makes it extremely useful for the a posteriori analysis of stellar spectra.
The FORS2 (R_SPECIAL, ESO number 76) and (I_BESS, ESO number 77) band filters used for imaging in the BDF fields were selected to be sharp sided and to have minimal overlap. Despite the different naming, the wavelength coverage of the band at 6550Å (FWHM=1650Å) overlaps significantly with that of the band at 5907Å (FWHM=2343Å). Hence a colour cut of reproduces the HST/ACS selection function for stars discussed in section 3, selecting class M3-M4 and later.
3 A Photometric Sample of Faint M-dwarfs
Class M, L and T stars have an underlying red continuum due to their cool temperatures. Their spectrum in the yellow and red is dominated by jagged molecular absorption bands that further redden the and colours. As a result, such cool stars can have extreme colours in adjacent filters and are regularly selected by ‘dropout’ surveys searching for high redshift sources (which show a similar drop between bands due to neutral hydrogen absorption in the intergalactic medium). We note that although ‘dropout’ is a historical term used by convention in the selection of high redshift galaxies, neither high redshift galaxies nor cool stars are expected to have zero flux in the bluewards band. As a result, whether the sources show a finite colour or drop entirely below the detection limit in the bluewards band depends on the relative depth of the imaging. Hence the term ‘break’ (as in Lyman break galaxy) or ‘drop’ is more technically correct. Sources are required to satisfy the criterion of a significant spectral break, measured through their photometry, but not to remain undetected in any given band. Nonetheless, for historical reasons, we continue to use the term ‘dropout’ while cautioning readers that its literal meaning is inaccurate.
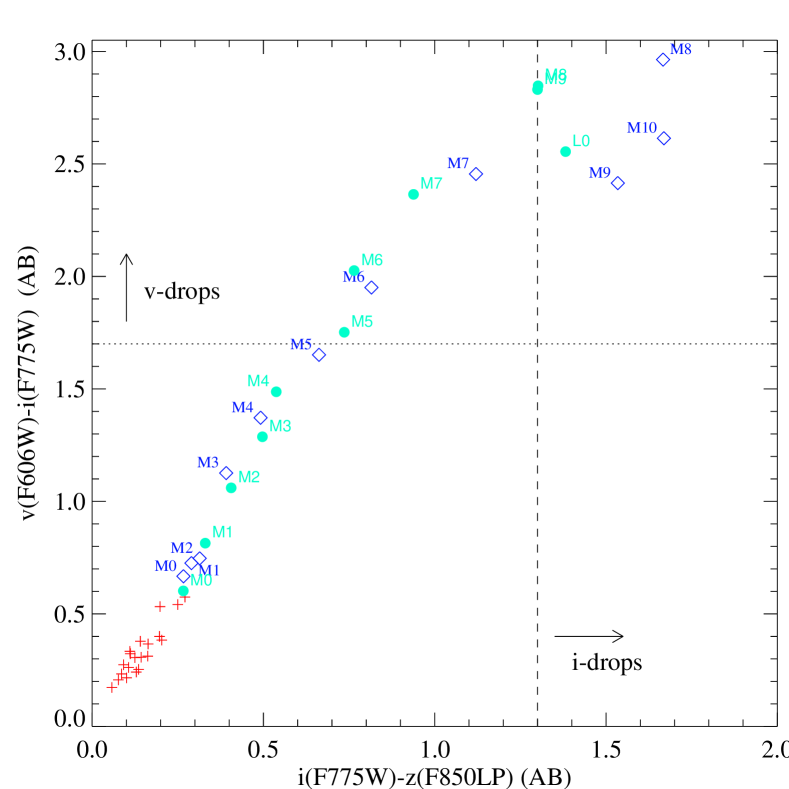
In order to select mid-M class stars and later, we apply the same -drop selection function commonly used to select high redshift galaxies. As figure 2 illustrates, a colour cut of 444which has been used to identify the Lyman- spectral break in galaxies at effectively selects stars of class M3 and later at solar metallicity (see section 4 for discussion for extreme low metallicity populations which will fall out of our colour selection). We note that we are likely to be insensitive to later spectral types: despite their red colours in , these sources are generally too faint in to be detected to our survey limit in the -band. Beyond M6, the almost-linear increase in colour begins to plateau, reducing the ability of this colour to distinguish between M class subtypes. Adding a second, redwards colour such as improves the discrimination between cool stars. Hence in order to examine the coolest stars in our survey fields we also consider a -band selected sample of stars satisfying 555which identifies galaxies at or class L and T stars.
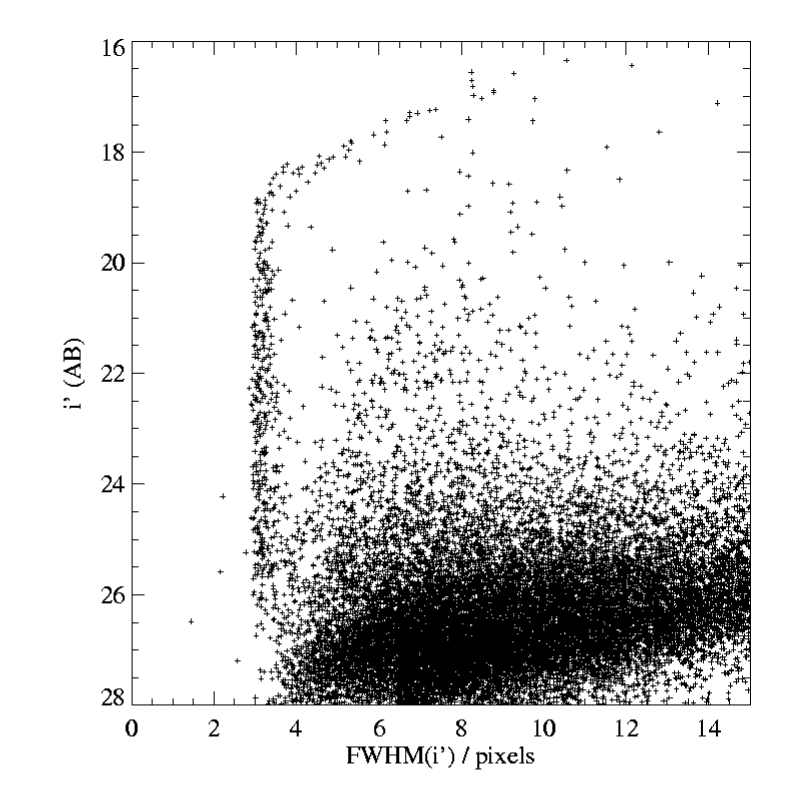
The resulting sample is expected to contain several distinct populations: the targeted stars, high redshift () galaxies and quasars which show a strong break at 1216Å, and old elliptical galaxies at which break at 4000Å. The majority of contaminant galaxies can be identified by their extended half light radii in the HST/ACS data. All confirmed galaxies selected by such a colour cut criterion are resolved in space-based imaging, albeit barely in several cases (Bunker et al., 2003; Bremer et al., 2004; Stanway et al., 2004a, b; Bouwens et al., 2004). Similarly, galaxies at are typically well resolved by HST. As figure 3 illustrates, unresolved sources separate cleanly from extended sources in the GOODS imaging for sources brighter than (or for in the case of -selected sources).
Clearly high redshift quasars cannot be distinguished from stars by their half light radii, since both populations are expected to be unresolved. The predicted number of quasars at the faint magnitudes probed here is expected to be small. Douglas et al. (2007) identified only one active galactic nucleus (AGN) in a highly spectroscopically complete survey of dropout objects examining 450 arcmin2 to a depth of 26th magnitude in 666Similar to the surface densities for faint AGN found by Mahabal et al. (2005) and Shankar & Mathur (2007). That source was slightly resolved in HST/ACS data, with comparable contributions to the rest-frame ultraviolet flux from the AGN and a starburst in the host galaxy. Hence we might expect to detect one AGN in the 300 arcmin2 GOODS survey area, either unresolved or marginally resolved. Fortunately, such a source should be distinguishable based on its infrared colours (Stern et al., 2006) as discussed in section 5.
In order to select low mass stars in the available ACS imaging with minimal contamination from extragalactic sources, we apply an additional selection criterion, requiring that: FWHM pixels (012), and we truncate our -drop selection at and our -drop selection at .
Each source was visually inspected to ensure that the photometry was not contaminated by neighbouring objects. In this deep imaging, the area of sky affected by sources above the detection limit is %.
The resultant number counts of dropout-selected stars is shown in table 2. In this analysis we focus on the M stars in the sample since these are both numerous, allowing a statistical analysis, and relatively bright, allowing spectroscopic follow-up.
While the -drop selected sample is too small to derive reliable statistics, the magnitude distribution of the -drop sample (i.e. M stars) is illustrated in figure 4. There is no clear trend in the number density of cool stars with apparent magnitude. The northern GOODS field is 34% more abundant in low mass stars than the southern field, despite their similar areas and orientation with respect to the galactic disk.
| Field | Area/sq arcmin | -drop) | N(-drop) |
|---|---|---|---|
| GOODS-S | 150 | 53 | 7 |
| GOODS-N | 150 | 71 | 5 |

4 The Optical Properties of Faint M-dwarfs
The selection of stars by photometric methods relies on a combination of the red optical spectrum that arises from a cool blackbody with the abrupt absorption edges of metal molecules. In the absence of significant metal enrichment, the colours of stars at a given temperature are likely to be less extreme since the strength of molecular features is reduced. Hence a sample of faint stars based on extreme colours in two adjacent bands is expected to select either relatively-nearby late M stars at low metallicities as well as near-solar metallicity early M stars at the large distances more normally associated with the Galactic halo, if such a population exists.
The Allard & Hauschildt (1995) ‘NexGen’ models and the Kurucz ATLAS9 models (Castelli & Kurucz, 2004; Kurucz, 1996) remain the most recent stellar atmosphere models to attempt the temperature and metallicity regime of interest here (although the ATLAS9 models in fact do not survey T3500K late M stars and do not account for the important CaH bands in cool stellar spectra). As the recent analysis by Bertone et al. (2004) shows, neither provides a satisfactory fit to the spectra of cool stars. While the MARCS spectra produce a somewhat better fit, the publically available library only extend as cool as 4000K. In practise, no stellar models can reliably reproduce the colours of cool stars.
On the other hand, there exist a number of published ’extreme’ cool stars known to be at significantly sub-solar metallicity (e.g. Gizis, 1997; Burgasser, Cruz, & Kirkpatrick, 2007). Unfortunately the photometry and/or spectral coverage of these observations inevitably covers too short a wavelength range to reliably calculate , and colours simultaneously from the empirical spectra.
As a result, while we tentatively consider the results of available model templates as well as empirical spectra, we caution the reader that such results should not be considered reliable. We note that future interpretations of this population would benefit from improved modelling and interpretation of these faint stars in the red spectral region (8000Å) accessible to red-sensitive spectrographs.
We have determined the optical colours expected for cool stars, in the same filter set employed by the GOODS survey, over a range of metallicities. We use the M-star spectral models of Allard & Hauschildt (1995)777In their ‘NextGen’ form as implemented by Lejeune, Cuisinier, & Buser (1998) over the range [Fe/H]=0. to -4.0 (where such models are available) and at four different temperatures: T=2000K, 2500K, 3000K and 3500K.
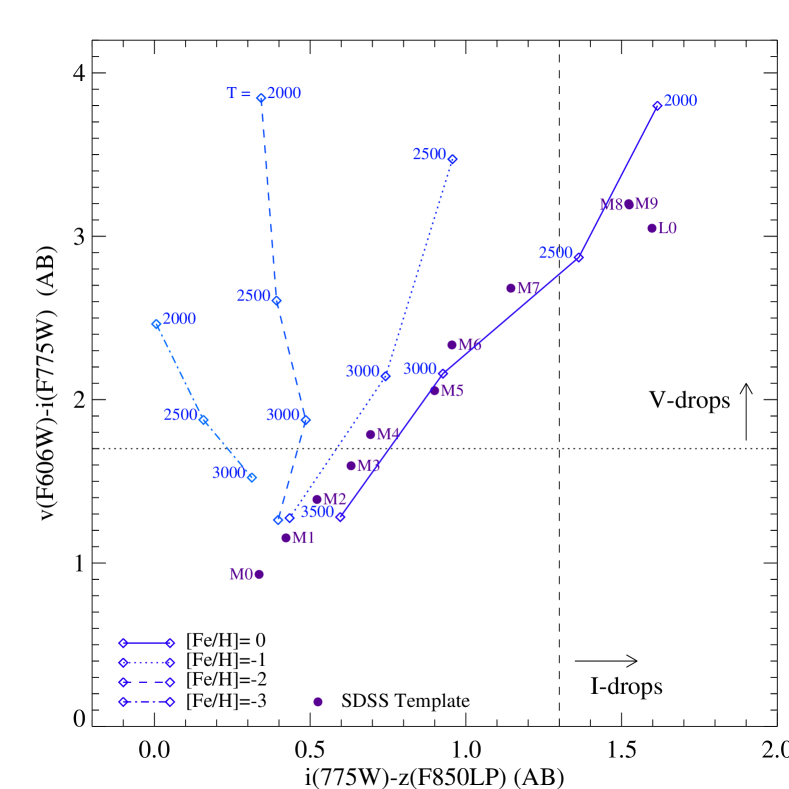
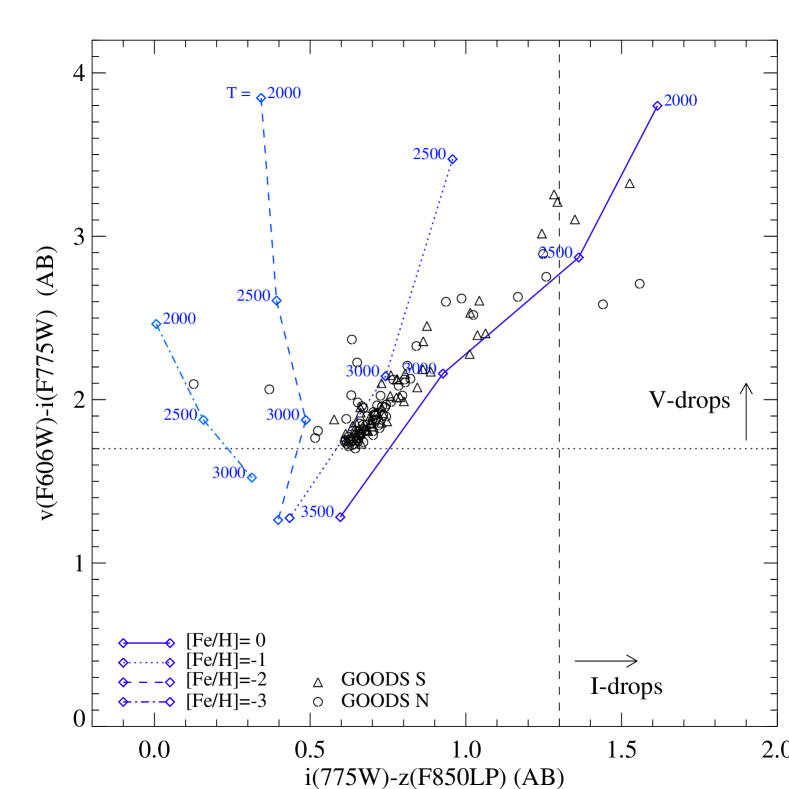
Figure 5 illustrates the colours predicted by the ‘NextGen’ models, and compares these with the colours of the SDSS dwarf star templates derived by Bochanski et al. (2007) which are dominated by nearby disk stars and the photometric sample derived in section 3. It is clear that while the colour fails to distinguish between different metallicity populations, the addition of an colour may provide a crude measure of metallicity. We note that a slight offset (approx 0.1 magnitudes in ) appears to be required to match the model spectra to the observed near-solar, old disk stellar sample at bright magnitudes.
Given the uncertainties in current models of M star atmospheres, we compare their predictions with observational data on Galactic globular clusters. Observational evidence for the (or more generally ) colours of cool stars as a function of metallicity seems to be poor. However the colours of such stars (observed in the Johnson-Cousins or Bessell systems and in Vega magnitudes) have been reported from observations of several globular clusters. While few observations probe deep enough to identify the base of the main sequence (as opposed to the main sequence turn-off), some observations of low metallicity globular clusters have characterised the main sequence ridge to very faint magnitudes.
NGC 6397 is one such cluster, with a metallicity of [Fe/H]=-2.0 and lying at a distance of 2.2 kpc (Cool, Piotto, & King, 1996). The main sequence in this source has been observed with HST/ACS down to a limiting magnitude of (Vega) and is seen extending redwards to , the theoretical hydrogen-burning limit at this metallicity (Richer et al., 2006). At our colour cut of =1.7 (approximately ), the main sequence in this cluster corresponds to an observed magnitude of approximately (Vega), or an absolute magnitude limit of 12.4 in the I band, while our detection limit of would only select sources with . This cutoff in apparent magnitude implies that we are only sensitive to approximately class M4-M5 stars at the distance and metallicity of NGC 6397 (Hawley et al., 2002) and would not expect to select any stars with halo metallicities at greater distances. This emphasises that our colour cut allows only for a narrow range of low metallicity objects which are sufficiently red and sufficiently bright to meet our colour selection criteria.
In figure 6 we illustrate the effects of decreasing metallicity on the main sequence colours of globular clusters with published photometry. As discussed above, NGC 6397 is a distant globular cluster with the low metallicity expected of halo stars. By contrast NGC 6366 and NGC 6144 are two clusters with [Fe/H]=-0.58 and [Fe/H]=-1.7 respectively, and published main sequence star photometry to faint magnitudes observed with HST/ACS (Sarajedini et al., 2007) as part of an ACS survey of globular clusters. While these data are amongst the deepest available, they do not reach the red colours, and hence faint -band magnitudes of the M stars of interest here. Nonetheless, it is interesting to note that the well-defined main sequence in these globular clusters marks a gradual shift to bluer colours with decreasing metallicity, and all three are bluer than the old-disk stars measured by the SDSS.

The spectra of several very low metallicity extreme subdwarfs in the field have now been published. Burgasser, Cruz, & Kirkpatrick (2007) demonstrate the effects of decreasing metallicity on the optical spectra of late M dwarfs. The weakening of metal oxide bands at 7200Å, 7900Å and 8500Å with decreasing metallicity boosts stellar flux in the and bands. In particular, the deep 7900Å absorption feature in the spectra of cool stars at disk metallicities suppresses the -band magnitudes of these sources. Decreasing metallicity removes this suppression, boosting the colour of these sources while decreasing their colour in . While none of the published extreme subdwarfs have published -band photometry, synthetic colours calculated from the Burgasser, Cruz, & Kirkpatrick (2007) spectra indicate that at these low metallicities, late M dwarfs are approximately 0.2 mag bluer in than typical old-disk M stars (Bessell, private communication).
It is clear from the combination of theoretical and observed data that most stars earlier than M3-M4 will be omitted at low metallicities due to their blue colours, while later M class stars are only likely to be detected relatively nearby due to their faint magnitudes. Thus our selection preferentially identifies stars with disk metallicities, while probing to halo distances. This analysis of our colour selection function is supported by the distribution of optical colours in our faint star sample as shown in figure 5b. The majority of stars have colours consistent with metallicities in the range (i.e. similar to that of the Galactic disk).
Two stars in the GOODS-N field show anomalously low colours (, ) as might be expected at [Fe/H]-2, and both of these are relatively faint (). Comparison with the colours of the extreme subdwarfs of Burgasser, Cruz, & Kirkpatrick (2007) suggests that these might be identified as very low metallicity sources, although both are somewhat redder in than might be expected. Either spectroscopy of these two blue stars, or optical photometry of known extreme subdwarfs will be required to make a more quantitative comparison.
5 The Infrared Properties of Faint M-dwarfs
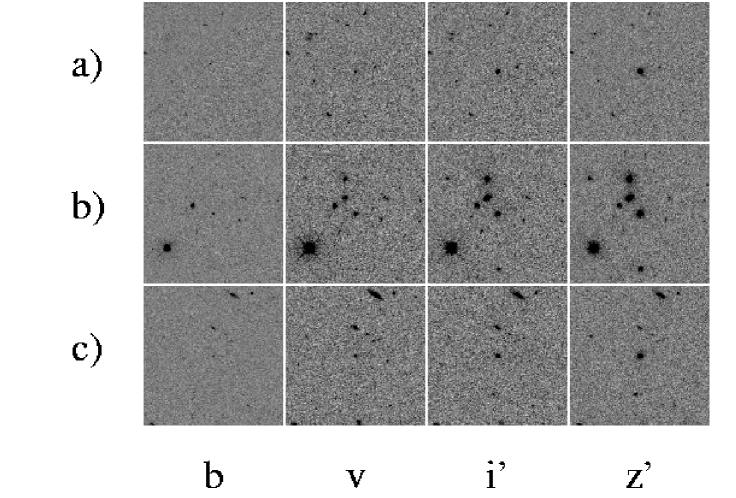
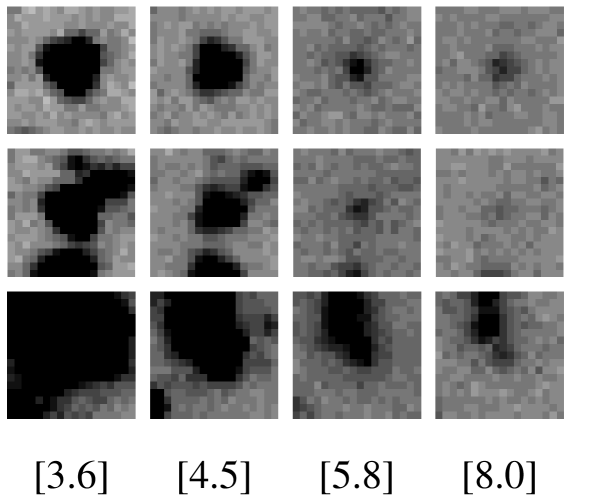
Having identified the stars in HST data, we now consider the colours of these unresolved sources in the infrared with Spitzer GOODS data. The deep images are close to the confusion limit in the IRAC bands, and many of the -drop sources are confused in the imaging. Of a total of 124 -drop stars in the GOODS fields we classify 48 (39%, figure 7 case a) as isolated, a further 36 (29%, figure 7 case b) as confused but potentially deblendable and the remaining 40 (32%, figure 7 case c) as hopelessly confused. In this analysis we use only isolated objects since the noise in deconvolved magnitudes at this level is often dominated by residuals from neighbouring objects rather than the target source.
The infrared colours of the remaining sample are shown in figures 8 and 9, with the colours measured for M, L and T dwarfs in the same bands by Patten et al. (2006) shown for comparison. Working some three magnitudes above the 3 background limit, the errors in the colours are dominated by uncertainty in the aperture correction and are set to an indicative 0.1 mag in each band.
The colours of cool stars in the infrared are dominated by the relative strengths of molecular absorption bands in their atmospheres, in particular those of CH4 in the 3.6 m band, CO in the 4.5 m band and H2O in the 5.8 m band.
The infrared colours of our faint -drop selected sources are very similar to those of the brighter population studied by Patten et al., despite being fainter by some ten magnitudes. The GOODS -drop stars extend slightly blueward of the bright sample in the [4.5]-[5.8] band, as would be expected given that our -drop sample extends to earlier M subclasses than the bright sample (M3/M4 as opposed to M5). It is not clear from existing models or data whether a similar bluewards shift might be expected with varying metallicity.
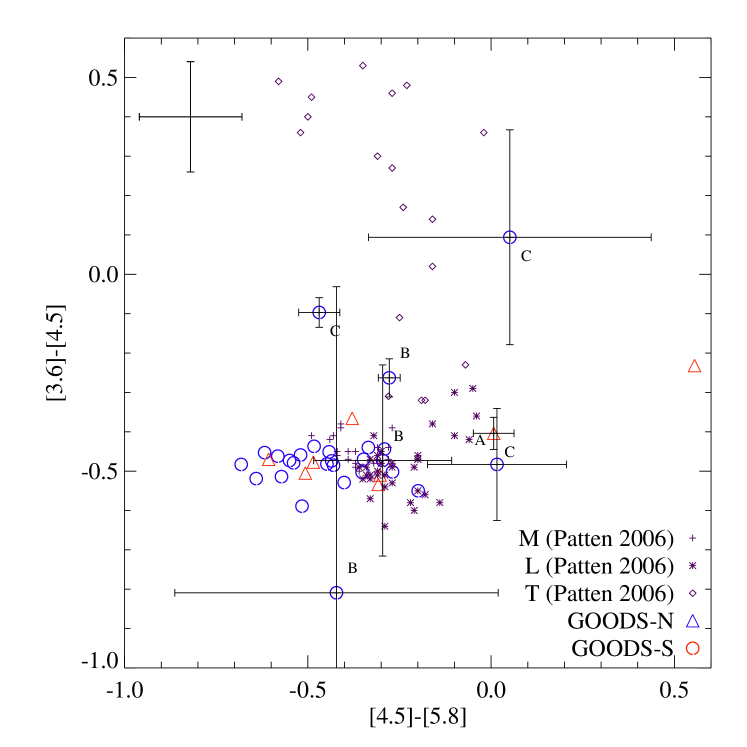
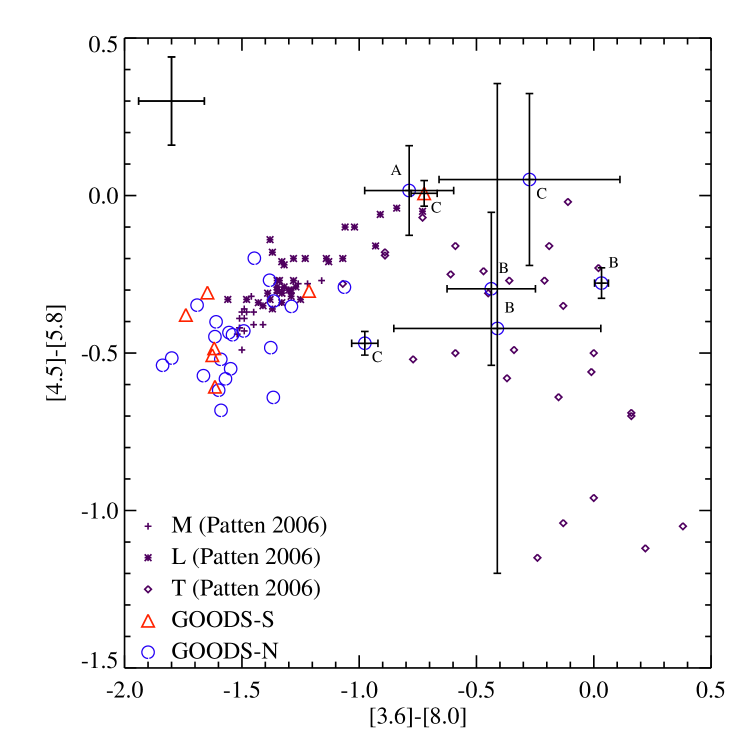
While the bulk of the population has colours consistent with brighter M stars, a subset of seven sources are anomalous with M star optical colours and T star colours in the Spitzer wavebands. These fall loosely into three categories.
One source, labelled ‘A’ on figure 9 has colours consistent with a late-M/early-L classification within approximately 3 of the photometric errors in both optical and infrared bands. The colours are also consistent with those expected for a close M/L binary system with the M star flux dominating the optical bands and the fainter L star contributing to the flux longwards of 3 m. Binary M/L and M/T systems have been observed at bright magnitudes in the past (e.g. Leggett et al., 2002; Burgasser & McElwain, 2006). This source is towards the faint end of our sample, with . A binary with separation of 1′′.09 at a heliocentric distance of 35 pc (using the M/L binary pair of Burgasser & McElwain, 2006, as a model) would be unresolved at HST/ACS resolution at the distance of 1 kpc estimated for an M6 star at this magnitude. If it is indeed a binary system then each component will be intrinsically fainter still and may lie at greater distances than estimated. Radial velocity measurements of the system may be necessary to determine whether the star is an anomalous M dwarf or a binary pair.
A further three sources, labelled ‘B’ on figure 9 have -5.8 m colours consistent with those of M stars but are anomalously bright in the 8 m band. In one case, the photometric errors are large and the faint star is within 2 of the colours expected for an M star. However, the other two stars are well detected in all bands, and show no evidence of unreliable photometry. Both the 3.6 and 8 m bands are dominated by CH4 absorption with the fundamental band in the bluewards filter. There is no clear interpretation of an 8 m excess.
Finally the remaining three sources, labelled ‘C’ on figure 9, show no distinctive breaks or obvious features in their spectral energy distributions but their flux peaks further to the red than expected for M stars. Again these sources have reliable photometry with no clear reason to believe photometric errors are larger than shown. As such they have M star colours in the optical and T stars in the infrared. Interestingly their colours are well within the distribution of the rest of the sample, showing no evidence for M/T multiplicity (which would lead to red colours as the T dwarf contribution becomes dominant at 3.6 m).
We note that all of these anomalous sources defy straightforward explanation based on photometry alone and may benefit from spectroscopic analysis.
One unresolved object in the GOODS-N has extremely unusual colours in the IRAC wavebands, lying outside of the region plotted in figures 8 and 9. The colours of this source ((-[3.6])AB=0.71, ([3.6]-[4.5])AB=0.09) may be consistent with identification as a high redshift quasar or compact galaxy and inconsistent with any cool star.
6 The Properties of Cooler Stars in this Sample
To a limit of , there are a total of 12 unresolved sources in the GOODS fields that are identified as -drops but do not form part of the -drop sample due to their faint magnitudes in .
As figure 2 indicated, an -drop selection is sensitive to stars of spectral classes later than M8 (assuming near-solar metallicities). The linear increase of colour with spectral type becomes less clear cut at the same subclass, due to the difficulty in assigning spectral types based on spectroscopic indices, making classification of these sources impossible based on optical photometry alone.
Seven of these sources are unconfused in the 3.6 m band, although given their faint magnitudes, one is undetected at 4.5 m a further four undetected longwards of 4.5 m. Figure 10 shows the [4.5]-[5.8] versus [3.6]-[4.5] colours or 3 limits on the colours of the six stars for which these colours can be determined. All six are consistent with the infrared colours of local M and L dwarf stars studied by Patten et al. (2006).

We note that an -drop selection used to identify cool stars here is likely to be significantly incomplete for low metallicity dwarfs if the available stellar models provide a reasonable approximation to their colours, as figure 5 illustrates. A number of low metallicity extreme subdwarfs have now been found. Unfortunately none of these have published -band photometry.
Burgasser, Cruz, & Kirkpatrick (2007) present the optical spectra and colours of a sample of late M and L extreme subdwarfs. The spectroscopically confirmed subdwarfs show colours between 1.4 and 1.8 for M dwarfs increasing to about 2.4 for L4 dwarfs. Given the spectra of M class stars are essentially flat in fλ in the range 8000-10000Å, it seems unlikely that most late M subdwarfs would have colours as extreme as 1.3. Indeed, synthetic colours calculated from these spectra indicate that at these low metallicities, late M dwarfs are approximately 0.2 mag bluer in than typical old-disk M stars (Bessell, private communication). Nonetheless, the early L class extreme subdwarfs of Burgasser, Cruz, & Kirkpatrick (2007) lie well redwards of the colour selection criterion used here.
This metallicity-dependent selection effect complicates the analysis of L and T star number counts, and larger surveys will be needed to accurately constrain the surface density of these cool stars at faint magnitudes.. Further progress in understanding the incidence and properties of low metallicity class M, L and T dwarfs may be possible in future given improved modelling of the effects of varying metallicity on the spectrum longwards of 1 m and in the Spitzer/IRAC wavebands.
7 Spectroscopy of Distant M-dwarfs
Some tens of faint low mass stars have now been observed in deep spectroscopy, as part of the follow up to dropout-selected high redshift surveys.
Extremely deep 8 m class telescope spectra of M or L class stars with have been published or publically released by Stanway et al. (2004a) and Vanzella et al. (2006). Additional deep stellar spectra were obtained as part of the ESO Remote Galaxy Survey (ERGS, Douglas et al., 2007, Douglas 2007, in prep) and by Lehnert & Bremer (2003) as part of their BDF survey. Many such spectra remain unpublished, being considered incidental to the search for galaxies.
Six of the -drop sample discussed above have deep spectroscopy obtained in multi-object mode with FORS2 on the VLT as part of the GOODS programme and publically released by Vanzella et al. (2006). These sources have magnitudes in the range and were observed at a dispersion of 3.2Å/pixel and a spectral resolution R=660, for a typical exposure time of 14400 seconds.
As discussed in section 2, we supplement this small sample with a further 18 faint M class star spectra observed as part of the BDF project. The BDF survey comprises deep multicolour imaging and spectroscopic follow-up of red sources in four near-contiguous fields, applying an -drop colour selection to identify galaxies at and including a number of stars (which can be difficult to separate from compact galaxies on the basis of optical colour alone).
-drop sources were observed spectroscopically in multi-object mode. Two FORS2 slitmasks were observed in each field, with a total integration time of 13000 seconds per mask, divided into twenty exposures of 650 s, each offset by a different distance along the slitlets. Each slitlet was 1 arcsecond wide. The spectra were wavelength calibrated from arclamps and flux calibrated from standard star observations taken at the same time. The final spectra span the spectral range 6000-10000Å at a dispersion of 3.2Å, and with a spectral resolution R=660. This configuration is virtually identical to that used by Vanzella et al. (2006), with the two samples differing only in the selection filters.
Examples of such faint star spectra are shown in figure 11. As expected for sources a hundred times fainter than those observed by the SDSS, the spectra are noisy. However, despite the low signal to noise of such spectra, they show the similar molecular absorption features to their brighter counterparts. Each of the twenty-four stars in the final spectroscopic sample discussed here has and signal to noise on the continuum around the features of interest (i.e. around 7000Å) of 10 or greater (in some cases higher than 20).

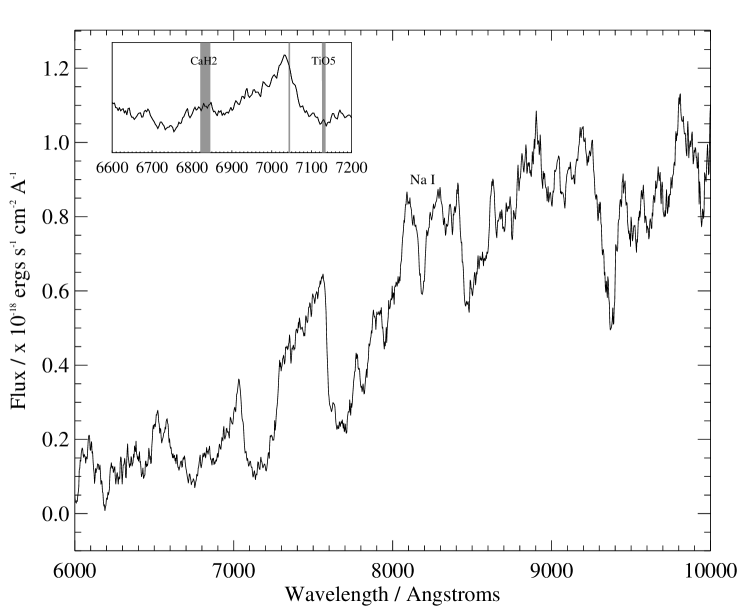

Given these deep spectra it is possible to identify a number of molecular absorption features, both lines and absorption bandheads. Here we consider two diagnostic features in the spectrum of M stars: the surface gravity dependent Na I doublet at 8183, 8195Å and the metallicity dependent TiO to CaH ratio around 7000Å.
The Na I doublet is a strong feature in the spectrum of M stars, but its measurement is complicated by the crowded spectrum around 8200Å which makes the true continuum level difficult to determine. Faber & French (1980) introduced a systematic measurement of the equivalent width of this line by defining a region to contain the line, and two adjacent regions as a proxy for the continuum level. This definition is shown in table 3.
As discussed by Schiavon et al. (1997), this feature is a sensitive indicator of surface gravity for stars cooler than 3900K, and hence discriminates between dwarf stars with a surface gravity of and giant stars of the same spectral class with a typical surface gravity .
Giant stars of class M4 and later are rare, and not expected to substantially affect the number counts of faint stars, but the presence of a significant subpopulation of giants could theoretically impact our distance distributions (which are based on distance modulus, assuming that the stars are dwarfs). As expected, the Na I equivalent width of all eighteen spectra are entirely consistent with dwarf stars (having EW), and inconsistent with those of M giants (which would have an EW).
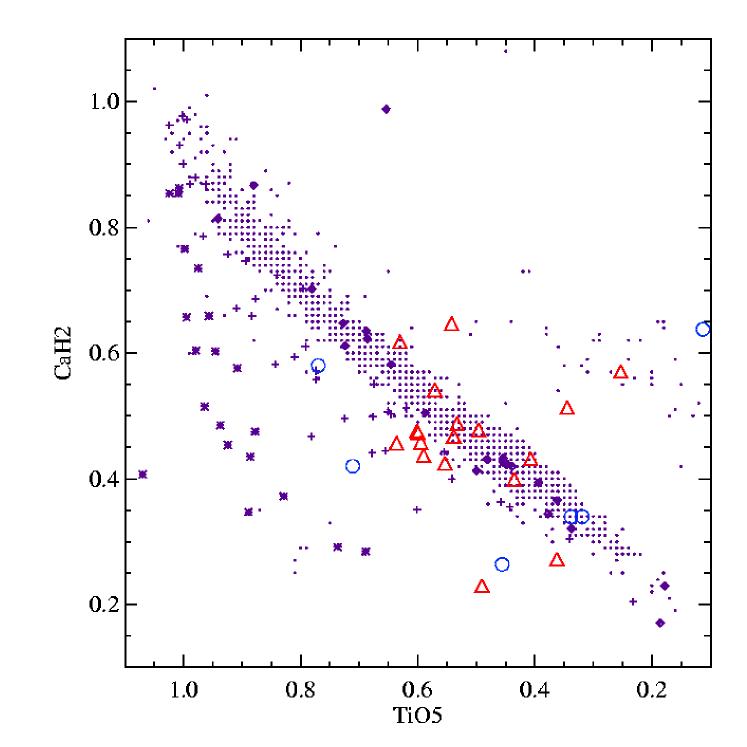
Given their optical colours (discussed in section 4) the M dwarfs described here are expected to be comparable to or slightly lower in metallicity than M dwarfs observed in a local sample. To test this hypothesis, we consider the ratio of two molecular line indices. Low metallicity dwarfs have lower ratios of CaH to TiO than higher metallicity dwarfs (Gizis, 1997), allowing their ratio to be used as a crude metallicity indicator.
The strength of these lines is usually gauged by a series of narrowband indices first measured by Reid et al. (1995). These indices measure the strength of an absorption feature relative to a pseudo-continuum flux measured nearby. The definition of the TiO 5 and CaH 2 indices used here is given in table 3.
| Band | S1 | W |
|---|---|---|
| TiO 5 | 7042 - 7046Å | 7126 - 7135Å |
| CaH 2 | 7042 - 7046Å | 6814 - 6846Å |
| Na I EW | 8169-8171Å | 8172-8209Å |
| 8209-8211Å |
On figure 12 we plot the ratio of line indices measured on the 18 spectra of the combined GOODS and BDF samples. There is little evidence for significantly sub-solar metallicities (i.e. [Fe/H]-2). Around 40% of the sample (7 of 18) are consistent with slightly sub-solar metallicities (i.e. [Fe/H]-1), while the same fraction are completely consistent with the indices for a local (solar metallicity) sample. 20% of the sample (4 stars) show anomalously strong CaH features given the strength of their TiO absorption bands. Of these, two also show TiO5 suggesting that they are of spectral type M6 or later (consistent with their photometric colours).
We caution the reader that it is possible that these spectral indices may be affected by noise due to the subtraction residuals of night sky emission, and by night sky absorption, which isn’t removed by our data reduction. Spectroscopy aimed at identifying high redshift galaxies is routinely obtained in such a manner as to optimise night sky line subtraction. By offsetting the telescope between exposures, such that the target moves along the slit, the frames can be combined during reduction in such a way as to produce a simultaneous measurement of the sky flux that can be subtracted from the object spectrum. The measured signal to noise on the spectra account for the error in the sky line subtraction, and hence given our requirement of a signal to noise exceeding ten, we estimate statistical error on our spectral indices of less than 15%. However, we note that the indices are measured in a spectral region affected by a weak skyline complex, and that our spectra are of comparatively low resolution.
While we do not attempt further quantitative analysis of our spectra, we note that there are other spectral features that may be accessible even in these faint sources. In particularly, it may be possible in future to measure the metallicity using the KI doublet feature at 7700Å. This doublet is observed to be extremely strong in the low metallicity extreme subdwarfs of Burgasser, Cruz, & Kirkpatrick (2007). While the line is not as strong in early M dwarfs as in later subtypes, we note that our spectra appear qualitatively similar to those from the nearby near-solar metallicity with no sign of the enhancement in line strength that might be expected at low metallicities.
The typical metallicity of the sample as derived from 18 spectra is consistent with that determined from their optical colours (figure 5b). Given that none of the eighteen stars in our spectroscopic sample are of very low metallicity ([Fe/H]-2.), the fraction of significantly sub-solar sources in our photometric sample is likely to be small (%), consistent with the suggestion of two sources out of 124 (%) based on their optical colours.
8 A Metal-rich Population of M-class Stars at Halo Distances
Given the evidence of their optical and infrared colours, combined with photometry of a number of examples, it appears that the M star population identified at faint magnitudes (and hence in extragalactic surveys) is relatively metal-rich ([Fe/H]-1) compared to the metal-poor halo population that might be expected to dominate star counts at large distance. In fact, their metallicities are more typical of those observed locally in the thick disk. This suggests that there is only a weak metallicity gradient in the class M and later dwarfs identified as photometric dropout sources, although this analysis does not exclude the possibility that a low metallicity M-star population also exists at faint magnitudes.
Given this relatively metal-rich population, it is possible to explore the comparison with brighter M stars further. As demonstrated by Hawley et al. (2002), for dwarf stars with metallicities [Fe/H]-1, colour increases linearly with subclass between spectral classes M3 and M9, flattens through the early L dwarfs and then increases again. As a result, M stars identified as -drops (which are typically too blue in to be L stars) can be crudely classified by their colours. We chose to use colour for this classification rather than for two reasons: in order to minimise errors on the colour, and in order to provide a second colour, thus beginning to constrain the SED for these sources. In the deep optical imaging employed here, the typical photometric errors on this colour are of order 0.05 mag, less than the measured variation of colours within each subclass in a brighter sample from the SDSS (determined by comparing spectral typing based on template fitting, spectral indices and photometric colour) which is typically 0.2 mag in these filters,(Bochanski et al., 2007; Hawley et al., 2002). This scatter in colour within subclasses arises from variation in physical properties of the stars in question. A continuum in the metallicity and temperature of individual stars will affect their line indices and photometry, leading to a gradual range of characteristics in a field population rather than the discrete set of subtypes that might be expected from a single age, single metallicity population such as a globular cluster. This uncertainty in intrinsic colour limits photometric classification to subclass. The surface density of faint stars decreases rapidly with increasing M star subclass, since a smaller volume is probed to the same magnitude limit. As a result stars in the range M4-M5 are expected to outnumber later classes.
We make an approximate classification of our sample of -drop M stars by assigning each to the closest subclass in typical colour, based on the templates of Bochanski et al. (2007). As figures 13 and 14 illustrate, early M stars (classes M3-M4) are found spanning the entire range from the saturation limit to the faintest magnitudes at which the GOODS data can distinguish unresolved sources from compact galaxies.
Later M stars (spectral class M5 and later) are intrinsically fainter and so our survey probes progressively smaller volumes with increasing subclass. These are not seen at bright magnitudes but become increasingly common at . The latest stellar class seen in our -drop samples is M7. Stars of classes later than M7 are intrinsically faint and so will only be detected in a relatively small volume probed locally. In addition, the very red colours of these sources is likely to lead to them dropping below the limit of the band used for selection. Later classes may be detected rather as -band dropouts.
We note that M3 stars should formally be too blue to be selected given our colour cut. As discussed above, classification by colour is at best an approximate method, and the large ‘M3’ sample may be explained as a combination of M4 stars with bluer than average colour and genuine M3 stars with a redder than average colour. Spectral classification would be necessary to classify individual sources. Interestingly these ‘M3’ sources are more numerous than the ‘M4’ sample suggesting that scatter in the colour is skewed to the blue rather than symmetrical which may be indicative of low metallicity as discussed in section 4. If so, a slight correction must be applied to the absolute magnitude of each subclass resulting in slightly lower estimated distances. However, while this will apply a systematic shift to the distribution of distance moduli, it will not change the distribution.
As expected, the two probable low metallicity candidate -drops in the GOODS-N field defy classification based on colour.


Using the typical absolute magnitude for each class (as determined by Bochanski et al., 2007) we can estimate the distance modulus, and hence distance to each star, essentially using the relation between colour and absolute magnitude determined from the local disk population (Bochanski et al., 2007; Hawley et al., 2002) to derive a photometric parallax for each star in the sample. While this has traditionally been carried out using the vs relation, we chose instead to use vs (in common with Hawley et al., 2002) since these sources are brighter, and hence their magnitudes are more reliable, in the redwards bands.
The distribution of source distances from the sun are shown in the right-hand panels of figures 13 and 14. We are observing class M3-M4 stars at distances between 1 and 14 kpc. The distant tail of this population is well above both the scale height of 275 pc for the thin disk, and the 1.5 kpc scale height of the thick disk that may be more appropriate for disc M dwarfs (Zheng et al., 2001).
The most extensive survey of faint M dwarfs to date has been a survey of high galactic latitude fields with HST/WFPC (Bahcall et al., 1994; Zheng et al., 2001). These authors probed about 1400 stars, reaching a depth of (). Their finding of a sharp decline in the number of stars with a relatively short scale height of 1 kpc above the galactic disc Zheng et al. (2001) seems inconsistent with our flat number counts out to a heliocentric distance of kpc. Clearly our sample is smaller by a considerable margin, but is also significantly deeper and hence highly complete (98%) at large heliocentric distances. The fact that a similar distribution of number counts is observed in two widely separated fields argues against Galactic substructure as an explanation.
A flat number density of stars with increasing magnitude is not easily reproduced given standard models of the galactic density profile. In order to explore this, we constructed Monte Carlo simulations of a sample of 50 stars randomly drawn from a population of stars distributed according to a known density profile. Profiles considered include the thick disc density law of Zheng et al. (2001) which takes the form of a sech2(z/h) law with a scale height h=300 pc above the Galactic disk and ‘model B’ of Reid et al. (1996) which considers a composite model of thin disk and thick disc (both with sech2 density profiles and scale heights of 350pc and 1.5kpc respectively) together with a halo density profile (scaling as approximately r-3.5 with radius from the galactic centre). Variations on these models were also considered with varied scaling between disc and halo components, and a variety of halo power laws. In each case, number counts are predicted to increase sharply at faint magnitudes, since the density law varies less rapidly than the volume element at a given magnitude. The absence of such an upturn suggests that this population is falling off more rapidly than those expected from standard disk profiles, despite extending many scale heights above the plane of the disk, or alternately that the conventional components of galactic structure need to be rethought. Our results might be interpreted as suggest that either the scale height of the thick disk has been significantly underestimated (as also suggested by Reid et al. (1996)) or that a third distant but relatively metal-rich component is needed to explain the population. However, we do caution that our stellar number counts in the most distant bins are small and that analysis of larger deep surveys are needed.
We note with interest that the presence of a large population of massive astrophysical compact halo objects (MACHOs) that are faint in the optical and contribute up to 20% of the halo mass has been inferred from microlensing analyses (e.g. Tisserand et al., 2007; Bennett, 2005; Alcock et al., 2000, and references therein). These sources have been inferred to have a mass of 0.5 M⊙, similar to the mass of an early to mid M-dwarf star. According to the widely used ‘S’-model (Alcock et al., 2000), the MACHO objects occupy a spherical, isothermal halo of core radius 5 kpc. In at least one case, a lensing star has been confirmed photometrically and spectroscopically to be an M4-5 dwarf star, with a red colour similar to those discussed in this analysis ( (Vega), Alcock et al., 2001). While the M dwarf population studied here may explain only a fraction of the proposed MACHO mass contribution to the dark halo, we probe only a small subset of the halo M star population with the colour and flux limits applied in our study. We note that these cool, red stars would not easily be identified in the relatively shallow and blue monitoring imaging employed by the MACHO (Alcock et al., 2000) and EROS (Tisserand et al., 2007) collaborations.
Our survey also highlights both the utility and the difficulty of relying on the relatively small deep fields designed for extragalactic observations. While such surveys are extremely sensitive and benefit from multiwavelength observations - often including coordinated observations in the infrared and deep spectroscopic follow-up - they also suffer from being necessarily small in size. The newer generation of ground-based, wide-field imagers have enabled larger deep fields to be observed, but under seeing conditions that make the effective separation of stars and high redshift galaxies (which become comparable in number density at faint magnitudes) impossible. The variation of 40% in the M star number counts between the GOODS fields suggest that larger deep fields should be observed at HST resolutions in order to average out structure in the inner halo or outer disc.
Clearly further work in larger fields with both deep and high resolution imaging (e.g. COSMOS, Scoville et al., 2006) is required to strengthen the observational result that the number density of sources remains constant to faint magnitudes, which may imply a rapid cut-off in the thick disk density profile at large distances above the Galactic plane.
9 Conclusions
We have investigated the properties of a faint population of M stars selected using a photometric drop method similar to that used to identify high redshift galaxies. The M-dwarfs in this study are up to five magnitudes fainter than those considered by previous authors, and hence lie at distances up to ten times further than those investigated before.
This population extends well above the galactic plane, with little evidence for a decline in number at faint magnitudes/large distances. This is difficult to reconcile with models of known disk structure.
The M-stars selected by this photometric method show similar colours to those within a kiloparsec of the sun, both in the optical and the infrared. Together with the evidence from line indices, this suggests that there are significant numbers of M-stars with moderate to high metallicities extending well above the plane of the galaxy.
Our sample of stars with should be complete for mid-M dwarfs of near-solar metallicity but is incomplete for low-metallicity M dwarfs many of which have bluer colours or are more distant. Determining the metallicity of individual sources is difficult without exceptionally deep spectroscopy. If one or more of our sources are at low metallicity, they may be even cooler - and hence somewhat closer - than we believe, although our spectroscopic results indicate that fewer than 6% of M stars are likely to fall into this category.
Acknowledgements
ERS gratefully acknowledges support from the Particle Physics and Astronomy Research Council (PPARC). The authors thanks Gerry Gilmore, Laura Douglas and Avon Huxor for useful discussions. We also thank our referee, Mike Bessell for comments and suggestions that have improved the paper.
Based on observations made with the NASA/ESA Hubble Space Telescope, obtained from the Data Archive at the Space Telescope Science Institute, which is operated by the Association of Universities for Research in Astronomy, Inc., under NASA contract NAS 5-26555. This work is also based in part on observations made with the Spitzer Space Telescope, which is operated by the Jet Propulsion Laboratory, California Institute of Technology under a contract with NASA. We thank the GOODS team for their hard work in making these high quality datasets public.
Results from the BDF fields was based on observations made with ESO telescopes at the Paranal Observatory under programme IDs 69.A-0656 and 71.A-0290.
References
- Alcaino & Liller (1984) Alcaino, G., & Liller, W. 1984, ApJS, 56, 19
- Allard & Hauschildt (1995) Allard F., Hauschildt P. H., 1995, ApJ, 445, 433
- Alcock et al. (2000) Alcock C., et al., 2000, ApJ, 542, 281
- Alcock et al. (2001) Alcock C., et al., 2001, Natur, 414, 6
- Bahcall et al. (1994) Bahcall J. N., Flynn C., Gould A., Kirhakos S., 1994, ApJ, 435, L51
- Bennett (2005) Bennett D. P., 2005, ApJ, 633, 906
- Bertin & Arnouts (1996) Bertin E., Arnouts S., 1996, A&AS, 117, 393
- Bertone et al. (2004) Bertone E., Buzzoni A., Chávez M., Rodríguez-Merino L. H., 2004, AJ, 128, 829
- Bessell (1990) Bessell M. S., 1990, PASP, 102, 1181
- Bessell (1991) Bessell M. S., 1991, AJ, 101, 662
- Bochanski et al. (2007) Bochanski J. J., West A. A., Hawley S. L., Covey K. R., 2007, AJ, 133, 531
- Bouwens et al. (2004) Bouwens R. J., Illingworth G. D., Blakeslee J. P., Broadhurst T. J., Franx M., 2004, ApJ, 611, L1
- Bremer et al. (2004) Bremer M. N., Lehnert M. D., Waddington I., Hardcastle M. J., Boyce P. J., Phillipps S., 2004, MNRAS, 347, L7
- Bunker et al. (2003) Bunker A. J., Stanway E. R., Ellis R. S., McMahon R. G., McCarthy P. J., 2003, MNRAS, 342, L47
- Burgasser & McElwain (2006) Burgasser A. J., McElwain M. W., 2006, AJ, 131, 1007
- Burgasser, Cruz, & Kirkpatrick (2007) Burgasser A. J., Cruz K. L., Kirkpatrick J. D., 2007, ApJ, 657, 494
- Castelli & Kurucz (2004) Castelli F., Kurucz R. L., 2004, astro, arXiv:astro-ph/0405087
- Cool, Piotto, & King (1996) Cool A. M., Piotto G., King I. R., 1996, ApJ, 468, 655
- Dickinson & GOODS Team (2005) Dickinson M., GOODS Team, 2005, AAS, 37, 1324
- Douglas et al. (2007) Douglas L. S., Bremer M. N., Stanway E. R., Lehnert M. D., 2007, MNRAS, 376, 1393
- Faber & French (1980) Faber S. M., French H. B., 1980, ApJ, 235, 405
- Giavalisco et al. (2004) Giavalisco M., et al., 2004, ApJ, 600, L93
- Gizis (1997) Gizis J. E., 1997, AJ, 113, 806
- Gizis & Reid (1999) Gizis J. E., Reid I. N., 1999, AJ, 117, 508
- Gliese & Jahreiss (1995) Gliese W., Jahreiss H., 1995, yCat, 5070, 0
- Gliese & Jahreiss (1989) Gliese W., Jahreiss H., 1989, stct.proc, 3
- Hawley, Gizis, & Reid (1996) Hawley S. L., Gizis J. E., Reid I. N., 1996, AJ, 112, 2799
- Hawley et al. (2002) Hawley S. L., et al., 2002, AJ, 123, 3409
- Ibata et al. (1999) Ibata, R. A., Richer, H. B., Fahlman, G. G., Bolte, M., Bond, H. E., Hesser, J. E., Pryor, C., & Stetson, P. B. 1999, ApJS, 120, 265
- Kurucz (1996) Kurucz R. L., 1996, ASPC, 108, 2
- Layden et al. (2005) Layden A. C., Sarajedini A., von Hippel T., Cool A. M., 2005, ApJ, 632, 266
- Leggett et al. (2002) Leggett S. K., Hauschildt P. H., Allard F., Geballe T. R., Baron E., 2002, MNRAS, 332, 78
- Lehnert & Bremer (2003) Lehnert M. D., Bremer M., 2003, ApJ, 593, 630
- Lejeune, Cuisinier, & Buser (1998) Lejeune T., Cuisinier F., Buser R., 1998, A&AS, 130, 65
- Mahabal et al. (2005) Mahabal A., Stern D., Bogosavljević M., Djorgovski S. G., Thompson D., 2005, ApJ, 634, L9
- Oke & Gunn (1983) Oke J. B., Gunn J. E., 1983, ApJ, 266, 713
- Patten et al. (2006) Patten B. M., Stauffer J. R., Burrows A., Marengo M., Hora J. L., Luhman K. L., Sonnett S. M., Henry T. J., Raghavan D., Megeath S. T., Liebert J., Fazio G. G., 2006, ApJ, 651, 502
- Pickles (1998) Pickles A. J., 1998, PASP, 110, 863
- Reid et al. (1995) Reid I. N., Hawley S. L., Gizis J. E., 1995, AJ, 110, 1838
- Reid et al. (1996) Reid I. N., Yan L., Majewski S., Thompson I., Smail I., 1996, AJ, 112, 1472
- Richer et al. (2006) Richer H. B., et al., 2006, Sci, 313, 936
- Richer et al. (2004) Richer H. B., et al., 2004, AJ, 127, 2771
- Sarajedini et al. (2007) Sarajedini A., et al., 2007, AJ, 133, 1658
- Schiavon et al. (1997) Schiavon R. P., Barbuy B., Rossi S. C. F., Milone A., 1997, ApJ, 479, 902
- Scoville et al. (2006) Scoville N., et al., 2007, ApJS, 172, 1
- Shankar & Mathur (2007) Shankar F., Mathur S., 2007, ApJ, 660, 1051
- Stanway et al. (2004a) Stanway E. R., Bunker A. J., McMahon R. G., Ellis R. S., Treu T., McCarthy P. J., 2004a, ApJ, 607, 704
- Stanway et al. (2004b) Stanway E. R., Glazebrook K., Bunker A. J., Abraham R. G., Hook I., Rhoads J., McCarthy P. J., Boyle B., Colless M., Crampton D., Couch W., Jørgensen I., Malhotra S., Murowinski R., Roth K., Savaglio S., Tsvetanov Z., 2004b, ApJ, 604, L13
- Stern et al. (2006) Stern D., et al., 2007, ApJ, 663, 677
- Tisserand et al. (2007) Tisserand P., et al., 2007, A&A, 469, 387
- Vanzella et al. (2006) Vanzella E., et al., 2006, A&A, 454, 423
- Verma et al. (2007) Verma A., Lehnert M. D., Förster Schreiber N. M., Bremer M. N., Douglas L., 2007, MNRAS, 377, 1024
- West et al. (2005) West A. A., Walkowicz L. M., Hawley S. L., 2005, PASP, 117, 706
- York et al. (2000) York D. G., et al., 2000, AJ, 120, 1579
- Zheng et al. (2001) Zheng Z., Flynn C., Gould A., Bahcall J. N., Salim S., 2001, ApJ, 555, 393