The Monitor project: Rotation of low-mass stars in NGC 2362 – testing the disc regulation paradigm at 5 Myr
Abstract
We report on the results of a time-series photometric survey of NGC 2362, carried out using the CTIO 4m Blanco telescope and Mosaic-II detector as part of the Monitor project. Rotation periods were derived for candidate cluster members over the mass range . The rotation period distributions show a clear mass-dependent morphology, qualitatively similar to that in NGC 2264, as would be expected from the age of this cluster. Using models of angular momentum evolution, we show that angular momentum losses over the age range appear to be needed in order to reproduce the evolution of the slowest rotators in the sample from the ONC to NGC 2362, as found by many previous studies. By incorporating Spitzer IRAC mid-IR measurements, we found that objects showing mid-IR excesses indicative of the presence of circumstellar discs were all slow rotators, as would be expected in the disc regulation paradigm for early pre-main sequence angular momentum evolution, but this result is not statistically significant at present, given the extremely limited sample size.
keywords:
open clusters and associations: individual: NGC 2362 – techniques: photometric – stars: pre-main-sequence – stars: rotation – surveys.1 Introduction
NGC 2362 is a very young open cluster, at a moderate distance. We adopt the parameters of Moitinho et al. (2001) for the remainder of this work: an age of , distance and reddening . Note however that there is some controversy in the literature regarding the age of this cluster, with estimates ranging from . Mayne et al. (2007) have examined the relative ages of young open clusters, finding that NGC 2362 does indeed seem to be older than the ONC, but that it may be younger than IC 348, and they suggest an age of .
Nevertheless, the extremely young age, and lack of substantial nebulosity or differential reddening in this cluster make it an ideal testing ground for theories of pre-main sequence stellar evolution. Dahm (2005) carried out an extensive spectroscopic survey, concentrating on the H and Li i features, finding that a large fraction ( per cent) of the T Tauri star (TTS) population in NGC 2362 is composed of weak-line emitters (WTTS), as expected given the canonical age for the cluster. They found that per cent of the TTS population are likely to still be undergoing accretion on the basis of the measured H equivalent widths, which is comparable to the fraction of objects found to exhibit L-band excess emission indicative of an inner disc by Haisch et al. (2001).
NGC 2362 has also been observed more recently with Spitzer using the IRAC (Infra-Red Array Camera) instrument in the , , and bands. Dahm & Hillenbrand (2007) used these observations to derive spectral energy distributions for candidate NGC 2362 members, and to characterise disc emission in objects exhibiting infra-red excesses. They found an upper limit to the fraction of objects exhibiting optically thick discs of per cent, with an additional per cent of objects exhibiting weak or optically thin discs.
1.1 Evolution of stellar angular momentum
A long-standing issue in our understanding of the evolution of stellar rotation rates on the pre-main sequence is that significant loss of angular momentum appears to be required in order to reproduce the observed rotation rates of low-mass stars.
During the first few Myr of their evolution, low-mass pre-main sequence (PMS) stars contract by factors of . Hence, if angular momentum is conserved, all sub-solar mass stars, which are thought to have initial rotation periods of , should rotate at periods shorter than after only . Observations at these ages show that some stars rotate much slower than this rate, and indeed the slowest rotators do not appear to spin up at all over the first few Myr of their evolution.
The most popular scenarios for solving this problem invoke additional angular momentum losses resulting from the interaction of the star with a circumstellar disc (e.g. Königl 1991). In the “disc locking” scenario, this interaction results in transfer of angular momentum from the star to the disc, which maintains a constant stellar rotation rate until the disc dissipates sufficiently to break the coupling. Alternatively, the angular momentum may be lost through an enhanced stellar wind, powered by the accretion of material from the disc (Matt & Pudritz, 2005).
In both cases, the most basic prediction of the models is that there should be a correlation between rotation rate and the presence of discs, in the sense that the slow rotators should still be surrounded by discs, whereas for the rapid rotators, the discs should have dispersed.
Much of the recent literature on rotation has been devoted to the search for a correlation between rotation rate and disc indicators, including diagnostics of accretion (UV excess, spectral line diagnostics such as H, etc.) and of the thermal emission from the disc itself (infra-red excess). Many of the early studies were inconclusive, due to a combination of effects including small sample sizes, biases, dependence of the adopted disc indicators on other stellar parameters (predominantly mass), and the use of ambiguous disc indicators.
Two recent studies (Rebull et al. 2006; Cieza & Baliber 2007) have claimed statistically significant detections of the expected correlation between slow rotators and circumstellar discs, in the ONC (; Hillenbrand 1997) and NGC 2264 (; Park et al. 2000), respectively. Cieza & Baliber (2006) have also examined IC 348 (; Luhman et al. 2003), but the results were ambiguous due to small number statistics. These studies have all used the IRAC instrument on the Spitzer space telescope, which provides mid-IR photometry in four broad bands: , , and . In particular, infra-red flux excesses provide a much more reliable indicator of the presence of circumstellar discs than shorter-wavelength IR excesses (e.g. in the -band). There is thus mounting evidence in favour of the disc regulation paradigm, but nevertheless, it is important to verify that this result extends to older open clusters.
1.2 The survey
We have undertaken a photometric survey in NGC 2362 using the CTIO 4m Blanco telescope and Mosaic-II imager. Our goals are two-fold: first, to study rotation periods for a sample of low-mass members, covering K and M spectral types, down to , and second, to look for eclipsing binary systems containing low-mass stars, to obtain dynamical mass measurements in conjunction with radial velocities from follow-up spectroscopy. Such systems provide the most accurate determinations of fundamental stellar parameters (in particular, masses) for input to models of stellar evolution, which are poorly constrained in this age range. We defer discussion of our search for occultations to another publication (Miller et al., in preparation).
These observations are part of a larger photometric monitoring survey of young open clusters over a range of ages and metalicities (the Monitor project; Hodgkin et al. 2006 and Aigrain et al. 2007).
The remainder of the paper is structured as follows: the observations and data reduction are described in §2, and the colour magnitude diagram (CMD) of the cluster and candidate membership selection are presented in §3. The method we use for obtaining photometric periods is summarised in §4 (see Irwin et al. 2006 for a more detailed discussion). Our results are given in §5, and §6 summarises our conclusions.
In several of the following sections, we use mass and radius estimates for the cluster members. These were derived from the NextGen models, using the -band magnitudes, rather than colour or magnitude, for reasons discussed in §3.1.
2 Observations and data reduction
Photometric monitoring observations were obtained using the 4m CTIO Blanco telescope, with the Mosaic-II imager, on –nights between 2005 Dec 24 and 2006 Jan 06. This instrument provides a field of view of (), using a mosaic of eight pixel CCDs, at a scale of .
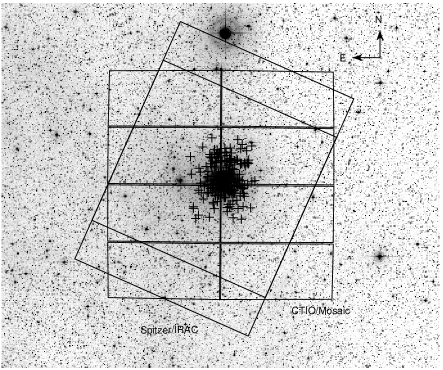
A single field in NGC 2362, centred on the star CMa (see Figure 1), was observed for per night, in parallel with another field in the cluster M50, the results from which will be published separately. Exposure times were in -band, giving a cadence of (composed of exposures plus readout time, slewing between M50 and NGC 2362 during readout). We also obtained deep -band exposures (, , and ) which were stacked and used to produce a colour-magnitude diagram of the cluster.
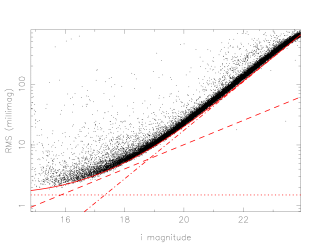
For a full description of our data reduction steps, the reader is referred to Irwin et al. (2007a). Briefly, we used the pipeline for the INT wide-field survey (Irwin & Lewis, 2001) for 2-D instrumental signature removal (bias correction, flatfielding, defringing) and astrometric and photometric calibration. We then generated a master catalogue for each filter by stacking of the frames taken in the best conditions (seeing, sky brightness and transparency) and running the source detection software on the stacked image. The resulting source positions were used to perform aperture photometry on all of the time-series images. We achieved a per data point photometric precision of for the brightest objects, with RMS scatter per cent for (see Figure 2). A signal-to-noise ratio of (corresponding approximately to the detection limit for point sources on a single frame of the differential photometry) is reached at .
Our source detection software flags any objects detected as having overlapping isophotes. This information is used, in conjunction with a morphological image classification flag also generated by the pipeline software (Irwin & Lewis, 2001) to allow us to identify non-stellar or blended objects in the time-series photometry.
Photometric calibration of our data was carried out using regular observations of Landolt (1992) equatorial standard star fields in the usual way.
Light curves were extracted from the data for objects, of which had stellar morphological classifications ( per cent of these are flagged as blended), using our standard aperture photometry techniques, described in Irwin et al. (2007a). We fit a 2-D quadratic polynomial to the residuals in each frame (measured for each object as the difference between its magnitude on the frame in question and the median calculated across all frames) as a function of position, for each of the CCDs separately. Subsequent removal of this function accounts for effects such as varying differential atmospheric extinction across each frame. Over a single CCD, the spatially-varying part of the correction remains small, typically peak-to-peak. The reasons for using this technique are discussed in more detail in Irwin et al. (2007a).
For the production of deep CMDs, we stacked 20 -band observations, taken in good seeing and photometric conditions, and all of the -band observations. The limiting magnitudes on these stacked images, measured as the approximate magnitude at which our catalogues are per cent complete, were and .
3 Selection of candidate low-mass members
Catalogues of candidate NGC 2362 members are available in the literature (Moitinho et al. 2001; Dahm 2005), but we elected to perform a new photometric selection using versus CMDs from our data in order to properly match the relatively large field of view of our time-series observations compared to these previous studies.
3.1 The versus CMD
Our CMD of NGC 2362 is shown in Figure 3. The and measurements were converted to the standard Johnson-Cousins photometric system using colour equations derived from our standard star observations:
| (1) | |||||
| (2) | |||||
| (3) |
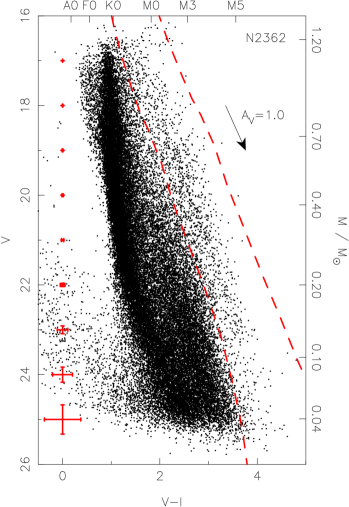
Candidate cluster members were selected by defining an empirical cluster sequence ‘by eye’ to follow the clearly-visible cluster single-star sequence. The cuts were defined by moving this line along a vector perpendicular to the cluster sequence, by amounts and as measured along this vector, where is the photometric error in the colour. The values of used were for the lower line and for the upper line on the diagram, making the brighter region wider to avoid rejecting binary and multiple systems, which are overluminous for their colour compared to single stars. candidate photometric members were selected, over the full magnitude range from to , but the well-defined cluster sequence appears to terminate at , or , with a few candidate brown dwarfs found below this limit, but with high field contamination.
We also considered using the model isochrones of Baraffe et al. (1998) and Chabrier et al. (2000) for selecting candidate members. The NextGen model isochrones were found to be unsuitable due to the known discrepancy between these models and observations in the colour for (corresponding here to ). This was examined in more detail by Baraffe et al. (1998), and is due to a missing source of opacity at these temperatures, leading to overestimation of the -band flux. Consequently, when we have used the NextGen isochrones to determine model masses and radii for our objects, the -band absolute magnitudes were used to perform the relevant look-up, since these are less susceptible to the missing source of opacity, and hence give more robust estimates.
3.2 Contamination
Since the cluster sequence is not well-separated from the field in the CMD, it is important to estimate the level of field star contamination in the sample of candidate cluster members. This has been done using two independent methods.
3.2.1 Galactic models
The Besançon Galactic models (Robin et al., 2003) were used to to generate a simulated catalogue of objects passing our selection criteria at the Galactic coordinates of NGC 2362 (, ), covering the total FoV of (including gaps between detectors). The same selection process as above for the cluster members was applied to this catalogue to find the contaminant objects. A total of simulated objects passed these membership selection criteria, giving an overall contamination level of per cent after correcting for bins where the number of objects predicted by the models exceeded the number actually observed by per cent (we simply assumed per cent field contamination in these bins). Figure 4 shows the contamination as a function of magnitude. Note that this figure is somewhat uncertain due to the need to use Galactic models, and especially given the overestimation of the numbers of observed objects by the models, which lends low confidence to the results derived in this section. We therefore pursue an alternative method for obtaining a limit to the contamination level below.

3.2.2 Radial distribution
An alternative method for generating a simple upper limit to the contamination level has also been applied to verify the results obtained from the Galactic models. Since the cluster is relatively centrally concentrated, we divided the population of candidate cluster members into two bins in radius, using as the centre the position of the star CMa. Number counts of objects selected using the CMD as candidate members were then produced inside and outside of a radius, chosen since it roughly divides the area covered into two, providing good statistics in both bins. By assuming the stars inside are cluster members, and those outside are not, we can obtain a simple upper limit to the contamination level by dividing these counts, and correcting for the relative area covered by each bin.
Figure 5 shows the resulting distribution of contamination as a function of magnitude, for comparison with the Galactic model results in Figure 4. The overall contamination level integrated over all magnitude bins from this method is per cent, comparable to the estimate using the Galactic models from Section 3.2.1.

4 Period detection
4.1 Method
The method we use for detection of periodic variables is described in detail in Irwin et al. (2006), and we provide only a brief summary here. The method uses least-squares fitting of sine curves to the time series (in magnitudes) for all candidate cluster members, using the form:
| (4) |
where (the DC light curve level), (the amplitude) and (the phase) are free parameters at each value of over an equally-spaced grid of frequencies, corresponding to periods from for the present data-set.
Periodic variable light curves were selected by evaluating the change in reduced :
| (5) |
where is the reduced of the original light curve with respect to a constant model, and is the reduced of the light curve with the smoothed, phase-folded version subtracted. This threshold was used for the M34 data and appears to work well here too, carefully checked by examining all the light curves for two of the detectors, chosen randomly. A total of objects were selected by this automated part of the procedure.
The selected light curves were examined by eye, to define the final sample of periodic variables. A total of light curves were selected, with the remainder appearing non-variable or too ambiguous to be included.
4.2 Simulations
Monte Carlo simulations were performed following the method detailed in Irwin et al. (2006), injecting simulated signals of per cent amplitude and periods chosen following a uniform distribution on period from to , into light curves covering a uniform distribution in mass, from to . A total of objects were simulated.
The results of the simulations are shown in Figure 6 as diagrams of completeness, reliability and contamination as a function of period and stellar mass. Broadly, our period detections are close to per cent complete from down to , with remarkably little period dependence. Figure 7 shows a comparison of the detected periods with real periods for our simulated objects, indicating good reliability.


4.3 Detection rate and reliability
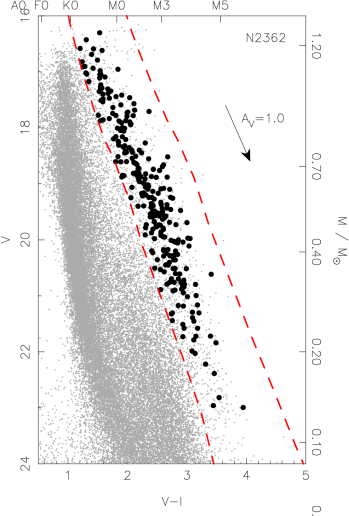
The locations of our detected periodic variable candidate cluster members on a versus CMD of NGC 2362 are shown in Figure 8. The diagram indicates that the majority of the detections lie on the single-star cluster sequence, as would be expected for rotation in cluster stars as opposed to, say, eclipsing binaries.
The properties of all our rotation candidates are listed in Table 1.
| Identifier | RA | Dec | ||||||||||
|---|---|---|---|---|---|---|---|---|---|---|---|---|
| J2000 | J2000 | (mag) | (mag) | (mag) | (mag) | (mag) | (mag) | (days) | (mag) | () | () | |
| N2362-1-1357 | 07 17 34.82 | -25 10 07.0 | 16.90 | 15.62 | 7.344 | 0.005 | 1.07 | 1.70 | ||||
| N2362-1-2076 | 07 17 39.10 | -25 11 32.6 | 16.91 | 15.64 | 7.768 | 0.003 | 1.06 | 1.70 | ||||
| N2362-1-3162 | 07 17 48.43 | -25 13 55.3 | 21.73 | 18.80 | 2.463 | 0.019 | 0.19 | 0.73 | ||||
| N2362-1-4646 | 07 18 00.08 | -25 08 16.3 | 20.52 | 17.52 | 1.141 | 0.015 | 0.40 | 1.08 | ||||
| N2362-1-4685 | 07 18 00.92 | -25 14 24.5 | 21.31 | 18.10 | 10.245 | 0.014 | 0.29 | 0.91 |
5 Results
5.1 NGC 2362 rotation periods
Plots of period as a function of colour and mass for the objects photometrically selected as possible cluster members are shown in Figure 9. Below (or M0), these diagrams reveal a correlation between stellar mass (or spectral type) and the longest rotation period seen at that mass, with a clear lack of slow rotators at very low masses. This trend is also followed by the majority of the rotators in this mass range, with only a tail of faster rotators to periods, and very few objects rotating faster than this. This is very similar to what we found in the earlier NGC 2516 and NGC 2547 studies (Irwin et al. 2007b; Irwin et al. 2007c).

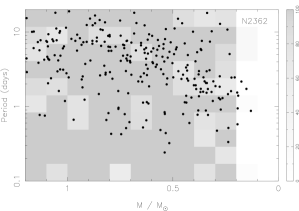
Above , the distribution appears to show little mass dependence, with the slowest rotators all exhibiting periods.
These morphological features do not appear to be a result of sample biases. In particular, the simulations show that the survey is sensitive to much shorter periods than , and the upper limit in detectable periods is not mass-dependent, so this cannot explain the sloping morphology of the upper envelope of rotation periods in Figure 9 at low masses.
Figure 10 may indicate a slight bias toward shorter periods at low masses, if the distribution of amplitudes in the (top) and bins was the same, with no counterpart to the small group of objects at periods of and amplitudes per cent visible in the lower panel. However, the result is not highly significant due to small number statistics in the lower mass bin, and it is possible that these objects may be false positive detections, since at these amplitudes and periods, the effect of light curve systematics is sometimes difficult to distinguish from real variability.


5.1.1 Period histograms
In order to quantify the morphology of Figure 9, we have used histograms of the rotation period distributions in two broad mass bins, and , shown in Figure 11. We have attempted to correct the distributions for the effects of incompleteness and (un)reliability using the simulations described in §4.2, following the method used in Irwin et al. (2006). The results of doing this are shown in the solid histograms in Figure 11, and the raw period distributions in the dashed histograms.


The period distributions in the two mass bins of Figure 11 show clear differences, with the low-mass stars () showing a strongly peaked rotational period distribution, with a maximum at , whereas the higher-mass stars () show a broader distribution. We applied a two-sided Kolmogorov-Smirnov test to the corrected distributions to confirm the statistical significance of this result, finding a probability of that the distributions were drawn from the same parent population.
The implication of this result is that the observed morphology in Figure 9, and in particular the increase of the longest observed rotation period as a function of increasing mass, a trend followed also by the bulk of the rotators, is real and statistically significant.
5.2 Comparison with other data-sets
5.2.1 Period versus mass diagrams
Figure 12 shows a diagram of rotation period as a function of stellar mass for the ONC, NGC 2264, NGC 2362, NGC 2547 (; Naylor & Jeffries 2006) and NGC 2516 (; Jeffries, Thurston & Hambly 2001). Data sources for each cluster are indicated in the figure caption.

The diagram clearly shows a gradual evolutionary sequence, from a relatively flat mass-dependence of the rotation periods in the ONC (), to a sloping relation in NGC 2264 and NGC 2362, and an increasingly more pronounced slope at the older ages of NGC 2547 and NGC 2516.
The distribution for NGC 2362 appears to show a slightly more pronounced sloping relation than NGC 2264, but the distributions are very similar, indicating that these clusters are close in “rotational age”. Nevertheless, the rotation period results seem to indicate that the canonical age sequence, from youngest to oldest, of the ONC, NGC 2264 and then NGC 2362, is correct.
5.2.2 Comparison with rotational evolution models
By comparing the observed rotation periods as a function of age with models of rotational evolution on the pre-main sequence, we can constrain the amount of angular momentum loss required during this part of the evolution.
In order to do this, we have used a simple model of solid body rotation from Irwin et al. (2007b), including angular momentum losses due to main sequence magnetically driven stellar winds (the effect of which is close to negligible during this age range), but specifically, not including any additional sources of angular momentum loss (“disc locking” or similar) in order to see if the latter are required to explain the observations. Our models from the earlier NGC 2516 and NGC 2547 work incorporated a simple prescription for core-envelope decoupling, but at these early ages the stars are fully-convective, so it is not necessary to incorporate this effect here.
Figure 13 shows the results of attempting to evolve the measured rotation periods in the ONC forward in time to the age of NGC 2362 using these models.

The model clearly cannot successfully reproduce the NGC 2362 distribution. Although there is some hint of the sloping relation at low masses visible in the evolved ONC distribution, the slowest rotators at are clearly rotating too rapidly. However, the lower envelope of fast rotators is reasonably well-reproduced throughout the mass range.
We suspect that the mass determinations (which are based on -band luminosity) are somewhat unreliable in the ONC, due to the presence of strong spatially-variable extinction in this cluster. This introduces horizontal scatter in the period versus mass plane. It has been necessary to assume a typical (low) value of this parameter for many of the low-mass detections due to a lack of suitable estimates based on spectroscopy from Hillenbrand (1997). Hence, much of the scatter at low masses in the figure may be due to underestimation of the extinction, and hence of the masses, for highly reddened objects.
However, at the high-mass end, the diagram is more reliable, since the majority of the scatter due to extinction will only move objects to the right. Therefore, the result that the slowest rotators at these masses are rotating too rapidly is still significant. This indicates that an additional source of angular momentum loss is required, in order to hold the rotation periods of these stars approximately constant (since the slowest rotators in the ONC and NGC 2362 appear to have very similar periods of ). This is precisely the result found by many other authors, and provides evidence in support of disc regulation, or a similar mechanism, operating over the early-PMS stages of the evolution.
We note that the age of the ONC is still a subject of controversy in the literature at the time of writing. Some recent studies (e.g. Sandstrom et al. 2007; Jeffries 2007) have indicated that the distance to the ONC may be , rather than the conventional value of used by Hillenbrand (1997). Depending on the PMS evolutionary tracks used, this can raise the derived age to , which may help to explain these apparent discrepancies. We have explored this further in Figure 14, which shows the result of assuming a age for the ONC, and evolving the rotation period distribution forward in time. Since the models then predict less spin-up, it is not surprising that the slow rotators at solar mass are better-fit, but still with evidence for (more modest) angular momentum loss being required to fully-reproduce the NGC 2362 slow rotator population. However, at lower masses, the resulting slower rotation for the bulk of these objects places the upper limit to the rotation periods even higher than observed in NGC 2362. Raising the age of the ONC does not therefore readily provide an explanation for the problems at the low-mass end that have already been discussed.

We have also repeated the analysis using NGC 2264 as the initial condition. Figure 15 shows the results, where we have assumed a age for this cluster. NGC 2264 has much less differentially-variable reddening than the ONC, so the low-mass end of the diagram should be more reliably reproduced in this cluster.

The diagram indicates that this is indeed the case, and that the sloping relation for the slow rotators at low masses in NGC 2362 is well-reproduced by evolving the NGC 2264 observations forward in time. Again however, the slowest rotators at higher masses () appear to rotate too rapidly compared to the NGC 2362 observations.
Given that these models do not incorporate additional sources of angular momentum loss applying to the early-PMS, such as disc regulation, the ability of the models to reproduce the form of the sloping relation for the lowest-mass stars () indicates that these stars do not experience significant angular momentum loss at this stage of their evolution, in contrast to the higher-mass stars.
We also demonstrated in our earlier NGC 2516 and NGC 2547 publications (Irwin et al. 2007b; Irwin et al. 2007c), that a similar statement applies to the lowest-mass stars at later stages in their evolution: even from the age of NGC 2362 to the age of NGC 2516, additional angular momentum loss at above that expected due to (saturated) stellar winds does not appear to be required. Given that the higher-mass stars do appear to need additional angular momentum losses, this implies that such losses are mass-dependent, in the sense that lower-mass stars experience less PMS angular momentum loss, or that they lose angular momentum over a shorter timescale () than the higher-mass stars.
5.3 Comparison with mid-IR Spitzer observations
In order to search for the correlation between rotation period and the presence of discs expected in the disc regulation paradigm for early-PMS angular momentum evolution, we combined the present optical data-set with the Spitzer IRAC photometry of Dahm & Hillenbrand (2007). Note that Dahm & Hillenbrand (2007) only give mid-IR measurements for objects detected in their combined photometric and spectroscopic survey of the central of the cluster (Dahm, 2005), whereas the Spitzer field-of-view is somewhat larger, so this decreases the available sample size. A re-analysis of the Spitzer observations to resolve this problem will be attempted in a future publication.
There are stars in common with the catalogue of Dahm & Hillenbrand (2007) which have rotation period measurements. However, in order to obtain a meaningful result, we must restrict the mass range over which the samples are compared: not doing so would introduce a bias at the faint end toward those objects with excesses, since they are more readily detected in the mid-IR data. Examining Figure 1 of Dahm & Hillenbrand (2007) indicates that the IRAC detection limit is at , and using the models of Baraffe et al. (1998) for the -band (which is a reasonable approximation to the Spitzer band), this corresponds to a conservative limit of , which has been adopted henceforth.
We have considered two commonly-used indicators of the presence of a circumstellar disc: the slope of the IRAC spectral energy distribution (SED), , as used by Dahm & Hillenbrand (2007), and the colour, as used by Cieza & Baliber (2006) and Cieza & Baliber (2007). Figure 16 shows a plot of these quantities as a function of rotation period.


Thresholds were defined in these quantities, following Dahm & Hillenbrand (2007) for , with stellar photospheres having , “weak discs” , and “primordial” or optically thick discs . In colour, we follow Cieza & Baliber (2007), and use a threshold of to identify objects with mid-IR excesses indicative of the presence of discs. Figure 16 clearly indicates that the “primordial” discs as defined by SED slope, and the excess objects in , are essentially the same.
Both panels of Figure 16 indicate that the objects showing strong disc signatures all have long periods, whereas the remainder of the objects show a range of periods, as would be expected in the disc regulation paradigm. This is also seen in distributions of rotation periods in these bins, which are shown in Figure 17.

Applying a two-sided K-S test to the distributions of objects with and without IR excesses gave probabilities of (using to select the objects with significant excesses, corresponding to the “primordial disc” objects in Figure 16), and (using ) that the distributions were drawn from the same parent population. Since the K-S test is not strictly appropriate for such a small sample size, we also considered a simple probabilistic argument: of the objects without excesses, have periods . The probability that all three objects with excesses were drawn from this same parent population is therefore . These results indicate that the differences are not statistically significant. This is most likely due to the small sample size.
In spite of this, the distributions do indeed hint at the expected result for the disc regulation paradigm, that the objects with discs should be slow rotators, as seen e.g. by Rebull et al. (2006) and Cieza & Baliber (2007). Obtaining a larger sample of objects with rotation period and mid-IR measurements should improve the significance of these results, and allow more definitive conclusions to be made.
6 Conclusions
We have reported on results of an -band photometric survey of NGC 2362, covering of the cluster. Selection of candidate members in a versus colour-magnitude diagram using an empirical fit to the cluster sequence found candidate members, over a magnitude range of (covering masses from down to below the brown dwarf limit). The likely field contamination level was estimated using a simulated catalogue of field objects from the Besançon Galactic models (Robin et al., 2003), finding an overall contamination level of per cent, implying that there are real cluster members over this mass range in our field-of-view.
We derived light curves for objects in the NGC 2362 field, achieving a precision of per cent per data point over . The light curves of our candidate cluster members were searched for periodic variability corresponding to stellar rotation, giving detections over the mass range .
The rotation period distribution as a function of mass was found to show a clear mass-dependent morphology, as seen in our earlier NGC 2547, NGC 2516 and M34 studies, and qualitatively similar to that in NGC 2264, which is thought to have a similar age.
Using rotational evolution models from our earlier NGC 2516 work (Irwin et al., 2007b), we were able to show that distribution of rotation rates for the rapid rotators in NGC 2362 could be reproduced from the distributions in the ONC and NGC 2264 by evolving them forward in time to . However, for the slow rotators at masses , the predicted rotation rates from the models were too rapid, with the observations indicating that the rotation periods of these stars are in fact approximately constant over the age range. This confirms the need for additional angular momentum losses on this part of the PMS, e.g. as would be expected in the disc regulation paradigm.
Finally, we have used the Spitzer observations of Dahm & Hillenbrand (2007) to test the disc regulation hypothesis, by searching for a correlation between rotation rate and mid-IR excesses indicative of circumstellar discs. No statistically significant correlation was found with the present small sample sizes, but the objects with significant disc signatures in the sample are indeed all slow rotators.
Acknowledgments
Based on observations obtained at Cerro Tololo Inter-American Observatory, a division of the National Optical Astronomy Observatories, which is operated by the Association of Universities for Research in Astronomy, Inc. under cooperative agreement with the National Science Foundation. This publication makes use of data products from the Two Micron All Sky Survey, which is a joint project of the University of Massachusetts and the Infrared Processing and Analysis Center/California Institute of Technology, funded by the National Aeronautics and Space Administration and the National Science Foundation. This research has also made use of the SIMBAD database, operated at CDS, Strasbourg, France, and the WEBDA database, operated at the Institute for Astronomy of the University of Vienna. The Open Cluster Database, as provided by C.F. Prosser and J.R. Stauffer, may currently be accessed at http://www.noao.edu/noao/staff/cprosser/, or by anonymous ftp to 140.252.1.11, cd /pub/prosser/clusters/.
JI gratefully acknowledges the support of a PPARC studentship, and SA the support of a PPARC postdoctoral fellowship. We would like to express our gratitude to Isabelle Baraffe for providing the stellar evolution model tracks used in §5.2.2, Scott Dahm for providing the catalogue of Spitzer observations used in §5.3, and Aleks Scholz for helpful advice on the handling of Spitzer data. We also thank the referee for his comments, which have helped to improve the manuscript.
References
- Aigrain et al. (2007) Aigrain S., Hodgkin S., Irwin J., Hebb L., Irwin M., Favata F., Moraux E., Pont F., 2007, MNRAS, 375, 29
- Baraffe et al. (1998) Baraffe I., Chabrier G., Allard F., Hauschildt P.H., 1998, A&A, 337, 403
- Chabrier et al. (2000) Chabrier G., Baraffe I., Allard F., Hauschildt P.H., 2000, ApJ, 542, 464
- Cieza & Baliber (2006) Cieza L., Baliber N., 2006, ApJ, 649, 862
- Cieza & Baliber (2007) Cieza L., Baliber N., 2007, ApJ, accepted (arXiv:0707.4509)
- Dahm (2005) Dahm S.E., 2005, AJ, 130, 1805
- Dahm & Hillenbrand (2007) Dahm S.E., Hillenbrand L., 2007, AJ, 133, 2072
- Haisch et al. (2001) Haisch K.E. Jr., Lada E.A., Lada C.J., 2001, ApJ, 553, 153
- Herbst et al. (2001) Herbst W., Bailer-Jones C.A.L., Mundt R., 2001, ApJ, 554, 197
- Herbst et al. (2002) Herbst W., Bailer-Jones C.A.L., Mundt R., Meisenheimer K., Wackermann R., 2002, A&A, 396, 513
- Hillenbrand (1997) Hillenbrand L., 1997, AJ, 113, 1733
- Hodgkin et al. (2006) Hodgkin S.T., Irwin J.M., Aigrain S., Hebb L., Moraux E., Irwin M.J., 2006, AN, 327, 9
- Irwin & Lewis (2001) Irwin M.J., Lewis J.R., 2001, NewAR, 45, 105
- Irwin et al. (2006) Irwin J., Aigrain S., Hodgkin S., Irwin M., Bouvier J., Clarke C., Hebb L., Moraux E., 2006, MNRAS, 370, 954
- Irwin et al. (2007a) Irwin J., Irwin M., Aigrain S., Hodgkin S., Hebb L., Moraux E., 2007a, MNRAS, 375, 1449
- Irwin et al. (2007b) Irwin J., Aigrain S., Hodgkin S., Irwin M., Bouvier J., Clarke C., Hebb L., Moraux E., Bramich D.M., 2007b, MNRAS, 377, 741
- Irwin et al. (2007c) Irwin J., Hodgkin S., Aigrain S., Bouvier J., Hebb L., Moraux E., 2007c, MNRAS, submitted
- Jeffries et al. (2001) Jeffries R.D., Thurston M.R., Hambly N.C., 2001, A&A, 375, 863
- Jeffries et al. (2006) Jeffries R.D., Evans P.A., Pye J.P., Briggs K.R., 2006, MNRAS, 367, 781
- Jeffries (2007) Jeffries R.D., 2007, MNRAS, 376, 1109
- Königl (1991) Königl A., 1991, ApJ, 370, L37
- Lamm et al. (2005) Lamm M.H., Mundt R., Bailer-Jones C.A.L., Herbst W., 2005, A&A, 430, 1005
- Landolt (1992) Landolt A.J., 1992, AJ, 104, L340
- Luhman et al. (2003) Luhman K.L., Stauffer J.R., Muench A.A., Rieke G.H., Lada E.A., Bouvier J., Lada C.J., 2003, ApJ, 593, 1093
- Matt & Pudritz (2005) Matt S., Pudritz R. E., 2005, ApJ, 632, 135
- Mayne et al. (2007) Mayne N. J., Naylor T., Littlefair S. P., Saunders E. S., Jeffries R. D., 2007, MNRAS, 375, 1220
- Mayor (1974) Mayor M., 1974, A&A, 32, 321
- Meusinger, Stecklum & Reimann (1991) Meusinger H., Stecklum G., Reimann H.G., 1991, A&A, 245, 57
- Moitinho et al. (2001) Moitinho A., Alves J., Huélamo N., Lada C. J., 2001, ApJ, 563, 73
- Makidon et al. (2004) Makidon R.B., Rebull L.M., Strom S.E., Adams M.T., Patten B.M., 2004, AJ, 127, 2228
- Naylor & Jeffries (2006) Naylor T., Jeffries R., 2006, MNRAS, 373, 1251
- Park et al. (2000) Park B., Sung H., Bessell M., Kang Y., 2000, AJ, 120, 894
- Rebull et al. (2006) Rebull L.M., Stauffer J.R., Megeath S.T., Hora J.L., Hartmann L., ApJ, 2006, 646, 297
- Robin et al. (2003) Robin A.C., Reylé C., Derrière S., Picaud S., 2003, A&A, 409, 523
- Sandstrom et al. (2007) Sandstrom K.M., Peek J.E.G., Bower G.C., Bolatto A.D., Plambeck R.L., 2007, ApJ, 667, 1161