Eric White1, Qing He2, for the CLEO Collaboration
1University of Illinois, Urbana-Champaign, IL 61801 USA,
2University of Rochester, Rochester, NY 14627 USA
Abstract
Precision determination of the CKM angle depends upon
constraints on charm mixing amplitudes, measurements of doubly-Cabibbo
suppressed amplitudes and relative phases, and studies of charm Dalitz
plots tagged by flavor or eigenstates.
In this note we describe the technique used at CLEO-c to constrain the model
uncertainty, and its impact on measurements at
-factories presented at the Charm 2007 Workshop.
I Introduction
Measurement of the CKM angle is challenging.
Several methods have been proposed using decays;
1) the
Gronau-London-Wyler (GLW) method glw where the decays to
eigenstates
2) the Atwood-Dunietz-Soni (ADS) method ads where the decays to
flavor eigenstates
and 3) the Dalitz plot method bondar ; ggsz
where the decays to a three-body final state. This latter method has been used
recently by CLEO to
measure the strong phase via the three-body decay
paras .
Uncertainties due to charm contribute to each of these methods.
The CLEO-c physics program includes a variety of charm
measurements
that will improve the determination of from the
-factory experiments, BaBar and Belle.
The pertinent components of this program are improved constraints on charm
mixing amplitudes - important for GLW, measurement of the relative strong
phase between
and decay to - important for ADS, and studies of
charm Dalitz plots tagged by hadronic flavor or eigenstates.
The total number of charm mesons accumulated at CLEO-c will be much
smaller
than the samples already accumulated by the -factories. However,
quantum correlations in the system from provides
a unique laboratory in which to study charm.
The decay with the largest branching fraction relevant to the determination of
. Recently
Babar babar and Belle belle have
reported and
, respectively, where the
third error is the
systematic error due to modeling of the Dalitz plot.
Both and populate the Dalitz plots ,
(as well as , and ) and
so can be
used in the determination of which exploit the
interference between
() and
( where the former process is real and the latter
is proportional to bigi . Studying tagged Dalitz plots
allows a model independent determination of the relative and
phase across the Dalitz plot. We describe this technique in the following
sections.
II Determining From Decays
Our analysis follows the work outlined in bondar , ggsz , and bondar2 .
We consider the decay process , followed by the three-body
decay . Assuming no violation,
we define the decay amplitudes for the and to be
(1)
Sensitivity to the angle comes from the interference of the neutral
mesons from .
Since the meson is in a linear
combination of flavor states, the amplitude for a event originating from a decay is then
(2)
up to an overall normalization. The angle is
defined as . Here is the strong phase
difference between color-suppressed and favored amplitudes,
whilst is the ratio between the color-suppressed to favored amplitudes. Theoretical estimates place
between 0.1-0.2 gronau . This has been confirmed by BaBar
( = 0.12 0.08 0.03(syst) 0.04(model), babar ) and Belle
( = 0.16 0.05 0.01(syst) 0.05(model), belle ).
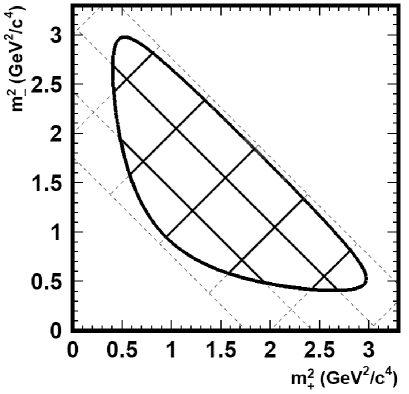
The Dalitz plot is divided into bins,
symmetric under exchange of and .
The bins are indexed from to , excluding zero, as in shown in Fig 1.
Figure 1: Binning of the Dalitz plot.
The coordinate exchange thus corresponds to the exchange of bins .
For simplicity we ignore the effects of efficiency and background in the Dalitz plot.
The number of events in the -th bin of the Dalitz plot from a decay is then expressed as
(3)
The interference between the and amplitudes is parametrized by the two quantities
(4)
and
(5)
where the integral is performed over a single bin.
The number of events in the -th bin of the Dalitz plot from a decay is then
(6)
again up to an overall normalization.
It is important to note that and depend only on the decay. These
are the quantities that we measure using CLEO-c data.
Although in principle they could be left as free parameters in a
Dalitz plot analysis from decays, their values
can be more precisely determined from correlated decays produced at CLEO-c.
Thus, we can constrain , and in turn , if we know
, , and .
The can be easily determined using flavor-tagged Dalitz plot.
In the next section we show how the can be obtained using binned,
-tagged Dalitz plots.
III Measuring From -Tagged Decays
For mesons that decay into a eigenstate, we write the initial state of the as
a linear combination of flavor eigenstates
(7)
In terms of this amplitude the number of events in the -th bin of a -tagged Dalitz plot is
(8)
where is a normalization factor.
The expression given above for can be used to measure directly,
even if only one type of tag is reconstructed. Care must be taken to use the
corresponding value of as defined above. However,
if samples of both parities are available
we can combine the expressions for and to get the following equation
(9)
We thus have an expression for measuring simply by counting events within the bins
of flavor-tagged and -tagged Dalitz plots.
At CLEO-c we produce pairs from the decay of a
in a definite eigenstate of .
Ignoring both the effects of violation,
the double tag rate for final states and is given by
(10)
where
(11)
For the time being we ignore the effects of correlations and mixing in the tagged Dalitz plot.
This is not expected to make a significant
difference for the mode, as terms proportional to and
are negligible.
III.1 Optimized Binning
Although the quantity can only be measured using a vs. double Dalitz
analysis bondar2 ,
it can still be approximated from a single Dalitz plot if the binning is fine enough.
If the bins are small enough that the phase difference and the amplitude remains constant across each bin,
the strong phase parameters become , ,
so that the equality is true.
It has been shown bondar that this equality holds for 200
or more bins, which is clearly not feasible for the number of tags produced
at CLEOc.
In order to circumvent this problem, Bondar has proposed an alternate,
model-dependent method for binning the Dalitz plotbondar2 .
The optimal choice depends on the model.
In this analysis we use the isobar model amplitude obtained from the most recent
Belle Dalitz analysis belle .
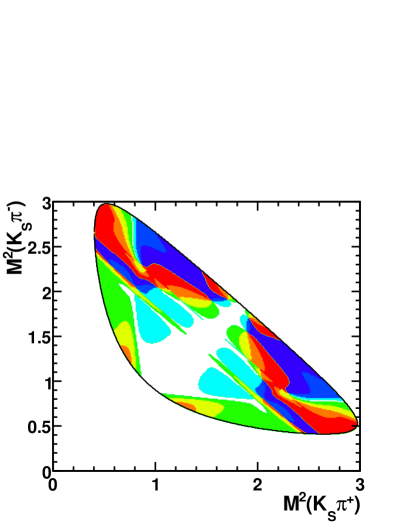
From the consideration above it is clear that a good approximation to the optimal binning is the
one obtained from the uniform division of the strong phase difference . We thus take the
definition of -th bin to be
(12)
An example of such a binning with
is shown in Fig. 2.
Figure 2: Divisions of the Dalitz plot with uniform binning of
strong phase difference with N = 8.
IV Event Selection
IV.1 Double-Tagged Events
This analysis uses a combination of two-body and flavor tags.
Since the neutral mesons are produced at threshold
they are correlated in a state.
If mixing is ignored we can determine whether the parent particle was a or
, up to DCS contributions. Similarly, if violation is ignored, then the mesons
must be in eigenstates of opposite asnersun .
To determine the flavor of the meson, we tag
events with the two-body mode.
111The inclusion of charge-conjugate modes is implied throughout our analysis.
We use the two -even tags
and , and the two -odd tags and .
We introduce two quantities that are reconstructed on both sides of a double-tagged decay.
The beam-constrained mass is defined as , where
is the beam energy and is the square of the reconstructed 3-momentum of
the meson. We require that the beam-constrained mass of the reconstructed candidate is
within 3 of the nominal mass, which corresponds to a selection criteria of
GeV.
The other quantity is the energy difference between the beam and the reconstructed ,
defined as .
We apply a selection criteria of MeV to all candidates.
Additional selection criteria are placed on the duaghter particles to ensure basic track quality.
For example, we select pion track momenta between GeV.
Both signal and tagging modes containing a are selected to be within of the mass,
which corresponds to MeV from the central mass value of 497.6 MeV.
We only reconstruct particles that decay through the channel; we do not
attempt to reconstruct .
Fake candidates can be misreconstructed from combinatoric pairs.
To suppress these events we apply a selection criteria on the flight significance to our
candidates. Additionally, we require that the mass falls within 3 of its nominal value.
IV.2 Double-Tagged Events
For decays we require the same selection criteria on charged pions and
candidates as those described for decays.
However, because of the large flight distance of the ,
the signal is reconstructed using a missing mass technique.
We require the signal side to have exactly two charged tracks. We also apply ,
, and vetoes. Using the measured momentum of the tagged , we compute the
missing momentum and energy on the signal side.
We require that the missing mass squared satisfies the condition GeV2.
The background for mode is approximately 5%.
IV.3 Double-Tagged vs.
We can increase our statistics by reconstructing events tagged
with the -even mode .
We require zero tracks and exactly one candidate on the tag side.
We veto events containing candidates, and impose similar criteria on the missing mass
as described above.
The final yields for all tag modes are summarized in Table 1
Table 1: Yields for CP-tagged and in 398 pb-1 data, by tag mode.
Tag Mode
61
194
33
90
108
263
29
21
190
-
V Combining and
The tagged Dalitz plots are included to increase the statistical accurancy of this analysis.
However, if we naively combine the Dalitz plots with and we will find our measurement
of to be biased. We must first account for the phenomenological differences between the
and models.
Since the and mesons are of opposite , the doubly-Cabibbo suppressed amplitudes
in each Dalitz plot will contribute with opposite signs. We can see this by inspecting the
decay amplitude for each each Dalitz plot
(13)
The effect of this relative minus sign is to introduce a 180∘ phase for all DCS resonances in the
model.
We can use -spin symmetry to relate the amplitudes for resonances of definite eigenvalue.
We find that these states aquire a factor of ,
where is the Cabibbo angle.
In our study we mulitply all DCS amplitudes in the model by -1.
From this “base” model we fix for each eigenstate, then vary the phase
between 0 and . For each bin we then find the largest resulting deviation in , and report this value
as the systematic uncertainty in the model.
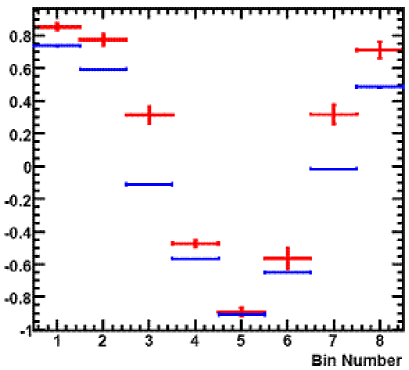
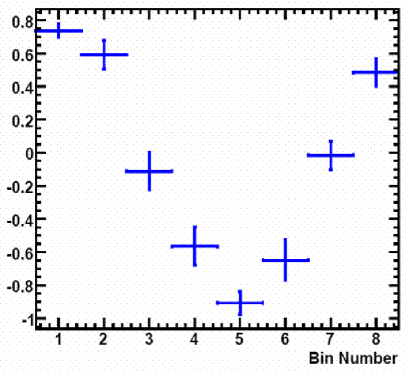
Figure 3: Values for numerically determined from our model.
values are in red, in blue.
In each bin the values for are systematically larger for .
The error bars represent the uncertainties in the model parametrization.
To better understand the difference between the and models,
we compare the numerically calculated values of in each Dalitz plot.
We find that the value for is systematically larger in each bin for .
In Fig. 3 we can see that the difference is significantly larger than the systematic
uncertainty in our model.
VI Results
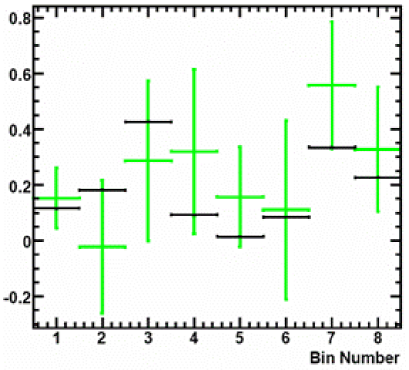
We report the difference in between and as measured in 398 pb-1 of data.
In Fig. 4 we compare the differences calculated from our model and measured from data.
Figure 4: The difference in and values of ,
numerically determined from our model (black) and measured in 398 pb-1 of data (green).
The green error bars represent the combined statistical and model uncertainty.
The error bars in this figure represent both statistical and model uncertainty combined.
With a reasonable understanding of the between the and Dalitz plots,
we can estimate the final precision with which we expect to measure once 750 pb-1 of data
is available.
The values of from our study are once again plotted in Fig. 5, but here
the error bars represent the statistical uncertainty obtained from 398 pb-1 of data
scaled up to 750 pb-1.
Figure 5: The central values of are computed from our model with expected sensitivity from
750 pb-1 of data.
The error bars are determined by scaling the statistical uncertainty obtained from 398 pb-1 of data,
then combining the model uncertainty.
We expect good sensitivity to the measurement of with the entire CLEO-c data.
This measurement can reduce the model uncertainty on to a precision of about bondar .
Acknowledgements.
We would like to thank Mats Selen from the University of Illinois, our colleagues David Asner and Paras Naik
from Carleton University, and Ed Thorndike from the University of Rochester for helping
us prepare for this conference.
Also, we would like to thank the organizers of the Charm 2007 Workshop for providing a stimulating environment
and a well-organized program of talks.
References
(1) M. Gronau and D. Wyler, Phys. Lett. B 265, 172 (1991);
M. Gronau and D. London., Phys. Lett. B 253, 483 (1991).
(2) D. Atwood, I. Dunietz, and A. Soni, Phys. Rev. Lett. 78, 3257 (1997);
D. Atwood, I. Dunietz and A. Soni, Phys. Rev. D 63, 036005 (2001).
(3) A. Bondar and A. Poluektov, hep-ph/0510246.
(4) A. Bondar and A. Poluektov, hep-ph/0703267.
(5) A. Giri, Y. Grossman, A. Soffer, and J. Zuppan, Phys. Rev. D 68,
054018 (2003).
(6) P. Naik , Phys. Rev. D 74, 031108 (2006).
(7)BaBar Collaboration, B. Aubert , Phys. Rev. Lett. 95,
121802 (2005).
(8) Belle Collaboration, A. Poluektov , Phys. Rev. D73, 112009 (2006).
(9)I. I. Y. Bigi and A. I. Sanda, Phys. Lett. B 211, 213 (1988).
(10) D. Asner, W. Sun, Phys. Rev. D 73, 034024 (2006).
(11) M. Gronau, Phys. Lett. B557, 198 (2003).
(12) H. Muramatsu et al. [CLEO Collaboration],
Phys. Rev. Lett. 89, 251802 (2002);
[Erratum-ibid. 90, 059901 (2003)], hep-ex/0207067.