High-excitation OH and H2O lines in Markarian 231: the molecular signatures of compact far-infrared continuum sources111Based on observations with the Infrared Space Observatory, an ESA project with instruments funded by ESA Member States (especially the principal investigator countries: France, Germany, Netherlands, and the United Kingdom) and with the participation of ISAS and NASA.
Abstract
The ISO/LWS far-infrared spectrum of the ultraluminous galaxy Mkn 231 shows OH and H2O lines in absorption from energy levels up to 300 K above the ground state, and emission in the [O I] 63 m and [C II] 158 m lines. Our analysis shows that OH and H2O are radiatively pumped by the far-infrared continuum emission of the galaxy. The absorptions in the high-excitation lines require high far-infrared radiation densities, allowing us to constrain the properties of the underlying continuum source. The bulk of the far-infrared continuum arises from a warm ( K), optically thick () medium of effective diameter 200-400 pc. In our best-fit model of total luminosity , the observed OH and H2O high-lying lines arise from a luminous () region with radius pc. The high surface brightness of this component suggests that its infrared emission is dominated by the AGN. The derived column densities cm-2 and cm-2 may indicate XDR chemistry, although significant starburst chemistry cannot be ruled out. The lower-lying OH, [C II] 158 m, and [O I] 63 m lines arise from a more extended ( pc) starburst region. We show that the [C II] deficit in Mkn 231 is compatible with a high average abundance of C+ because of an extreme overall luminosity to gas mass ratio. Therefore, a [C II] deficit may indicate a significant contribution to the luminosity by an AGN, and/or by extremely efficient star formation.
Subject headings:
galaxies: abundances — galaxies: individual (Mkn 231) — galaxies: ISM — galaxies: starburst — infrared: galaxies — radiative transfer1. Introduction
The peculiar ultraluminous infrared galaxy (ULIRG, L⊙) Markarian 231 (Mkn 231, 12540+5708) is the most luminous infrared galaxy in the local universe, with a 8-1000 m luminosity of L⊙ (Sanders et al., 2003), and may be a representative example of the link between AGNs and nuclear starbursts (Scoville, 2004). A QSO-like nucleus is evident from many observations: optically it is classified as a Type 1 Seyfert (Boksenberg et al., 1977; Cutri, Rieke, & Lebofsky, 1984; Baan, Salzer, & Lewinter, 1998), it exhibits UV through IR polarization and broad absorption lines (Smith et al., 1995), it has compact X-ray emission (e.g., Gallagher et al., 2002) and extremely compact mid-infrared emission (Soifer et al., 2000), and in the radio it is variable and possesses a parsec scale jet (Ulvestad, Wrobel, & Carilli, 1999; Taylor et al., 1999). Nevertheless, there is also evidence of a compact starburst in these results as well as in VLA observations of H I 21 cm absorption (Carilli, Wrobel, & Ulvestad, 1998), near-infrared observations (Tacconi et al., 2002), and millimeter CO interferometry (Bryant & Scoville, 1996; Downes & Solomon, 1998, hereafter DS98). Estimates for the starburst luminosity range from 1/3 to 2/3 of the bolometric luminosity (Davies et al., 2004, DS98).
Molecular observations have provided important clues about the concentration and kinematics of the gas in Mkn 231. DS98 showed the presence of an inner nuclear disk of radius pc in CO (2-1), and a more extended disk with lower brightness. Most of the molecular gas has been found to be dense ( cm-3) and warm ( K) from recent observations of CO and HCN submillimeter lines (Papadopoulos, Isaak, & van der Werf, 2007, hereafter PIW07). Lahuis et al. (2007) have inferred embedded starburst chemistry in Mkn 231 and other ULIRGs based on mid-IR Spitzer observations of ro-vibrational bands of warm/hot HCN and C2H2, while Graciá-Carpio et al. (2006) and Aalto et al. (2007) have inferred XDR chemistry and/or radiative pumping based on anomalous intensity ratios of millimeter lines of HCN, HNC, and HCO+.
The bulk of the luminosity in ULIRGs is emitted at far-infrared (FIR) wavelengths, where a number of molecular tracers are detected, mostly in absorption. Prominent lines of OH and H2O were detected using ISO/LWS in the FIR spectrum of Arp 220, along with absorption features by radicals such as NH and CH, revealing a chemistry that may be indicative of PDRs with plausible contribution by shocks and hot cores (González-Alfonso et al., 2004, hereafter Paper I). However, those species are also expected to be enhanced in XDRs (Meijerink & Spaans, 2005), so that the dominant chemistry in the nuclear regions of ULIRGs remains uncertain. In Paper I, the ISO/LWS FIR spectrum of Arp 220 was analyzed by means of radiative transfer calculations, which included a non-local treatment of the molecular excitation by absorption of FIR photons. Paper I showed that the population of high-excitation OH and H2O rotational levels, in evidence from absorption in high-lying lines, is pumped through absorption of FIR continuum photons, a process that requires high FIR radiation densities. The detection of these lines thus not only reveals the chemical and excitation conditions in the absorbing regions, it also sheds light on the size and characteristics of the underlying continuum FIR source in spite of the low angular resolution currently available at these wavelengths.
In this paper we extend our approach of Paper I to the ISO/LWS FIR spectrum of Mkn 231, and show that this galaxy spectrum presents striking similarities to that of Arp 220. Specifically, strong absorption in the high-excitation OH and H2O lines is also seen in Mkn 231. Rotationally excited OH in Mkn 231 has been previously detected via the -doublet transitions (Henkel, Guesten, & Baan, 1987). VLBI observations of the mega-maser OH emission at 18 cm wavelength trace an inner torus or disk of size pc around the AGN (Klöckner, Baan, & Garrett, 2003), and MERLIN observations were able to map essentially the whole single-dish mega-maser OH emission with angular resolution of (Richards et al., 2005). We analyze here both the FIR continuum emission and the high-excitation OH and H2O lines, as well as the [C II] 158 m and [O I] 63 m emission lines. In §2 we present the ISO spectroscopic observations of Mkn 231. In §3 we first analyze simple models for the FIR continuum emission from Mkn 231, and then examine how well those models reproduce the observed FIR emission and absorption lines. §4 summarizes our results. We adopt a distance to Mkn 231 of 170 Mpc ( km s-1 Mpc-1 and ).
2. Observations and results
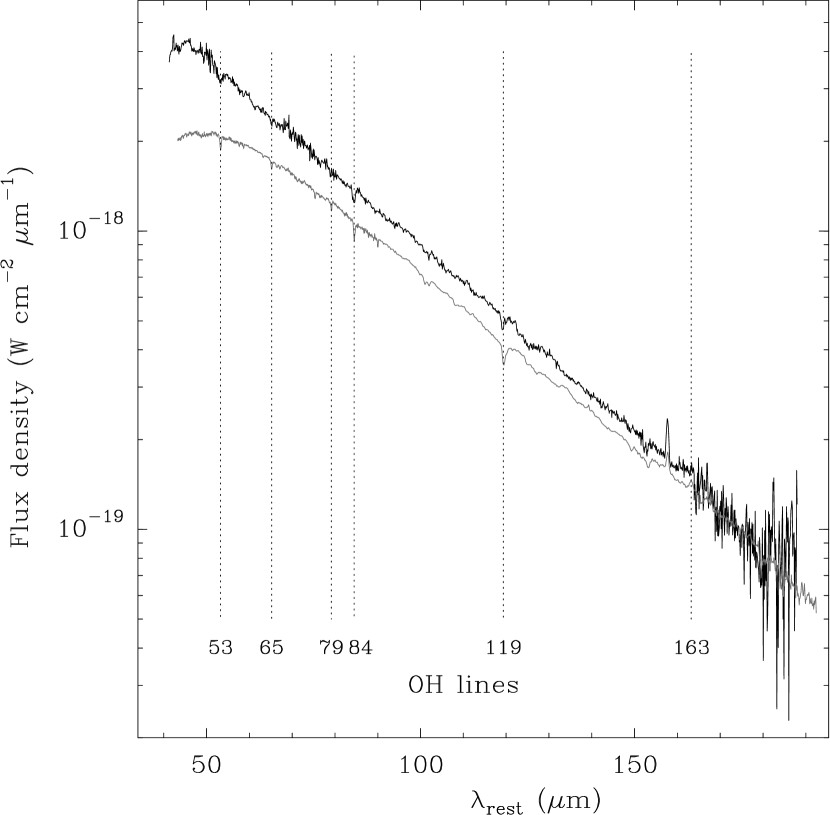
The full 43-197 m spectrum of Mkn 231 (first shown and discussed by Harvey et al, 1999), was obtained with the LWS spectrometer (Clegg et al., 1996) on board ISO (Kessler et al., 1996). In Fig. 1, it is compared with that of Arp 220 (Paper I) re-scaled to the same distance (170 Mpc). The grating spectral resolution is 0.3 m in the 43–93 m interval (detectors SW1–SW5), and 0.6 m in the 80–197 m interval (detectors LW1–LW5), corresponding to km s-1. The lines are thus unresolved in velocity space. The beam size ensures that all the FIR continuum and line emission/absorption from Mkn 231 (CO size , DS98) lie within the ISO/LWS aperture.
The data (TDT numbers 5100540, 18001306, and 60300241) were taken from the highly-processed data product (HPDP) dataset (called ’Uniformly processed LWS01 data’), and reduced using version 10.1 of the Off Line Processing (OLP) Pipeline system (Swinyard et al, 1996). We performed subsequent data processing, including co-addition, scaling, and baseline removing, using the ISO Spectral Analysis Package (ISAP; Sturm et al., 1998) and our own routines. In order to obtain a smooth spectrum throughout the whole LWS range, the flux densities given by each detector were corrected by multiplicative scale factors. Corrections were less than 25% except for detectors LW2 and LW3 (100–145 m), for which the corrections were 30%. We thus attribute an uncertainty of 30% to the overall continuum level, as well as for the line fluxes.
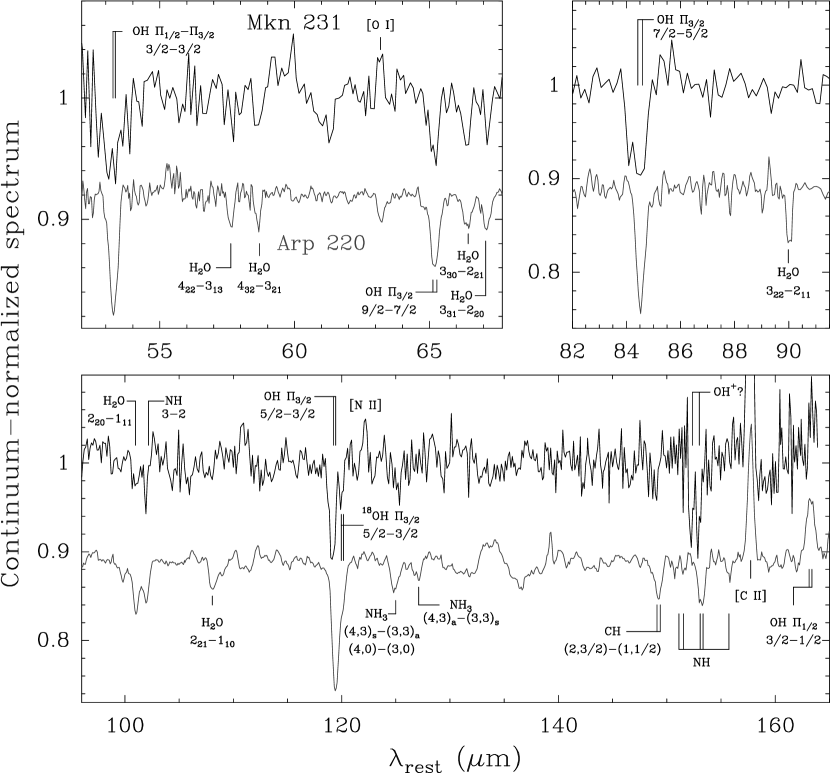
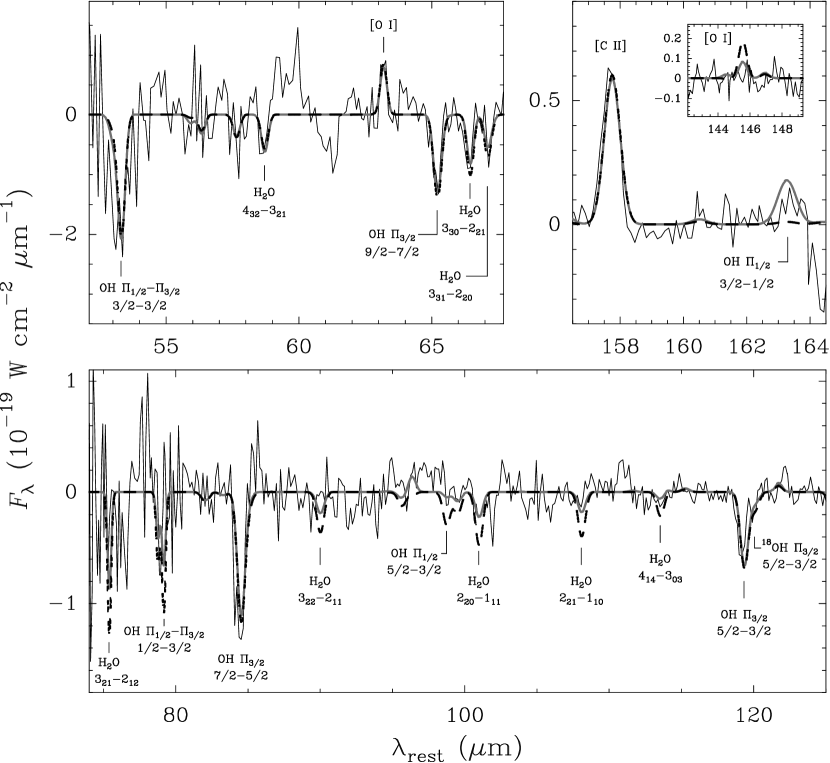
Figure 1 shows that the FIR spectra of Mkn 231 and Arp 220 are similar in key aspects (see also Fischer et al., 1999), in particular the prominent molecular absorptions mostly due to OH doublets (that will be referred to hereafter as lines) and the lack of strong fine-structure line emission typically seen in less luminous galaxies. A closer inspection of the pattern of line emission/absorption in both sources is shown in Fig. 2, where the continuum-normalized spectra are compared. Of particular interest are the clear detections in both sources of the high-excitation OH 84 m and 65 m lines, with lower level energies of 120 and 290 K, respectively (see §3). The and H2O 66-67 m lines, both with lower levels at 195 K, are also detected in Mkn 231, as well as the tentatively identified line at 101 m. It is likely that the increased noise level at m is responsible for the non-detection of the high-excitation OH line in Mkn 231, which is seen in strong emission in Arp 220. While the high-excitation OH and H2O lines at 65-67 m are of similar strength in Mkn 231 and Arp 220, the H2O lines at longer wavelengths are undoubtly weaker in Mkn 231, as seen for the , and H2O lines at 90, 102, and 108 m, respectively. The weakness of the latter lines in Mkn 231 suggests that the region where the high-lying H2O lines are formed is relatively weak in the far-IR continuum at m. The Mkn 231 spectrum thus suggests that a warm component, with relatively weak contribution to the far-IR continuum at m, is responsible for the observed high-excitation absorptions (§3.3). Table 1 lists the line fluxes, continuum flux densities at the corresponding wavelengths, and equivalent widths for the lines detected in Mkn 231.
In the case of Arp 220, we used high-spatial resolution continuum measurements available in the literature to infer that Arp 220 is optically thick even in the submillimeter continuum (Paper I; see also Downes & Eckart, 2007). The steeper decrease of the flux density with increasing wavelength in Mkn 231, however, suggests that it has lower FIR continuum opacities (Fig. 1). This expectation is further reinforced by the detection in Mkn 231 of the [N II] 122 m line, a feature not seen in Arp 220 (Fig. 2). Other notable differences between both sources are that the [O I] 63 m line is observed in emission in Mkn 231 but in absorption in Arp 220, and that the ground-state 119, 53, and 79 m OH lines are significantly weaker in Mkn 231 (Fig. 2). In modeling Arp 220, we were forced to invoke an absorbing “halo” to account for these lines; in Mkn 231, no such halo is required (§3).
In the spectrum of Mkn 231, the main 119.3 m OH line appears to be slightly blue-shifted relative to the expected position, an effect we attribute to the proximity of the line to the edge of the LW3 detector. There is a nearby weaker red-shifted feature, at 120 m, which coincides with the expected position of the ground 18OH line, and appears as a marginal feature in both the “up” and “down” grating scans. However, the limited signal-to-noise ratio ( W cm-2), the narrow appearance of the feature ( m), and the fact that it is not blue-shifted as the main line, make that assignment only tentative. In Arp 220, the main OH line is not shifted because it does not fall so close to the edge of the detector, as a consequence of the lower red-shift of the source. In Arp 220, a red-shifted shoulder appears at 120 m, suggesting the possibility that 18OH may be responsible for it (Paper I). We cannot however be certain that 18OH is detected in any of these sources, but given the high 16OH column densities we derive in some of our models below (§3.3) and the fact that values of the 16OH/18OH ratios below the canonical value of 500 may be expected in regions where the ISM is highly processed by starbursts (Paper I), our tentative identification should be followed up with future Herschel Space Observatory observations with higher spectral resolution and sensitivity. Finally, the spectrum of Mkn 231 shows a broad feature at the position of the OH line (53 m). We note that the blue-shifted side of this absorption is coincident with the OH line, with a lower level energy of 511 K; however, the proximity of this spectral feature to the edge of the SW2 detector precludes any definitive assignment.
The FIR detections of both NH and NH3 in Arp 220 were reported in Paper I. NH3 was also detected via the 25 GHz inversion transitions by Takano et al. (2005), who derived a NH3 column density six times higher than our value. The difference likely arises because of the high FIR continuum opacities in Arp 220, which cause the observed FIR absorptions to trace only a fraction of the total gas column. Since there are no such extinction effects at 25 GHz, the NH3 inversion transitions are expected to trace higher NH3 column densities. Figure 2 shows that, by contrast, the NH3 lines are not detected in Mkn 231, although the relatively high noise at 125 m does not rule out future detection of NH3 with Herschel at a level similar to that of Arp 220.
There are two marginally-detected ( level) spectral features seen at 153.0 and 152.3 m, in the Mkn 231 spectrum (Fig. 3). Although close to the expected position of the main NH feature at 153.22 m, the 153.0 m feature appears significantly shifted by 0.25 m from it, and better coincides with the position of the OH+ line. Also, the 152.3 m feature lies at 0.1 m from the expected position of the OH+ line. In Paper I, we also suggested that OH+ could contribute to the spectrum of Arp 220 for two reasons: our models were unable to reproduce, using NH and NH3, the observed strong absorption at 102 m, which coincides with the expected position of the OH+ line; there was an absorption feature at 76.4 m that, if real, could be attributed to the OH+ transition. Since OH+ has never been detected in the galactic interstellar medium or that of any galaxy, here we only highlight the intriguing possibility of its detection in two ULIRGs. Sensitive, higher-resolution Herschel observations are needed to resolve this tantalizing speculation.
The luminosity of the [C II] fine-structure line at 158 m is 2.5 times stronger in Mkn 231 than in Arp 220, but given the higher FIR luminosity of this source (Fig 1), the [C II] to FIR luminosity ratios are rather similar, with values of and for Mkn 231 and Arp 220, respectively (Luhman et al., 2003). These are among the lowest values found in galaxies, illustrating the so-called “[C II] deficit” found in ULIRGs. The [C II] line emission from Mkn 231 is analyzed in §3.4.
3. Analysis
3.1. Models for the far-infrared continuum
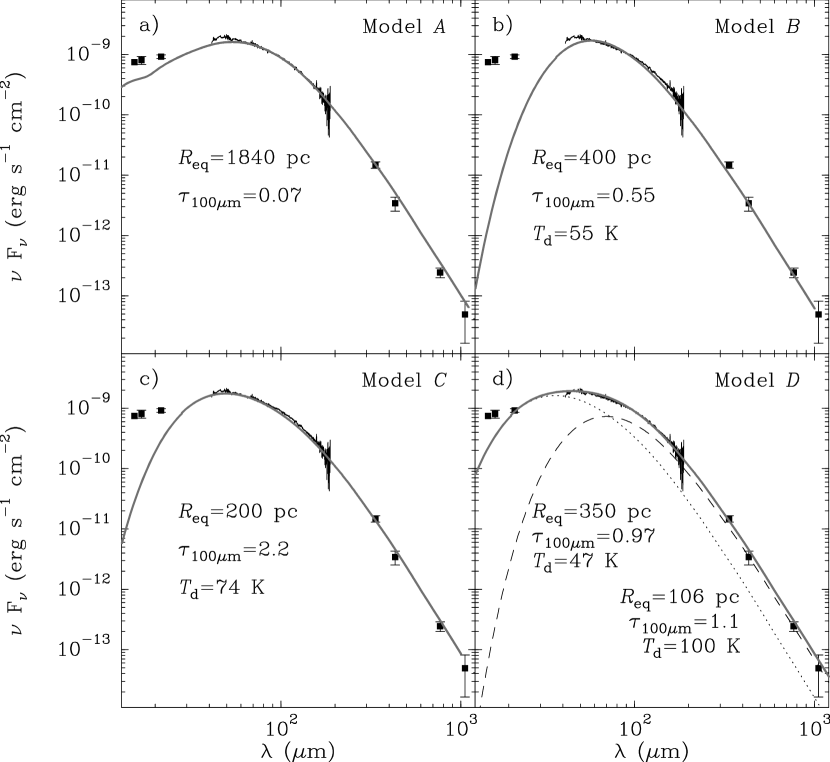
Figure 4 illustrates several ways that the FIR to millimeter continuum can be fit and interpreted. We first modeled (model in Fig. 4a) the far infrared source in Mkn 231 as an ensemble of identical dust clouds each of which is heated by its own single central luminosity source. The representative cloud is assumed to be spherical, with radius , and is divided into concentric shells whose dust temperatures are computed from the balance of heating and cooling (González-Alfonso & Cernicharo, 1999). We used a mixture of silicate and amorphous carbon grains with optical constants from Preibisch et al. (1993) and Draine (1983). The stellar continuum was taken from Leitherer et al. (1999), but results depend only weakly on this choice because the intrinsic continuum is absorbed by the dust and re-emitted at infrared wavelengths. Once the equilibrium temperatures are obtained for each shell, the resulting continuum emission from the cloud is computed, and multiplied by , the number of clouds in the source required to match the absolute flux densities. This scaled spectrum is shown in Fig. 4a. The other three models (, , and , shown in Fig. 4b-d) use grey-bodies with uniform dust temperatures to characterize the continuum emission (e.g., Roche & Chandler, 1993; Armus et al., 2007).
Assuming that the individual clouds do not overlap along the line of sight, our results do not depend particularly on the radius or luminosity adopted for the model individual cloud because identical results are obtained if is multiplied by a factor of , the luminosity by , by , and the continuum opacity is kept constant (see Paper I). The models are thus characterized by the luminosity of the whole ensemble, the radial opacity of the clouds at a given wavelength (which we adopt to be 100 m: ), and the equivalent radius of the source, defined as . These parameters are listed in Table 2.
In model A, the individual clouds are optically thin so that some degree of cloud overlap would yield a similar fit to the continuum while decreasing the value of . For instance, if the clouds are distributed in a spherical volume, giving pc for clouds with pc. However, the predicted opacity through the modeled region, , will be much higher than that of an individual cloud, and this physical situation is already described in models - where higher opacities along the line of sight and a more compact region of FIR emission are assumed. In order to avoid this model redundancy, we choose our continuum models such that an individual “cloud” describes the characteristic continuum opacity ( in Table 2) and dust temperature through the whole region (disk), so that the resulting extent of the FIR emission is .
The observed continuum can be reproduced from model ’s cloud ensemble that is optically thin in the FIR. Model also predicts that the starburst dominates the continuum for m, while the torus/disk around the AGN would then dominate the mid-infrared continuum, in qualitative agreement with the models by Farrah et al. (2003). The equivalent radius of the starburst is slightly larger than the radius of the outer disk observed by DS98. Because is low and is high, this model predicts that the FIR radiation density is low, a prediction that is not consistent with our models of the observed OH line strengths (§3.2).
As both and are increased in models and , the radiation density increases and, therefore, the equivalent size required to reproduce the observed emission becomes smaller. As a consequence, models and predict increasing compactness of the dust clouds responsible for the FIR emission, with and 200 pc respectively. With a single-component model, however, cannot be reduced more than in model without degrading the quality of the fit. However, a two-component model as shown in is able to reproduce the FIR emission, invoking a quite compact ( pc) and warm (100 K) component (), and a colder and more extended one that dominates at m ().
A convenient way to characterize the radiation density in the modeled regions is to compute the radiation temperature at 100 m from
| (1) |
where is the solid angle subtended by the modeled source, is the predicted flux density at 100 m, and other symbols have their usual meaning. is also listed in Table 2, together with the gas mass, luminosity, and fraction of the bolometric luminosity for each model. The calculated gas masses assume a gas-to-dust mass ratio of 100. In all cases, they are lower than the dynamical masses determined by DS98 when is identified with the radial extent of the source (and therefore compatible with the inferred rotation velocities in the disk). Our inferred masses are in models consistent with the mass inferred by PIW07, but are in all cases higher, by at least a factor of two, than the gas masses obtained by DS98. This discrepancy may be explained in at least four possible, different ways: the physical radial extent of the cloud ensemble, which accounts for cloud filling, is given by , where is the area filling factor, so that is a lower limit of ; our calculated masses depend on the mass-absorption coefficient for dust, which we have assumed to be cm2 g-1 based on a mixture of silicate and amorphous carbon grains (Preibisch et al., 1993; Draine, 1983), but could be up to a factor higher if the dust is mainly composed of fluffy aggregates (Kruegel & Siebenmorgen, 1994); the gas-to-dust mass ratio may depart significantly from the standard value of 100; the masses derived by DS98 for Mkn 231 could be lower limits in the light of the submillimeter CO emission reported by PIW07. A combination of these factors may explain our higher values.
The luminosities in Table 2 account for 50-80 % of the observed m infrared luminosity. Model implicitly assumes that the calculated luminosity has a starburst origin; the luminosity from model and from the cold component of model are also attributable to the starburst in view of the spatial extent of the modeled source. Since model and the warm component of model are more compact, a combination of AGN and starburst contributions is more plausible. The surface brightness in model is L⊙/kpc2, a factor of 2 higher than the peak global value found in starburst galaxies by Meurer et al. (1997), suggesting an important (but uncertain) contribution by the AGN to the observed FIR emission (Soifer et al., 2000). Also, the luminosity-to-mass ratio of 500 L⊙/M⊙ coincides with the uppermost limit proposed by Scoville (2004) for a starburst. The very high surface brightness ( L⊙/kpc2) and luminosity-to-mass ratio ( L⊙/M⊙) of the warm component of model (), as well as its compactness, persuasively indicate that this component is most probably dominated by the AGN. The most plausible relative contributions by the AGN and the starburst to are discussed in §4.
In summary, different approaches can be used to successfully fit the observed FIR continuum emission, with the properties of the clouds that emit that radiation in these approaches spanning a wide range of possible physical scenarios. But ISO/LWS has provided us with spectroscopic information, and we show next how the observed high excitation OH and H2O lines impose important constraints on these continuum models.
3.2. Equivalent widths
We analyze the OH equivalent widths assuming that the OH molecules form a screen in front of the IR source. The strengths of the and OH doublets at 84 and 65 m, enable us to conclude that the excited OH covers a substantial fraction of the FIR emission region. Assuming that each line of the 84 m doublet absorbs all the background 84 m continuum over a velocity range of 250 km s-1 along each line of sight, and that there is no significant re-emission in the line, the covering factor is %. This value may be considered a lower limit for the following reasons. The submillimeter CO line profiles shown by Papadopoulos et al. (2007) have FWHMs of 200-250 km s-1, and the lines are expected to be broadened by velocity gradients and, in particular, by the disk rotation; therefore, the velocity range of 250 km s-1 assumed above is probably an upper limit. DS98 inferred local turbulent velocities of up to 60 km s-1 at inner radii (100 pc) and decreasing as . If we adopt an intrinsic Gaussian line profile with the highest value of the turbulent velocity, km s-1, and saturate the 84 m line to the degree that an effective width222The effective width is defined here as , where and is the line opacity at line center. of 250 km s-1 is obtained for each component of the doublet, the derived 84 m foreground opacity at line center is , but the high column density required for this opacity is hard to reconcile with that inferred from the other observed OH line strengths (§3.3). Finally, some significant re-emission in the 84 m OH line is expected because the OH line at 65 m that originates from its upper level is detected in absorption. We therefore conclude that the observed 84 m OH absorption is widespread, and probably covers the bulk of the 84 m continuum emission regions. On the other hand, the opacities in the high-lying 65 m line should only be moderate; for reference, if we adopt for each component an upper limit of 150 km s-1 on the effective velocity interval for the absorption at each sight line, the minimum covering factor for this line is then 25%. It is therefore possible that the OH responsible for the 65 m absorption does not entirely coincide with that producing the 84 m absorption but is only a fraction of the latter, consistent with its lower energy level being at nearly 300 K. Nevertheless, for the sake of simplicity, we assume in this Section that both lines arise in the same region –one that, on the basis of the 84 m OH strength, covers the total FIR continuum. The derived OH column densities will be lower limits, and the inferred properties of the continuum source will be associated with at least % of the observed FIR emission.
The equivalent widths are then given by
| (2) |
where is the blackbody emission at the excitation temperature of the line, is the solid angle subtended by the source, is the observed continuum flux density at the wavelength of the line, is the line opacity at velocity , and the factor 2 accounts for the two lines that compose a doublet. The values of are positive for absorption lines, and negative for lines observed in emission. Equation (2) applies both to optically thin and optically thick lines. For optically thin lines, is proportional to the assumed column density; for very optically thick lines, becomes insensitive to the column density and scales linearly with the turbulent velocity. Based on DS98, we have adopted km s-1, which is probably accurate within 50%.
The fractional level populations and column densities (and hence the opacities), and blackbody temperatures required to obtain from eq. (2) can be estimated from a given column density (OH), and by assuming that the excitation temperature is the same for all OH transitions. This assumption is certainly only an approximation. The OH levels are pumped primarily through absorption of FIR photons; this is quite a general model result when both the ground and the excited OH rotational lines (except the 163 m one) are observed in absorption (see the similar conclusion in Paper I for the case of Arp 220, as well as the case of the H2O lines at 25-45 m in Orion/IRc2, Wright et al., 2000). When radiative excitation dominates, the level populations tend toward equilibrium with the radiation field within the inner cloud, and the excitation temperatures are similar for all transitions in those regions. However, the observed absorptions are produced close to the cloud boundary where the OH molecules are illuminated from only one side and is less than the radiation temperature. Due to trapping effects, the lines with the highest opacity (119 and 84 m OH lines) remain more excited than the other lines at inner locations of the region, but their decrease more steeply outwards and fall below the of other, thinner lines close to the cloud boundary. The detailed, non-local radiative transfer models described in §3.3 show that the assumption of equal is only approximately valid for the 119 and 84 m lines, but for the other lines, and in particular for the 65 and 53 m lines, may be higher or lower depending on position in the region. Nevertheless, the opacities of the 119, 84, 65, and 53 m lines are mostly determined by the of the 119 and 84 m lines. As a result, the following analysis of the radiation density (or, equivalently, , required to account for the observed absorptions) is accurate, at least to a first approximation.
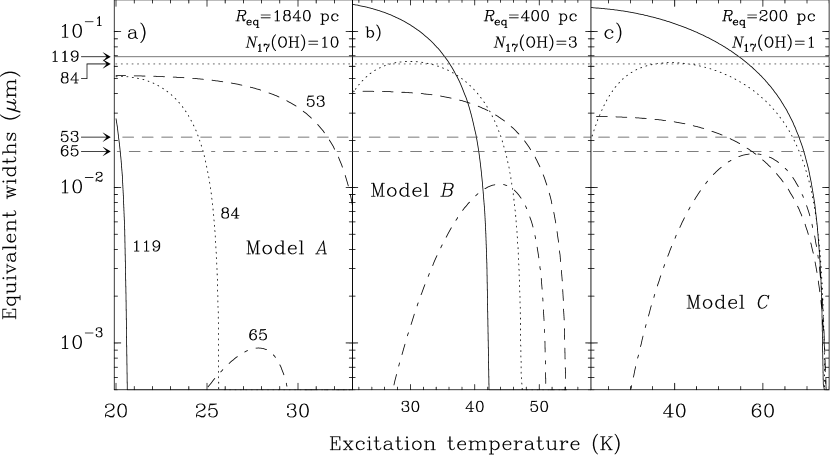
The three parameters now required to estimate from equation (2) are then (OH), , and . Figure 5 shows the expected values of for models , , and as a function of for the 119, 84, 65, and 53 m lines, and compares them with the observed values. Each panel assumes a value of that corresponds to the continuum models , , and described in §3.1 (see also Table 2). The values of (OH) used for each model are just reference values discussed below.
The spectral line analysis of Model (Fig. 5a) shows that this scenario can be ruled out as the main source of FIR radiation from Mkn 231 (Fig. 4a): the continuum model predicts low (between 20 and 34 K for the different lines) but the observed absorption in the 65 m line, with lower level energy of 290 K, requires a much higher . Furthermore, the 119 and 84 m lines are expected to be in emission () as soon as becomes higher than 20 and 25 K (which, on the other hand, is not possible for radiative excitation). With such a low value of , is negligible even with our adopted screen cm-2, a value that overestimates by more than a factor of two.
The above problems still remain to some extent in model , when is reduced to 400 pc (Fig. 5b). Here the dust radiation temperatures allow the lines to be seen in absorption up to K, however is underestimated by more than a factor of 2 for the adopted cm-2, yet this column density still overestimates the absorption of the 53 m line. Although model cannot account for the 65 m line strength, a region of similar size but lower could contribute to the observed absorptions of the 119, 84 and 53 m lines.
The single-component model that best accounts for the four observed OH lines is model with pc (Fig. 5c). The corresponding continuum model (Fig. 4c), with K, also fits rather well the overall FIR continuum emission. Significantly, our models in §3.3 show that the excitation temperatures required to reproduce the observed equivalent widths, 40-60 K, are those computed at the cloud surface if the OH is excited by the infrared emission from a blackbody at K. Finally, the dust temperature and gas mass (Table 2) in model are consistent with the gas temperature and H2 mass derived by Papadopoulos et al. (2007) from the submillimeter CO and HCN emission. They found that this warm gas component hosts most of the molecular mass in the galaxy. The H2 column density, cm-2, indicates high optical depths, as in the galactic Sgr B2 molecular cloud, but Mkn 231 is much warmer. If the column density in Mkn 231 is concentrated in a face-on disk of thickness pc, as concluded by DS98, the expected density is cm-3, just the amount needed to account for the CO submillimeter lines (Papadopoulos et al., 2007). On the other hand, if this warm and dense component is identified with the inner disk of radius 460 pc reported by DS98, the area filling factor is . In spite of the general agreement between our model with other observations, a closer inspection of this model (§3.3) reveals some discrepancies with other OH and H2O lines that suggest that a slightly modified scenario can better explain the overall observed absorption patterns.
3.3. Models for OH and H2O
Radiative transfer modeling of the observed OH and H2O lines was done using the code described in González-Alfonso & Cernicharo (1997, 1999), which computes the statistical equilibrium populations of a given molecule in spherical symmetry. Line broadening is assumed to be caused by microturbulence. Our code accounts for a non-local treatment of the radiative trapping in the molecular lines and of the excitation through absorption of photons emitted by dust, as well as for collisional excitation. Both line and continuum opacities for photons emitted in both lines and continuum are taken into account. Collisional rates were taken from Offer, van Hemert, & van Dishoeck (Offer et al.1994) and Green, Maluendes, & McLean (Green et al.1993) for OH and H2O, respectively. As we also found for Arp 220 (Paper I), the overall excitation is dominated by absorption of FIR continuum photons in all models. If shock conditions (high density and temperature) were assumed, only the absorption in the lowest-lying lines would be significantly affected. Once the continuum model is fixed, our results only depend on the molecular column densities and turbulent velocity (see Paper I for a fuller description).
As mentioned above (§3.2), the observed absorption strengths are not sensitive to the amounts of OH and H2O in the inner regions of the modeled regions, but only to the amounts of OH and H2O that are close to the cloud (or disk) boundary. For this reason, we calculate two values for the derived molecular column densities: denotes the column density for a shell of species covering the infrared source (i.e., the screen case), whereas is the inferred column density for models where and dust are evenly mixed (the mixed case). Evidently will be much higher than , but from our data there are only a few, non-definitive ways to discriminate between the alternatives. The 163 m OH and 120 m 18OH lines are stronger in the mixed case, but neither of these features is unambiguously detected. Nevertheless, we do not find any strong arguments for thinking that OH and H2O are only present on the surface of the disk, and so the values may be considered somewhat more reliable. The abundances we derive below are based on this assumption; we revisit the “mixed”case when we discuss models for the [C II] line.
Since model (Fig. 4c, Fig. 5c, Table 2) gives the best single-component fit to most of the OH equivalent widths, we first check if it can account for the observed OH and H2O absorption features. Figure 6 compares the observed continuum-subtracted spectrum and the modeled results (dashed spectrum, mixed case) for the wavelength ranges where the signal-to-noise ratio is adequate. Table 3 lists the physical parameters obtained for this model. We have assumed a turbulent velocity of 40 km s-1 (§3.2; DS98). The model fits satisfactorily the OH 119, 84, 65, and 53 m lines, thus demonstrating the approximate validity of the simple method outlined in §3.2. The value of cm-2 is also the same as estimated from the equivalent widths. The H2O column densities are determined by the strengths of the and lines at 66-67 m.
Some features of model , however, are inconsistent with the data. The possible emission in the OH 163 m line is not reproduced, and the absorption in the 79 and 99 m OH lines appears excessive. The model also predicts too much absorption in the (90 m), (101 m), (108 m), and (113 m) H2O lines. All these discrepancies suggest that the component that accounts for the absorption of the 65-68 m OH and H2O lines is weaker than postulated in model at wavelengths longer than 80 m.
These discrepancies may be resolved by invoking two different components for the FIR continuum emission, as in model (Fig. 4, Table 2). The warm-compact component, responsible for the 65-68 m OH and H2O lines, will produce weak absorptions in the 80-120 m range as a consequence of the relatively weak continuum emission at these wavelengths. The more extended component will contribute to the observed absorptions in the 53, 84, and 119 m OH lines. The compactness of the warm component suggests that it is relatively close to the AGN, and thus we have assumed km s-1 for (Table 3); this is the turbulent velocity found by DS98 around the rotation curve turnover radius of 75 pc. For the extended component (), km s-1 is assumed. Figure 6 shows that a better fit to the overall spectrum is indeed found with this composite model (grey line), with the lines in the 80-120 m range brought down to levels compatible with observations. Also, the model predicts the 163 m OH line to be in emission. The column densities in model are significantly lower than in and, to avoid the above mentioned H2O absorptions at 90-120 m, only an upper limit for the H2O column density has been derived for the extended component. On the basis of this improved fit to the molecular lines, we favor model over model .
3.4. Models for [C II] and [O I]
We now check if our preferred models for OH and H2O are consistent with the observed [C II] 158 m and [O I] 63 m lines, and in particular if the version with OH and dust coexistent (the mixed case), which predicts high OH column densities (Table 3), is compatible with the low [C II] to FIR flux ratio seen and previously reported in Mkn 231 (Luhman et al., 2003). In Paper I we assumed a C+ to OH abundance ratio of 100 (based on standard gas-phase carbon abundance, and the abundance of OH found in the galactic center and Sgr B2), and found a remarkable agreement between the predicted and observed [C II] line flux in Arp 220. In the present case we have searched for the required C+ and O0 column densities in models and (mixed case) that fit the observed [C II] and [O I] line fluxes, with the additional constraint that the [O I] 145 m line is not detected to a limit of W cm-2 (see also Luhman et al., 2003). In model , the C+ abundance was assumed to be the same in both components. Both the [C II] and [O I] lines are expected to form within mag of the surfaces of PDRs, and so we allowed the gas temperature to vary between 250 K and 700 K (e.g., Kaufman et al., 1999); the results for the [C II] line are not sensitive to as long as is sufficiently higher than the energy of the upper level, K. In the regions directly exposed to the FUV radiation field, all of the carbon and oxygen are expected to be in their ionized and atomic forms, respectively. Therefore an O0 to C+ abundance ratio of 2.1, corresponding to O0 and C+ gas-phase abundances of and (Sembach & Savage, 1996), is imposed. Using the collisional rates by Launay & Roueff (1977a, b) for carbon and oxygen, we then searched for the density and column densities and required to match the line strengths. The results for both models and are also in Fig. 6, and the calculated column densities are listed in Table 3.
We could not find any satisfactory fit to the three atomic lines with model . Since the continuum is optically thick at m, extinction effects are important in the [O I] 63 m line, and densities higher than cm-3 were required to account for it. On the other hand, high column densities were also needed to fit the [C II] line, and the final result is that all combinations that fitted both the [C II] and the [O I] 63 m lines yielded more flux than the upper limit for the undetected [O I] 145 m line. The model in Fig. 6 shows the result for cm-3 and K. Only high densities ( cm-3) and relatively low temperatures ( K) can approximately match both O0 lines, but then the [C II] line is underestimated by more than a factor of 2.
In contrast, model allowed us to find a more satisfactory fit to the three lines. As we argue below, the compact-warm component is expected to give negligible emission in the C+ and O0 lines. The extended component , with its moderate dust temperature ( K) and continuum opacity, can explain the [O I] 63 m line with a density and column density lower than in model , thereby predicting a weak 145 m line. The model in Fig. 6 uses for cm-3 and K. It is remarkable that when we generated the same model but excluded the effect of dust, we found that the [O I] 63 m line was stronger by a factor of 4.2. The dust has a small effect on the other two [O I] 145 m and [C II] 158 m lines, but can lower substantially the [O I] 63 m line because the absorption of 63 m line-emitted photons by dust grains (i.e., extinction) is more important than the additional pumping of O0 atoms by 63 m dust-emitted photons. Therefore, the ratio of the [C II] 158 m line to the [O I] 63 m line, observed of order unity, is reproduced with higher densities and temperatures than in previous studies: Fig. 4 of Kaufman et al. (1999) shows that for cm-3 and , corresponding to a temperature somewhat higher than 100 K (Fig. 1 of Kaufman et al., 1999). Including dust leads to a similar intensity ratio for K, or . On the other hand, our model for yields , which implies for the above density (see Fig. 6 of Luhman et al., 2003). These results suggest that the effect of extinction cannot be neglected when modeling the [O I] 63 m line in sources that are optically thick at wavelengths shorter than 100 m. Self-absorption by foreground low-excitation clouds may also lower the flux of the [O I] 63 m line and and to a lesser extent that of the [C II] line (Fischer et al., 1999; Vastel et al., 2002; Luhman et al., 2003, Paper I).
To compare our results for line intensity ratios involving the [O I] 63 m line, with the corresponding plots shown by Luhman et al. (2003), one should use the versions of our models that ignore dust, because the intensities given in the models by Kaufman et al. (1999) are uncorrected for extinction. In our models that ignore dust, and . Here, the FIR flux corresponds to that of component (Table 2). Using these values in Fig. 4 of Luhman et al. (2003), one obtains cm-3 and , roughly consistent with our input model parameters.
The C+ and O0 column densities required to fit the lines in model are rather high. The averaged C+ and O0 abundances are and relative to H nuclei, respectively. If the C+ to OH abundance ratio is 100 (Paper I), the mixed column density of OH is overestimated by a factor of 3. In any case, the values indicate that an important fraction of C nuclei is in ionized form, % in model for a gas phase carbon abundance of (Sembach & Savage, 1996). The corresponding mass of atomic gas is M⊙, at least one order of magnitude higher than the amount estimated in M82 and NGC 278 (Wolfire et al., 1990; Kaufman et al., 1999). As mentioned above, C+ is expected to be abundant only in regions within mag from the surfaces of PDRs, and the relatively high fraction of C+ derived above indicates that those regions must be widespread in the Mkn 231 disk. On the other hand, one possible interpretation of the high H2 column densities required to generate the radiation field needed to account for the OH lines, is that we are viewing a number of PDRs that overlap along the line of sight (see also §4).
We now check the possibility that a significant fraction of the [C II] 158 m emission arises from a more extended region, like the outer disk found by DS98 in CO. For an outer disk mass of M⊙ and density of cm-3 (DS98), and using an upper limit for the C+ abundance of and collisional rates at 250 K (from Launay & Roueff, 1977a), we calculate that of the observed [C II] line arises from this extended region. Therefore we do not expect much contribution from it, unless the C+ is concentrated in clumps of much higher density.
Our model results can be used to re-examine the issue of the [C II] line deficit found in ULIRGs. Contrary to what might be expected from the low [C II] to FIR luminosity ratio in Mkn 231, relatively high average abundances of C+ are required in to reproduce the [C II] line. Explanations based on self-absorption effects, extinction by dust, effects of dust-bounded HII regions, high , and high-formation rate of CO at the expense of C+ have been invoked to account for the [C II] deficit (Luhman et al., 1998, 2003; Malhotra et al., 2001; Papadopoulos et al., 2007, Paper I, and references therein). In our models for Mkn 231, the high abundance of C+ yields the observed low [C II] to FIR luminosity ratio because of the high luminosity-to-gas-mass ratio () of our continuum models. In both models and , an overall L⊙/M⊙ is derived (Table 2), where the gas mass includes both the atomic and molecular components. We argue that, if this extreme ratio applies to the whole region from which the FIR emission arises, as appears to be the case for Mkn 231, the [C II] line strength relative to the infrared emission can never attain values in excess of 0.1%. The [C II] luminosity emitted per unit of total gas mass is given by
| (3) |
where and are the degeneracies of the lower and upper level, is the upper level energy, is the Einstein coefficient for spontaneous emission, and denotes the number of C+ ions per unit of total gas mass (including all components). It is assumed in eq. (3) that the line is optically thin. In the limit one obtains
| (4) |
where denotes the average C+ abundance relative to total H nuclei. Therefore, the expected [C II]-to-IR emission is
| (5) |
for L⊙/M⊙333For simplicity, the luminosity accounts here for the total infrared emission as derived in our models, whereas in previous studies the FIR emission was defined between 40 and 120 m; the correction factor is less than 2 (see Sanders & Mirabel, 1996).. Hence, even assuming the highest nearly possible , the [C II]-to-IR ratio is not expected to be above for such high values of . The reason is simply the limited reservoir of gas, and hence of C+ ions, per unit of output power. High values are in Mkn 231 primarily due to the contribution of the AGN, but could also be associated with high star formation efficiencies (maybe extreme, see Scoville, 2004): if we attribute the total infrared luminosity to FUV heated grains in PDRs and use the units of (i.e. the Habing Field of ergs cm-2 s-1) to calculate the for a PDR column density of mag with the standard gas-to-extinction conversion cm-2 mag-1 (e.g., Dickman, 1978), we find that the value of that corresponds to L⊙/M⊙ is , which we express for the general case as
| (6) |
so that high values would indicate high values. For PDRs with and mag, the average C+ abundance is (i.e., carbon is ionized within mag of the surfaces of PDRs) and will attain the lowest values observed in ULIRGs.
In our favored model , the component ( L⊙/M⊙), which emits most of the IR luminosity, could only account for the [C II] line if essentially all gas-phase carbon were in ionized form. However, this seems implausible, as the C+ abundance in XDRs is (Meijerink & Spaans, 2005), and FUV photons from stars are absorbed in thin shells of dust on the surfaces of PDRs. With the assumed column densities in Table 3, the calculated contribution from to the observed [C II] emission is only 8%, the [O I] 145 m flux is 15% of the upper limit, and the [O I] 63 m is predicted in weak absorption against the continuum. (In this calculation, K and cm-3 are assumed, so that the atomic region is in pressure equilibrium with the cooler molecular gas with K and cm-3.) It is therefore expected that the strongest source of infrared radiation (the warm component) gives low [C II] and [O I] line emission even if one assumes relatively high averaged fractional abundances for C+ and O0. As in Luhman et al. (2003), we then invoke a component that emits strongly in the FIR but yields weak emission in the [C II] and [O I] lines. In contrast to Luhman et al. (2003), however, we leave open the possibility that has a relatively high C+ abundance, as expected from both XDR and PDR chemistry. In starburst and normal galaxies, the moderate star formation efficiencies (e.g., L⊙/M⊙ in NGC 1068; Planesas, Scoville, & Myers, 1991), implying lower values of , will not place such a strong limit on the C+ cooling rate relative to the infrared emission. We suggest, then, that the [C II] 158 m line deficit found in ULIRGs may be associated with a high ratio that, allowing a relatively high C+ abundance, indicates an important contribution to the FIR emission by an AGN, and/or a high star-formation efficiency.
4. Discussion and conclusions
Simultaneous modeling of the FIR continuum and line absorptions is the only consistent way to derive from FIR observations the physical and chemical properties of bright-infrared galaxies, where due to high radiation densities, the OH and H2O lines are pumped through absorption of continuum photons. In Mkn 231, the high-lying 65-68 m OH and H2O lines indicate the presence of a compact ( pc) and warm ( K) region, presumably located around the AGN, with high continuum opacity (). The size of this region is comparable to (though somewhat larger than) the inner nuclear disk where the OH mega-masers have been observed from VLBI observations (Klöckner et al., 2003), and is similar to the spatial extent of the regions where the bulk of the OH mega-maser emission is generated (regions C, NE, and SW in Fig. 5 of Richards et al., 2005). This strongly suggests that we are observing the FIR counterpart of the 18 cm OH emission (e.g., Skinner et al., 1997). Richards et al. (2005) estimate cm-2 in 1 pc clouds where km s-1; therefore, cm-2/(km s-1). In both the warm and cold components of model , we have obtained cm-2/(km s-1), in rough agreement with the estimates by Richards et al. (2005). The “screen” case is most appropriate for comparison here because the OH megamasers amplify the background radio continuum emission.
The nuclear region is surrounded by a more extended ( pc) and colder ( K) region, which produces the bulk of the [C II] and [O I] line emissions and contributes to the low-lying OH lines. Allowing for an area filling factor of 0.6-0.7, the total extent of the FIR emission is then comparable to the size of the CO (inner) disk (Bryant & Scoville, 1996, DS98). The inferred densities ( cm-3) may explain the submillimeter CO emission detected by Papadopoulos et al. (2007), and somewhat lower densities ( cm-3) can account for the [O I] line emission. We do not however rule out the possibility that some of the FIR emission arises from a more extended region, as the outermost disk observed by DS98 in the millimeter CO lines or the much more extended region observed in soft X-rays (Gallagher et al., 2002).
The FIR emission from is probably dominated by the AGN, as pointed out in §3.1. Davies et al. (2004) estimated that, within a radius of 330 pc, the starburst luminosity accounts for L⊙; since the luminosity for the component is L⊙, the starburst luminosity contribution from is most probably L⊙. Davies et al. (2004) also estimated that, within 100 pc of the AGN (the size of ), the starburst contribution is L⊙, in agreement with the afore mentioned upper limit. On the other hand, the extended ( pc2) radio continuum 1.4 GHz emission detected by Carilli et al. (1998) is compatible with both the whole FIR emission arising from the starburst (yielding an IR-to-radio flux density ratio of , Carilli et al., 1998), and only the FIR emission arising the starburst (yielding ). If one now assumes that the starburst contribution to the FIR emission of is L⊙, the resulting is 2.3 (in agreement with the median value of in normal galaxies; Condon, 1992, and references therein). Also, the surface brightness and luminosity-to-mass ratio of due to only the starburst component would then be L⊙ kpc-2 and 550 L⊙/M⊙, which are probably upper limits for a starburst. In summary, our preferred model favors that of the bolometric luminosity from Mkn 231 is due to the AGN.
Although the chemistry of the extended starburst component, where the lower-lying OH lines and the bulk of the [C II] 158 m and [O I] 63 m lines are generated, appears to be dominated by PDRs, the dominant chemistry of the warm component may be of a different nature. Since the compactness of suggests that its FIR emission is dominated by the AGN, and given the high X-ray intrinsic luminosity of the AGN ( erg s-1) in the 2-10 keV band (Braito et al., 2004), we consider the possibility that the derived OH and H2O column densities can be better explained in terms of XDR chemistry. Calculations by Meijerink & Spaans (2005) show that, in dense XDRs with cm-2, the OH and H2O column densities are expected to attain values of cm-2, similar to the values that we have derived in the mixed case. Furthermore, the Compton-thick screen with cm-2 required to block the primary X-ray emission (Braito et al., 2004) could be partially identified with , with similar column density. Therefore an XDR may naturally explain the observations of high-lying OH and H2O lines in Mkn 231. Nevertheless, both OH and H2O are also tracers of starburst chemistry, and a number of PDRs and hot cores overlapping along the line of sight could in principle yield the column densities required to explain our observations at least in the screen case, and could then mimic an XDR. We conclude that further observations are still required to discern between XDR and starburst chemistry.
We suggest that the [C II] 158 m line deficit in Mkn 231, and also probably in Arp 220 (see Paper I), is primarily due to a component that dominates the FIR emission but emits weakly in the [C II] line, as previously suggested by Luhman et al. (2003). However, we also suggest that this component may still be rich in C+, but with an extreme luminosity-to-gas-mass ratio that limits the [C II] luminosity per unit of luminous power in the continuum. Our derived luminosity to H2 mass ratio of 500 L⊙/M⊙ is high; future studies will indicate whether it can be applied to other ULIRGs with similar [C II] deficits.
Given the high C+ column densities (a few cm-2) required to account for the [C II] 158 m line emission, the H2 columns derived toward the extended component are unlikely to be associated with non-overlapping star-forming regions surrounded by optically thick envelopes. A single PDR is not expected to have in excess of cm-2. A scenario with a crowded population of PDRs overlapping along the line of sight is therefore more plausible. If a typical single OB stellar cluster emits up to erg s-1, the maximum value found by Scoville et al. (2001) in M51 and also the luminosity of W49, then the number of single clusters to produce the Mkn 231 starburst luminosity of L⊙ is . If these clusters are concentrated in a disk of radius 460 pc and thickness 25 pc (DS98), the mean distance between neighboor clusters is only pc (see also Keto et al., 1992). Merging of PDRs may be compatible with some area filling factor if, for example, some spiral structure is invoked within the disk.
In NGC 1068, Spinoglio et al. (2005) observed the OH 119 m line in emission against the continuum. On the basis of a possible XDR chemistry, and given the corresponding mass, density and temperature that characterize the nuclear region, Spinoglio et al. (2005) suggested that the OH 119 m emission line could be formed in that region. This option also relied on the fact that relatively weak FIR emission is expected to arise from the circumnuclear disk of the Seyfert 2 galaxy, so that the OH 119 m line can be excited through collisions and emit above the continuum in these dense and warm environments. The situation is different for Mkn 231 and Arp 220. In these ULIRGs, the extremely high luminosity arising from the nuclear region, together with the high concentrations of gas there, make the nuclear FIR emission component very bright. Any possible emission in the 119 m line will be obscured by the strong absorption, which in these objects is times stronger than the emission feature in NGC 1068. Also, the strong FIR radiation density pumps higher-lying OH and H2O levels, thus producing absorptions in the higher-excitation lines. The OH and H2O molecules are, therefore, potentially powerful tracers of circumnuclear regions around AGNs. Future Herschel observations of Mkn 231 and other sources will allow us to apply the models developed in this paper to these sources, refine them accordingly, and will certainly give new insights into the physical and chemical conditions of bright infrared galaxies.
References
- Aalto et al. (2007) Aalto, S., Spaans, M., Wiedner, M.C., & Hüttemeister, S. 2007, A&A, 464, 193
- Armus et al. (2007) Armus, L., et al. 2007, ApJ, 656, 148
- Baan et al. (1998) Baan, W.A., Salzer, J.J., & Lewinter, R.D. 1998, ApJ, 509, 633
- Boksenberg et al. (1977) Boksenberg, A., Carswell, R.F., Allen, D.A., Fosbury, R.A.E., Penston, M.V., & Sargent, W.L.W. 1977, MNRAS, 178, 451
- Braito et al. (2004) Braito, V., et al. 2004, A&A, 420, 79
- Bryant & Scoville (1996) Bryant, P.M., & Scoville, N.Z. 1996, ApJ, 457, 678
- Carilli et al. (1998) Carilli, C.L., Wrobel, J.M., & Ulvestad, J.S. 1998, AJ, 116, 1007
- Clegg et al. (1996) Clegg, P.E., et al. 1996, A&A, 315, L38
- Condon (1992) Condon, J.J. 1992, Ann. Rev. Astron. Astrop., 30, 575
- Cutri et al. (1984) Cutri, R.M., Rieke, G.H., & Lebofsky, M.J. 1984, ApJ, 287, 566
- Davies et al. ( 2004) Davies, R.I., Tacconi, L.J., & Genzel, R. 2004, ApJ, 613, 781
- Dickman (1978) Dickman, R.L. 1978, ApJS, 37, 407
- Downes & Eckart (2007) Downes, D., & Eckart, A. 2007,A&A, 468, L57
- Downes & Solomon (1998) Downes, D., & Solomon, P.M. 1998, ApJ, 507, 615 (DS98)
- Draine (1983) Draine, B.T. 1985, ApJS, 57, 587
- Farrah et al. (2003) Farrah, D., Afonso, J., Efstathiou, A., Rowan-Robinson, M., Fox, M., & Clements, D. 2003, MNRAS, 343, 585
- Fischer et al. (1999) Fischer, J., et al. 1999, Ap&SS, 266, 91
- Gallagher et al. (2002) Gallagher, S.C., Brandt, W.N., Chartas, G., Garmire, G.P., & Sambruna, R.M. 2002, ApJ, 569, 655
- González-Alfonso & Cernicharo (1997) González-Alfonso, E., & Cernicharo, J. 1997, A&A, 322, 938
- González-Alfonso & Cernicharo (1999) González-Alfonso, E., & Cernicharo, J. 1999, ApJ, 525, 845
- González-Alfonso et al. (2004) González-Alfonso, E., Smith, H.A., Fischer, J., & Cernicharo, J. 2004, ApJ, 613, 247 (Paper I)
- Graciá-Carpio et al. (2006) Graciá-Carpio, J., García-Burillo, S., Planesas, P., & Colina, L. 2006, ApJ, 640, L135
- (23) Green, S., Maluendes, S., & McLean, A. D. 1993, ApJS, 85, 181
- Harvey et al (1999) Harvey, V.I., et al. 1999, in ”The Universe as Seen by ISO”, eds. P. Cox & M. F. Kessler. ESA-SP 427, 889
- Henkel et al. (1987) Henkel, C., Guesten, R., & Baan, W.A. 1987, A&A, 185, 14
- Kessler et al. (1996) Kessler, M.F., et al. 1996, A&A, 315, L27
- Kaufman et al. (1999) Kaufman, M.J., Wolfire, M.G., Hollenbach, D.J., & Luhman, M.L. 1999, ApJ, 527, 795
- Keto et al. (1992) Keto, E., Ball, R., Arens, J., Jernigan, G., & Meixner, M. 1992, ApJ, 387, L17
- Klöckner et al. (2003) Klöckner, H.-R., Baan, W.A., & Garrett, M.A. 2003, Nature, 421, 821
- Kruegel & Siebenmorgen (1994) Kruegel, E., & Siebenmorgen, R. 1994, A&A, 288, 929
- Lahuis et al. (2007) Lahuis, F., et al. 2007, ApJ, 659, 296
- Launay & Roueff (1977a) Launay, J.-M., & Roueff, E. 1977, J. Phys. B, 10, 879
- Launay & Roueff (1977b) Launay, J.-M., & Roueff, E. 1977, A&A, 56, 289
- Leitherer et al. (1999) Leitherer, C., et al. 1999, ApJS, 123, 3
- Luhman et al. (1998) Luhman, M.L., Satyapal, S., Fischer, J., Wolfire, M.G., Cox, P., Lord, S.D., Smith, H.A., Stacey, G.J., & Unger, S.J. 1998, ApJ, 504, L11
- Luhman et al. (2003) Luhman, M.L., Satyapal, S., Fischer, J., Wolfire, M.G., Sturm, E., Dudley, C.C., Lutz, D., & Genzel, R. 2003, ApJ, 594, 758
- Malhotra et al. (2001) Malhotra, S., et al. 2001, ApJ, 561, 766
- Matthews et al. (1987) Matthews, K., Neugebauer, G., McGill, J., & Soifer, B.T. 1987, AJ, 94, 297
- Meijerink & Spaans (2005) Meijerink, R., & Spaans, M. 2005, A&A, 436, 397
- Meurer et al. (1997) Meurer, G.R., Heckman, T.M., Lehnert, M.D., Leitherer, C., & Lowenthal, J. 1997, AJ, 114, 54
- (41) Offer, A.R., van Hemert, M.C., & van Dishoeck, E.F. 1994, J. Chem. Phys., 100, 362
- Papadopoulos et al. (2007) Papadopoulos, P.P., Isaak, K.G., & van der Werf, P.P. 2007, in press (PIW07)
- Planesas et al. (1991) Planesas, P., Scoville, N., Myers, S.T. 1991, ApJ, 369, 364
- Preibisch et al. (1993) Preibisch, Th., Ossenkopf, V., Yorke, H.W., & Henning, Th. 1993, A&A, 279, 577
- Richards et al. (2005) Richards, A.M.S., Knapen, J.H., Yates, J.A., Cohen, R.J., Collett, J.L., Wright, M.M., Gray, M.D., & Field, D. 2005, MNRAS, 364,353
- Rieke (1976) Rieke, G.H. 1976, ApJ, 210, L5
- Rigopoulou et al. (1996) Rigopoulou, D., Lawrence, A., & Rowan-Robinson, M. 1996, MNRAS, 278, 1049
- Roche et al. (1983) Roche, P.F., Aitken, D.K., & Whitmore, B. 1983, MNRAS, 205, 21
- Roche & Chandler (1993) Roche, P.F., & Chandler, C.J. 1993, MNRAS, 265, 486
- Sanders & Mirabel (1996) Sanders, D.B., & Mirabel, I.F. 1996, ARA&A, 34, 749
- Sanders et al. (2003) Sanders, D.B., Mazzarella, J.M., Kim, D.-C., Surace, J.A., & Soifer, B.T. 2003, AJ, 126, 1607
- Sembach & Savage (1996) Sembach, K.R., & Savage, B.D. 1996, ApJ, 457, 211
- Scoville et al. (2001) Scoville, N.Z., Polletta, M., Ewald, S., Stolovy, S.R., Thompson, R., & Rieke, M. 2001, AJ, 122, 3017
- Scoville (2004) Scoville, N.Z. 2004, in The Neutral ISM in Starburst Galaxies, eds. S. Aalto, S. Hüttemeister, & A. Pedlar, ASP Conference Series 320, p. 253
- Skinner et al. (1997) Skinner, C.J., Smith, H.A., Sturm, E., Barlow, M.J., Cohen, R.J., & Stacey, G.J. 1997, Nature, 386, 472
- Smith et al. (1995) Smith, P.S., Schmidt, G.D., Allen, R.G., & Angel, J.R.P. 1995, ApJ, 444, 146
- Soifer et al. (2000) Soifer, B.T., et al. 2000, ApJ, 119, 509
- Spinoglio et al. (2005) Spinoglio, L., Malkan, M.A., Smith, H.A., González-Alfonso, E., Fischer, J. 2005, ApJ, 623, 123
- Sternberg & Dalgarno (1995) Sternberg, A., & Dalgarno, A., 1995, ApJS, 99, 565
- Sturm et al. (1998) Sturm, E., et al. 1998, in ASP Conf. Ser. 145, Astronomical Data Analysis Software and Systems VII, ed. R. Albrecht, R. N. Hook, & H. A. Bushouse (San Francisco: ASP), 161
- Swinyard et al (1996) Swinyard, B.M., et al. 1996, A&A, 315, L43
- Tacconi et al. (2002) Tacconi, L.J., Genzel, R., Lutz, D., Rigopoulou, D., Baker, A.J., Iserlohe, C., & Tecza, M. 2002, ApJ, 580, 73
- Takano et al. (2005) Takano, S., Nakanishi, K., Nakai, N., & Takano, T. 2005, PASJ, 57, L29
- Taylor et al. (1999) Taylor, G.B., Silver, C.S., Ulvestad, J.S., & Carilli, C.L. 1999, ApJ, 519, 185
- Ulvestad et al. (1999) Ulvestad, J.S., Wrobel, J.M., & Carilli, C.L. 1999, ApJ, 516, 127
- Vastel et al. (2002) Vastel, C., Polehampton, E.T., Baluteau, J.-P., Swinyard, B.M., Caux, E., & Cox, P. 2002, ApJ, 581, 315
- Wolfire et al. (1990) Wolfire, M.G., Tielens, A.G.G.M., & Hollenbach, D. 1990, ApJ, 358, 116
- Wright et al. (2000) Wright, C.M., van Dishoeck, E.F., Black, J.H., Feuchtgruber, H., Cernicharo, J., González-Alfonso, E., & de Graauw, Th. 2000, A&A, 358, 689
- Yang & Phillips (2007) Yang, M., & Phillips, T. 2007, ApJ, 662, 284
| Species | Transition | aaFor OH doublets, an average for the two components is given. | Line fluxbbErrors do not include calibration uncertainties in the continuum level. Negative (positive) values indicate that the line is detected in absorption (emission). | ContinuumccUncertainties in the continuum level are less than 30%. | ddEquivalent widths are positive (negative) for lines observed in absorption (emission). |
|---|---|---|---|---|---|
| (m) | ( W cm-2) | ( W cm-2 m-1) | ( m) | ||
| OH | 53.3 | 33.5 | |||
| 63.2 | 25.0 | ||||
| OH | 65.2 | 23.8 | |||
| H2O | 66.4 | 23.1 | |||
| H2O | 67.1 | 22.7 | |||
| OH | 84.5 | 13.8 | |||
| H2O | 101 | 8.70 | |||
| OH | 119.3 | 5.22 | |||
| 121.8 | 4.72 | ||||
| 157.7 | 1.73 |
| Model | Component | aaA gas-to-dust mass ratio of 100 is assumed, together with a mass-absorption coefficient for dust of 44 cm2 g-1 at 100 m. | |||||||
|---|---|---|---|---|---|---|---|---|---|
| (pc) | (cm-2) | (K) | (K) | (M⊙) | (L⊙) | ||||
| - | 1830 | variablebbThe temperature is calculated from the balance between heating and cooling; see text for details. | 23 | 0.72 | |||||
| - | 400 | 55 | 44 | 0.50 | |||||
| - | 200 | 74 | 71 | 0.61 | |||||
| warm | 1.1 | 106 | 100 | 85 | 0.56 | ||||
| cold | 0.97 | 350 | 47 | 42 | 0.22 |
| ModelaaModels correspond to the continuum models listed in Table 2 and shown in Fig. 4c and d. | |||
|---|---|---|---|
| (warm) | (cold) | ||
| (cm-3) | |||
| (km s-1) | 40 | 60 | 40 |
| bb is the column density of a shell of species surrounding the continuum source, and is the column density for the case that species is evenly mixed with the dust. (cm-2) | |||
| bb is the column density of a shell of species surrounding the continuum source, and is the column density for the case that species is evenly mixed with the dust. (cm-2) | |||
| (OH)ccAbundances are given relative to H2 using the values. | |||
| (cm-2) | |||
| (cm-2) | |||
| (H2O)ccAbundances are given relative to H2 using the values. | |||
| ddThe column densities of C+ and O are computed by assuming gas at 400 K, and a O0 to C+ abundance ratio of 2.1. (cm-2) | eeEqual averaged abundances are assumed in the warm and cold components of model . | eeEqual averaged abundances are assumed in the warm and cold components of model . | |
| ddThe column densities of C+ and O are computed by assuming gas at 400 K, and a O0 to C+ abundance ratio of 2.1. (cm-2) | eeEqual averaged abundances are assumed in the warm and cold components of model . | eeEqual averaged abundances are assumed in the warm and cold components of model . |