Detecting Type IIn Supernovae
Abstract
Type IIn supernovae (SNe IIn) dominate the brightest supernova events in observed FUV flux (Å). We show that multi-band, multi-epoch optical surveys complete to m can detect the FUV emission of 25 SNe IIn deg-2 yr-1 rest-frame (10 SNe IIn deg-2 yr-1 observed-frame) to using a technique monitoring color-selected galaxies. Moreover, the strength and evolution of the bright emission lines observed in low-redshift SNe IIn imply that the Ly emission features in 70% of SNe IIn are above 8m-class telescope spectroscopic thresholds for 2 yr rest-frame. As a result, existing facilities have the capability to both photometrically detect and spectroscopically confirm SNe IIn and pave the way for efficient searches by future 8m-class survey and 30m-class telescopes. The method presented here uses the sensitivities and wide-field capabilities of current optical instruments and exploits (1) the efficiency of galaxy color-selection techniques, (2) the intrinsic brightness distribution () and blue profile of SNe IIn continua, (3) the presence of extremely bright, long-lived emission features, and (4) the potential to detect blueshifted SNe Ly- emission shortward of host galaxy Ly- features.
1 Introduction
Type II supernovae (SNe) are explosive, highly luminous events that result from the core collapse of massive stars after exhausting their nuclear fuel. Observations of the sites of Type II SNe have identified the progenitors of Type II-P, IIn, and SN 1987A-type events [see Gal-Yam et al. (2007), references therein, and Li et al. (2007)]. Because these SN types are linked to massive stars, they are sensitive probes of star formation and fundamental tools for the study of galaxy formation and evolution. In this paper, we focus on the Type IIn SNe [SNe IIn; Schlegel (1990); Filippenko (1997)] identified by the very bright, narrow emission lines observed in their spectra. The emission lines are believed to be caused in part by the strong interaction of the SN ejecta with dense circumstellar material111Spectroscopic observations reveal that the emission lines are often comprised of multiple components; a narrow feature (FWHM km s-1) superposed on an intermediate (FWHM 1000-2000 km s-1) or sometimes broad base [FWHM 5000-10000 km s-1]. A discussion of the mechanism behind SNe IIn emission-line profiles is beyond the scope of this paper. The aim here is the detection and confirmation of high redshift SNe IIn via their continua and emission-line flux.. SNe IIn exhibit very blue continua (§ 2), and although the continua fade over a period of weeks, the emission lines are observed to remain bright for years.
The luminosities of most types of SNe near maximum brightness provide rare opportunities to study galactic and individual stellar processes out to very high redshift. However, the properties and extinction of most SNe, and capabilities of current facilities, have prevented detections beyond . For example, although Type Ia SNe are intrinsically bright, they have high UV extinction that makes detections in deep optical imaging surveys difficult. In addition, the deep wide-field IR surveys necessary to find the brighter rest-frame optical flux of such events are difficult to perform. Type II SNe are intrinsically fainter than Type Ia SNe as a whole, but a subset of the Type IIL and IIP SNe show less UV extinction and are bright enough to be detected in deep wide-field optical surveys using current facilities. However once detected, the short outburst duration and relative faintness of their continua make a reliable spectroscopic confirmation prohibitive. This is true for Type Ia detections as well. Therefore the identification and classification of these SNe at high redshift must use methods such as photometric data and model template fitting.
We show that SNe IIn are an exception. The intrinsic brightness and blue continua of SNe IIn not only enable photometric detection at in deep optical surveys but their bright long-lived emission lines provide a means for spectroscopic confirmation. Because their properties enable detection out to , they have great utility as a diagnostic tool to probe cosmic scales.
The progenitors of SNe IIn are believed to be luminous blue variable stars (LBVs) with main sequence masses of [Gal-Yam et al. (2007); also see van Dyk et al. (2006)]. Detonations of these short-lived, high mass stars are direct indicators of recent star formation and can be used to trace the universal star formation rate (SFR) out to high redshift. However, to do this accurately, the dust extinction of SNe IIn as compared to the entire SN population needs to be quantified. Detections at would extend the measurements of the universal supernova rate (SNR) [e.g., Dahlen et al. (2004); Calura & Matteucci (2006)], help confirm or refute observed trends with redshift, and improve subsequent measurements that rely on these values. As the progenitor mass range becomes more refined, SNe IIn detections can provide a constraint on the upper-end of the initial mass function for targeted galaxy populations with an assumption of little mass evolution with redshift. In addition, SNe IIn have the potential to provide an independent statistical discriminator between the SFRs and star formation histories of galaxies modeled from photometric data and stellar synthesis codes [e.g., Shapley et al. (2003); Papovich et al. (2001)]. Because these are core-collapse SNe, their density at high redshift will place constraints on the relic neutrino count [e.g.,Fukugita & Kawasaki (2004); Ando (2004); Strigari et al. (2004)], important for future facilities such as Hyper-K (Nakamura, 2003) and UNO (Jung, 2000). Furthermore, a refinement of the kinetic energy output and fraction of SNe IIn to the entire SNe population will enable SNe IIn to act as an anchor to extrapolate the SN contribution to galactic-scale winds observed in high redshift galaxies [e.g., Adelberger et al. (2003); Cooke et al. (2005)] and help estimate mass loss.
In this paper, we present a photometric technique monitoring color-selected galaxies that can detect SNe IIn in reasonable numbers. Moreover, we analyze the strength and evolution of bright optical and FUV emission lines observed in low-redshift SNe IIn and show that the emission lines of a large fraction of SNe IIn are above the thresholds of 8m-class telescopes for 2 years rest-frame. Consequently, SNe IIn (and for similar reasons Type IIa, see § 3.2) are the only SNe that can be spectroscopically confirmed at using existing facilities. The results of deep optical surveys for SNe IIn will carve out a new area of high redshift research and provide the framework for routine surveys using next generation facilities. Deep wide-field imaging capabilities of future 8m-class survey telescopes and the imaging and spectroscopic sensitivities of 30m-class telescopes will not only greatly increase the density of SNe IIn detections but extend confirmed detections to higher redshifts (§ 4.2). A description of our photometric technique and tests using data from the Canada France Hawaii Telescope Legacy Survey (CFHTLS) are presented in § 2. An analysis of the observed SNe IIn spectroscopic features, Ly behavior, and contaminants to SNe IIn surveys are discussed in § 3. We estimate in § 4 the SNe IIn SNR, the number of detectable SNe IIn for surveys complete to , and the observational expectations for the CFHTLS. We conclude with a brief summary in § 5. We adopt =0.3, =0.7, =70 km s-1 Mpc-1 cosmology. All magnitudes, unless otherwise noted, are in the AB system (Fukugita et al., 1996). Finally, we work in the rest-frame of the SNe but note that effect of time-dilation in the observed frame is important in detection expectations.
2 Photometric Detection
SNe IIn are, on average, comparable in optical brightness to Type Ia SNe [; e.g., Astier et al. (2006)], but because they have a broader distribution, they comprise some of the brightest SN events known. Richardson et al. (2002) determined an extinction corrected value of = (using our cosmology) with a dispersion of for eight SNe IIn that had maximum brightness information in their sample of 46. In addition, four of the remaining 38 events with maximum brightness lower limits were brighter than = . The observed uncorrected fit for the Richardson et al. (2002) sample is = and is the value we adopt in this paper for our calculations.
The FUV photometry and spectroscopic continua acquired to date indicate that SNe IIn suffer only moderate extinction. For example, the Swift observation of SN 2006bv (Immler et al., 2006) reports B = 19.0 and UVM2 three days after discovery. The Swift observation of SN 2007bb (Immler et al., 2007) reports B = 17.9 and UVM2 two weeks after discovery. In addition, the FUV spectrum of SN 1998S (Fransson et al., 2005) shows estimated magnitudes of and at 14 days after outburst. SNe IIn SEDs are modeled as cooling blackbody spectra with an additional observed UV excess (Leonard et al., 2000; Chugai, 2001; Fassia et al., 2001). The observations that SNe IIn are 1 mag fainter at maximum light at 1700Å as compared to their B mag, and rather rapid fade in the FUV weeks afterward, are consistent with this model. As a result, SNe IIn are the brightest of any SN type in the FUV. This is important for detection via the method presented in this paper because the rest-frame FUV is redshifted to the optical (rest-frame flux at 1700Å corresponds to the observed -band at ). From the above discussion, the observed uncorrected of SNe IIn would correspond to at maximum brightness. This translates to over the redshift path . Therefore, detections of SNe IIn in surveys within the flux uncertainties of complete to m are possible, however, any significant detection will need to be pulled from the bright end of the SNe IIn magnitude distribution.
SNe IIn are estimated to comprise % of the total Type II population (Cappellaro et al., 1997; Dahlen et al., 2004). Therefore a large number of galaxies must be monitored to witness a relatively small number of events. Deep wide-field optical surveys can target large volumes at high redshift and detect the FUV emission of a large number of high redshift star-forming galaxies. The widespread Lyman break galaxies (LBGs) at (Steidel et al., 1996, 2003, 2004) comprise a well-studied, well-controlled high redshift population (Adelberger et al., 2003; Pettini et a., 2001; Shapley et al., 2001, 2003; Erb et al., 2004; Cooke et al., 2005, 2006) with many identifying FUV features shifted to optical wavelengths.
We present a method to detect SNe IIn in LBGs using straightforward, albeit deep, existing and future multi-epoch optical surveys (e.g., CFHTLS, Keck Deep Fields, Subaru Deep Field, GOODS, and HST programs). LBGs would be initially identified in stacked or deep epoch images and monitored over multiple epochs to create LBG light curves. Transient flux as a result of a SNe IIn could be detected to a chosen limit of the photometric uncertainty. Searching for flux variations in images with a large number of LBGs can take advantage of relative photometry and avoid the introduction of noise that appears in the conventional method of image subtraction. In addition, this approach filters SNe detections to the targeted redshifts of the color-selection. In this paper, we focus on largely because of (1) the deep wide-field optical imaging and spectroscopic sensitivities of existing facilities, (2) the ability to select large number of faint high redshift galaxies via successfully demonstrated optical photometric color-selection techniques at (Steidel et al., 2004) and (Steidel et al., 1996, 2003; Cooke et al., 2005), and (3) the inherent properties of SNe IIn, but remark that the principles of this method can be applied to all redshifts.
LBG color-selection techniques require deep multi-band images that can also be used to photometrically select rest-frame FUV of SNe IIn. Although SNe IIn can be modeled as blackbodies as described above, this is not straightforward largely because few FUV light curves exist. In addition, SNe IIn show some diversity in the decay time of the more abundant optical light curves. A few SNe IIn exhibit delayed decline (e.g., SN 1995N) whereas the majority follow profiles that (1) show relatively slow brightening, (2) remain consistent to within one mag of their maximum brightness 50d after outburst, and (3) decline 3 mag from their maximum brightness over the first 100d [e.g., see Li et al. (2002)]. We note that the mechanism behind the FUV emission and UV excess mentioned above is not completely understood and it is unclear at this point if the diversity observed in the optical light curve decay rates extends similarly to the FUV. More FUV data is needed to properly assess this. In addition, environment plays a role in their luminosity because the SN ejecta interact with circumstellar material and create bright emission lines. These lines remain bright for years and make a non-negligible contribution to the overall luminosity in both the optical and FUV. Even though only coarse FUV color-selection criteria for SNe IIn have been established at this point, we show in §2.1 that this is sufficient because of their mag distribution and blue continua (§ 2.1). We address other transient event detections in § 3.2.
This method to detect the FUV continuum flux of SNe IIn in LBGs uses broad-band filters. However, the bright emission lines of SNe IIn make a time-dependent contribution to the FUV flux. Typical broad-band filters have a bandpass of Å that correspond to Å rest-frame for objects. Because SNe narrow emission lines are 20Å, an alternate or complementary approach using existing or future facilities would be to incorporate wide-field multi-epoch narrow- or intermediate-band filters tuned to the redshifted Ly- (and Mgii , see § 3.2) emission features with imaging in an off-band for selection control.
2.1 Simulations
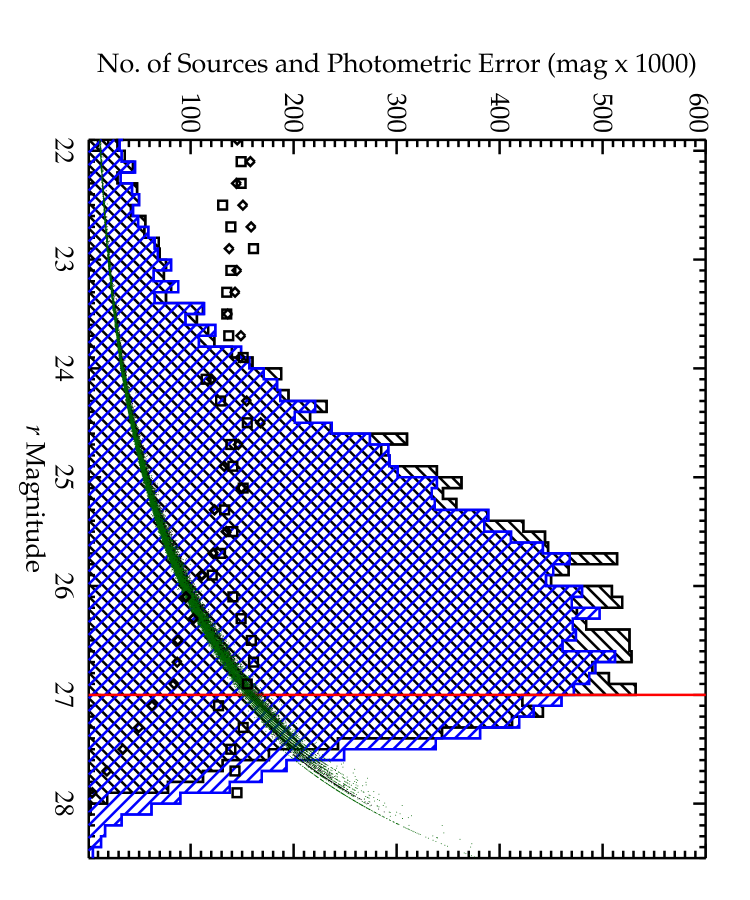
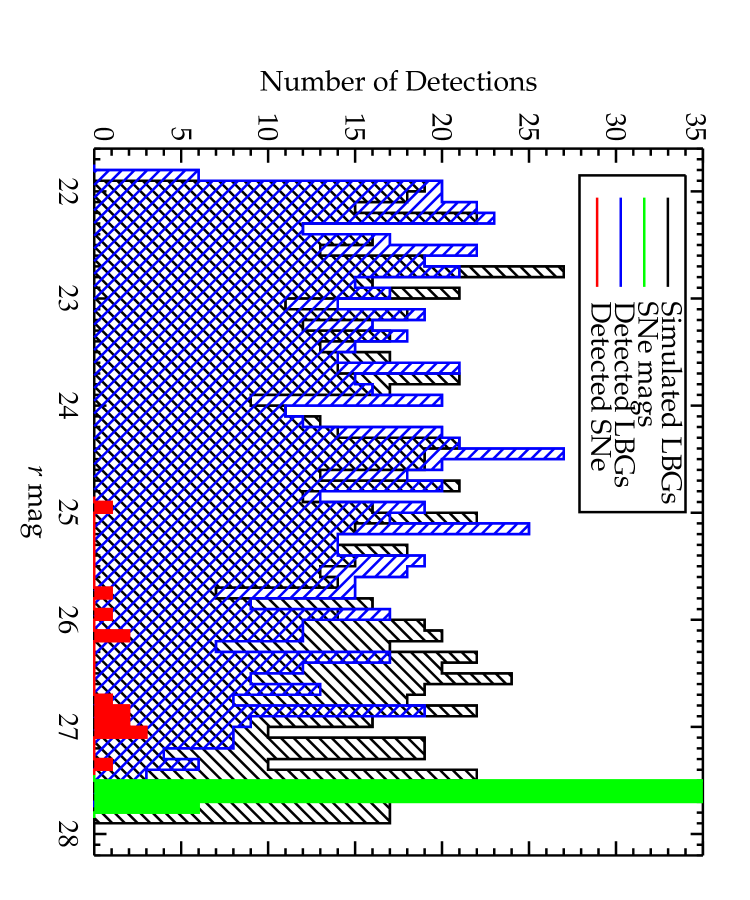
The intrinsic brightness, blue SEDs, and bright emission lines of SNe IIn observed at low to intermediate redshift argue for the feasibility of their photometric detection at high redshift. To test this, we used two deep -band images taken over two epochs kindly obtained from the CFHTLS Deep Synoptic Survey (Sullivan, 2007). These deep images are the combined stacked images taken over several epochs during month observing seasons222For more information regarding the CFHT Legacy Survey and image criteria, see: http://www.cfht.hawaii.edu/Science/CFHLS/. We found the seeing to be arcsec FWHM across the images and a source completeness to m, where we define the completeness as the ability to reliably extract % of the simulated point sources inserted into the images. This is consistent with the number density of real sources detected per magnitude (Figure 1).
Although photometric detections of SNe IIn and other SNe at intermediate to high redshifts () will exist in deep optical survey images, the intrinsic FUV brightness of SNe IIn make them the dominant SNe detectable at . Using SNe templates modeled from data and available online333 http://supernova.lbl.gov/nugent/nugent_templates.html, we calculate that 93% SNe IIn, 7% Type IIL, and a negligible number of Type IIP comprise the detectable SNe at for optical surveys complete to a magnitude limit of m. To select SNe, we duplicate the observational process of detecting SNe IIn in LBGs in the simulations.
LBGs have a half-light radii of arcsec at [e.g., (Steidel et al., 1996; Gardner et al., 2001)] and appear essentially as point sources in ground-based images [although some appear extended (Erb et al., 2004)]. We created simulated LBGs and SNe using the PSF of stars convolved with the seeing in the images using a density similar to the expected m LBG density at . In an attempt to mimic actual observations, we inserted the simulated LBGs randomly, with no attempt to avoid bright objects or edges. Although LBGs are known to exhibit clustering, simulating galaxies with random angular positions is a reasonable approximation considering the large redshift path probed.
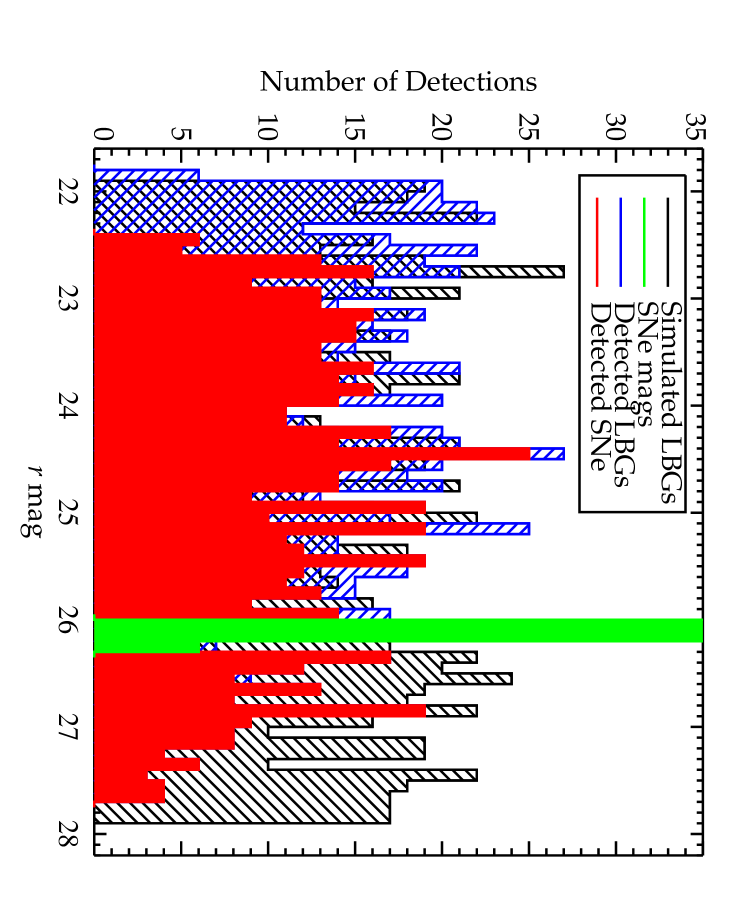
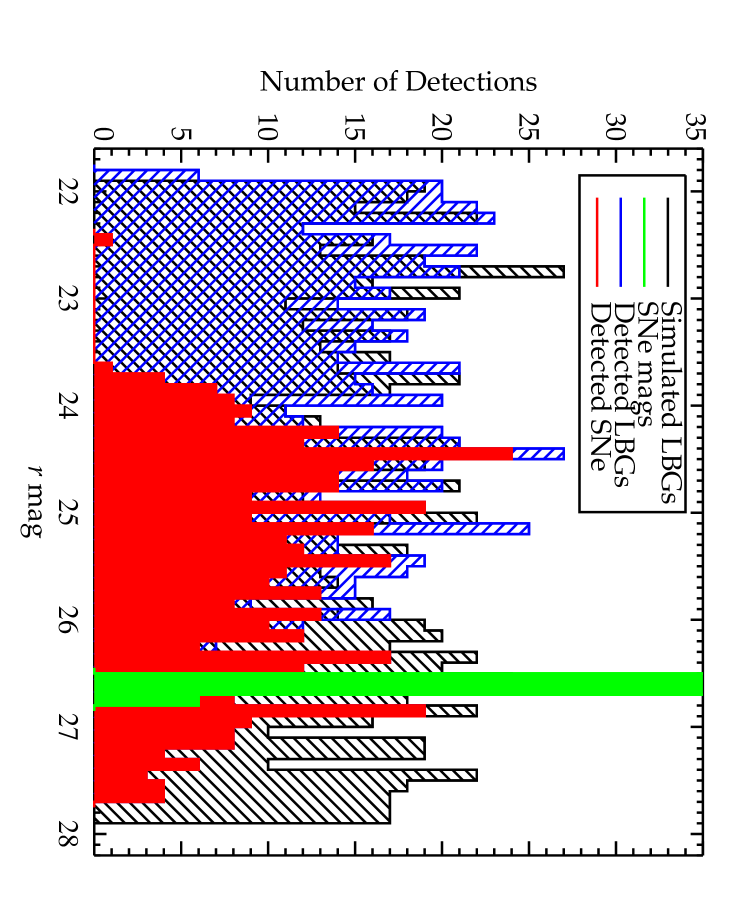
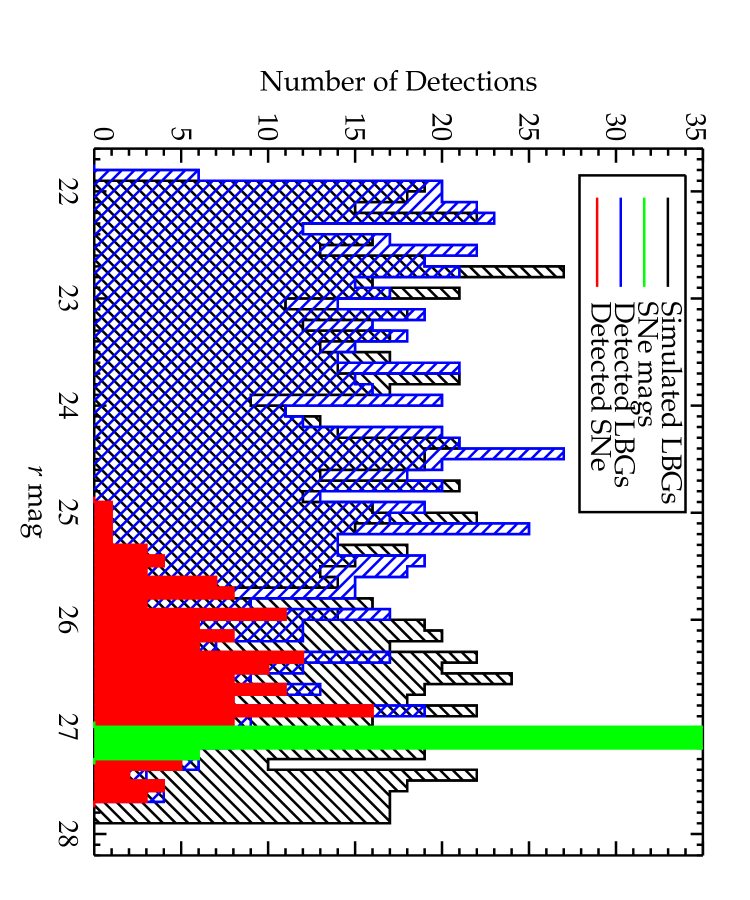
We were able to extract 90% of LBGs with using SExtractor (Bertin & Arnouts, 1996) with a detection threshold value of and minimum detection area of 10 pixels (0.187 arcsec pixel-1). Overlaid in Figure 1 are the number of simulated LBGs and the number of detected LBGs as a function of magnitude. These values were optimized in the usual manner by minimizing spurious detections in negative images. As expected, the bulk of the objects that we were unable to extract were those with , with detections falling to near zero at , and 2% of all simulated sources falling on bright stars, edges, or otherwise contaminated regions. To estimate systematics and determine LBG detection as a function of magnitude, we used SExtractor in dual mode to extract the same LBGs in a second epoch image using the pixels defined by the segmentation map of the first epoch. This duplicates the process by which LBGs are first color-selected for a given survey at one epoch (or in a combined image) and then monitored over the remaining (or separate) epochs. Figure 2 illustrates this analysis for one of the simulations. In all four panels of the figure, the number of simulated LBGs are indicated by the forward hatch (black) histogram and the number of extracted LBGs are indicated by the back hatch (blue) histogram. It can be seen that the detections drop to % at m.
To determine the sensitivity of the images for detecting SNe in LBGs, we overlaid simulated SNe at the locations of the LBGs in one of the epochs. We recorded the fraction of SN detections for a series of SN magnitudes incremented in steps of 0.25 mag with a distribution of mag. Figure 2 displays the results of four of these iterations. In this figure, the dark (red) solid histogram indicates the number of SNe detections and the light (green) solid histogram indicates the SNe mag range of the particular iteration. The LBG photometry in one epoch were compared to the LBG photometry in the second epoch that included the simulated SNe. We chose to define a successful SNe detection as an LBG that displayed a flux enhancement for that LBG. The efficiency was initially determined by placing the simulated SNe at the centroids of the LBGs. To test the efficiency for SNe having offsets from host galaxy centers, the SNe were inserted with radial offsets in increments of 0.1 arcsec from the LBG centroids. We found negligible differences in the detection results up to a radius of 0.5 arcsec, corresponding to kpc at . Beyond that, the overlap of the defined SN pixels with the defined LBG pixels was reduced to the extent that each SN became better detected as a transient event separate from the LBG and would need to be detected by image subtraction. In practice, a photometric search for transients as a function of radius about each color-selected LBG centroid could be employed to select potential SNe from the many transients in deep wide-fields. Finally, from the number of successful SN extractions as a function of LBG and SN magnitudes, we determined the SNe detection efficiency function for this photometric method. We use this function as one of the parameters in estimating observational expectations in §4. All SNe detections determined in this manner can be checked by the conventional method of image subtraction that can also help ascertain the SN centroid offset from the host galaxy.
3 Spectroscopic Confirmation
SNe IIn show promise for spectroscopic confirmation because their optical and FUV emission lines grow extremely bright and remain bright for years. At , the primary SNe IIn emission line in deep optical spectroscopic observations is Ly-. Currently only a few low redshift FUV spectra of SNe IIn exist. Therefore we first study the behavior of the larger dataset of H- emission lines in the literature and then focus on the smaller FUV dataset to construct line ratio and Ly- emission-line strength expectations.
The brightness evolution (or single measurement) of the H- emission line flux of ten SNe IIn (and two Type IIa SNe) is shown in Figure 3. In this figure, all fluxes and days after outburst are corrected to the arbitrary epoch of . The SNe used here are assumed to be representative of typical SNe IIn. They have observed absolute B magnitudes near maximum brightness that are consistent with the distribution adopted in this paper [SN1978K ; SN1987F ; SN1988Z ; SN1994W ; SN1994aj ; SN1995G ; SN1995N ; SN1997ab ; SN1997cy ; SN1998S (Type IIa: SN1997eg ; SN2002ic )]. It can be seen in Figure 3 that, except for the rapid decline observed in SN1994W (which also has a reported rapid decline in its optical continuum), there is a general form to the emission line evolution. The H- emission line flux appears (1) to remain bright or increase in brightness for the first d, (2) “knee” or peak in brightness, and (3) exhibit a slow consistent decline. This trend is seen for each SNe IIn but at different observed strengths.
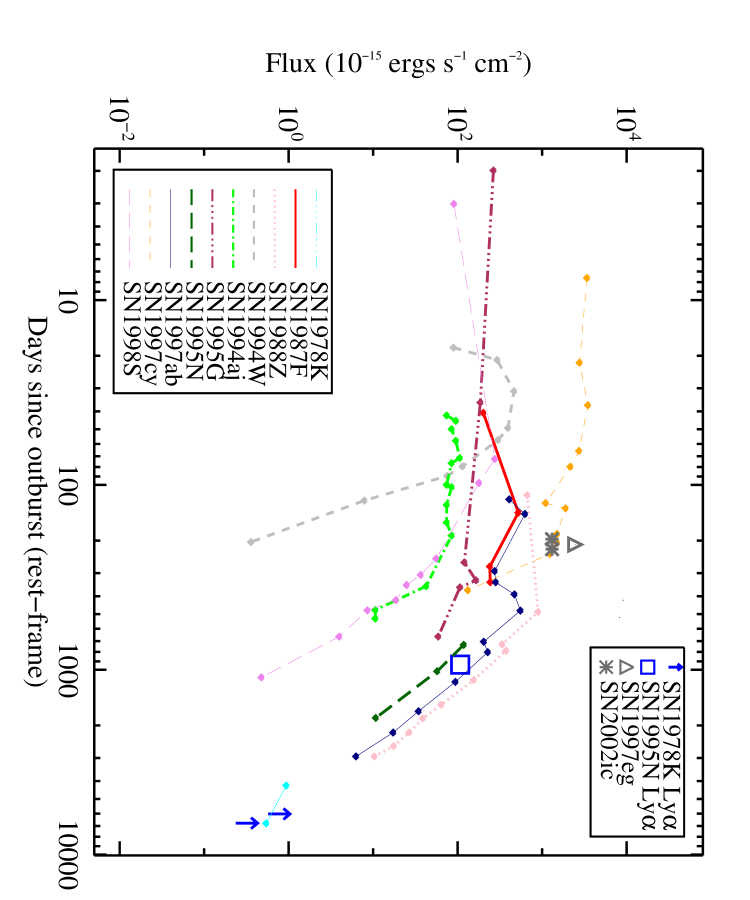
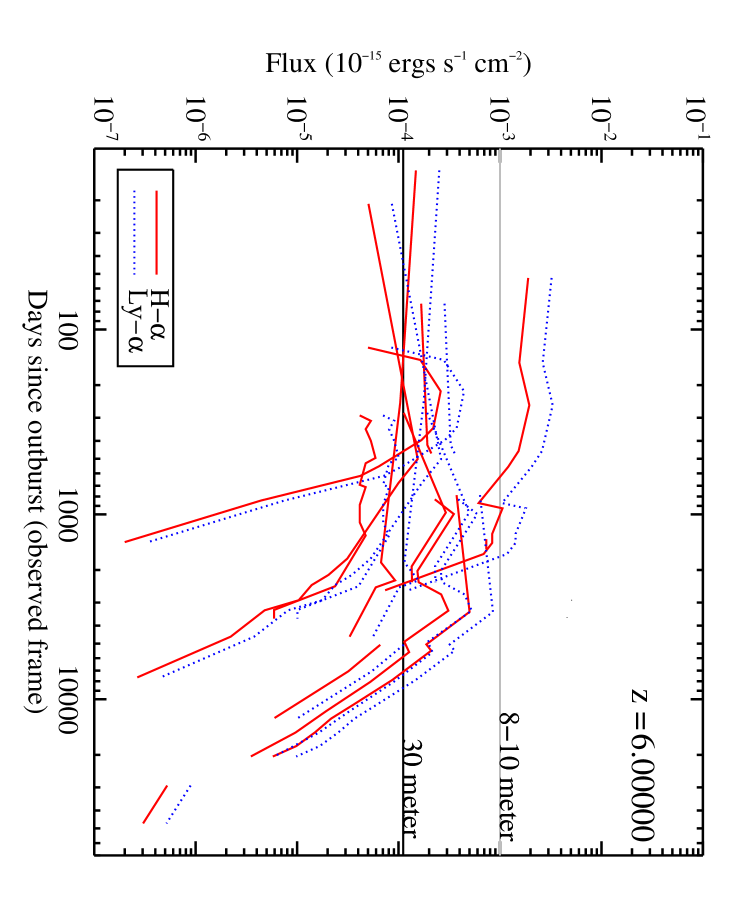
The peak H- emission line fluxes () in these low- to intermediate-redshift SNe IIn would be between erg s-1 cm-2 if observed at . Previous long exposure (2-6 hr.) observations [e.g., Martin & Sawicki (2004); Cooke et al. (2005) and Venemans, et al. (2007)] using LRIS (Oke et al., 1995) on Keck and FORS2 (Appenzeller et al., 1998) on the VLT have demonstrated the ability to detect narrow emission line fluxes as faint as 1 erg s-1 cm-2 to 444This includes observations using LRIS with the new, higher sensitivity, blue CCDs.. The Ly features of SNe IIn are expected to be equivalent to or brighter than the H features. The Ly-/H line ratio of SN1995N is observed to be (Fransson et al., 2002) and 1 for SN1978K (Schlegel et al., 1999). However, the latter is more difficult to assess relative to the discussion here because of the pointing errors reported in that work and its late stage of evolution. Figure 4 shows the values for the SNe plotted in Figure 3 if observed at and . The Ly evolution in Figure 4 is plotted to follow the H evolution with a constant Ly-/H ratio of 1.7. In this manner, the evolution of the H and Ly line strengths shown here bracket the observed values for SNe IIn Ly strengths. We have a Hubble Space Telescope program underway to study a sample of low to intermediate redshift SNe IIn to improve the FUV continuum and Ly- emission line measurements and the Ly-/H- ratio and evolution.
It is important to note that at , Ly- features are redshifted between Å and fall over a wavelength range where there are no bright night sky emission lines to conflict with detections. In addition, the Ly- emission lines of SNe IIn are estimated to remain detectable for 2 years in the rest-frame, or years in the observer’s frame. Integrating the fraction of photometrically detectable SNe over redshift path , we find the bulk of detectable SNe IIn near . Therefore, an extrapolation of the H evolution using a Ly-/H emission line flux ratio of 1 results in 85% of all SNe IIn similar to this sample would have detectable Ly emission during the brightest epoch of their evolution using current facilities. In the case for 30-m telescopes, all SNe IIn similar to this sample would be detectable, and for a longer duration.
3.1 Ly- emission
Beyond their FUV luminosity and emission-line strength, another advantageous aspect toward the detection of SNe IIn is that their emission lines are observed to be blueshifted with respect to the host galaxy by km s-1 [e.g., Fransson et al. (2002, 2005); Turatto et al. (1993); Filippenko (1997); Leonard et al. (2000)] and can aid in feature separation. If this weren’t the case, the intrinsic Ly- emission and/or absorption observed in LBG spectra could present a serious obstacle. Although the H-alpha line profiles are sometimes observed to decompose into multiple components, the Ly-alpha feature appears as a single component and is observed to remain blueshifted through day 494 for SN 1998S (Fransson et al., 2005) and day 943 for SN 1995N (Fransson et al., 2002). The Ly emission features of the host LBGs are redshifted 600 km s-1and the Ly absorption features are blueshifted 150 km s-1 on average with respect to the systemic redshift (Adelberger et al., 2003; Shapley et al., 2003; Cooke et al., 2005). The systemic offset of LBG Ly- features has been determined using nebular emission line observations (Pettini et a., 2001) and is attributed to galactic-scale outflows driven by stellar and SNe winds [also see Mas-Hesse et al. (2007); Tapken et al. (2007)].
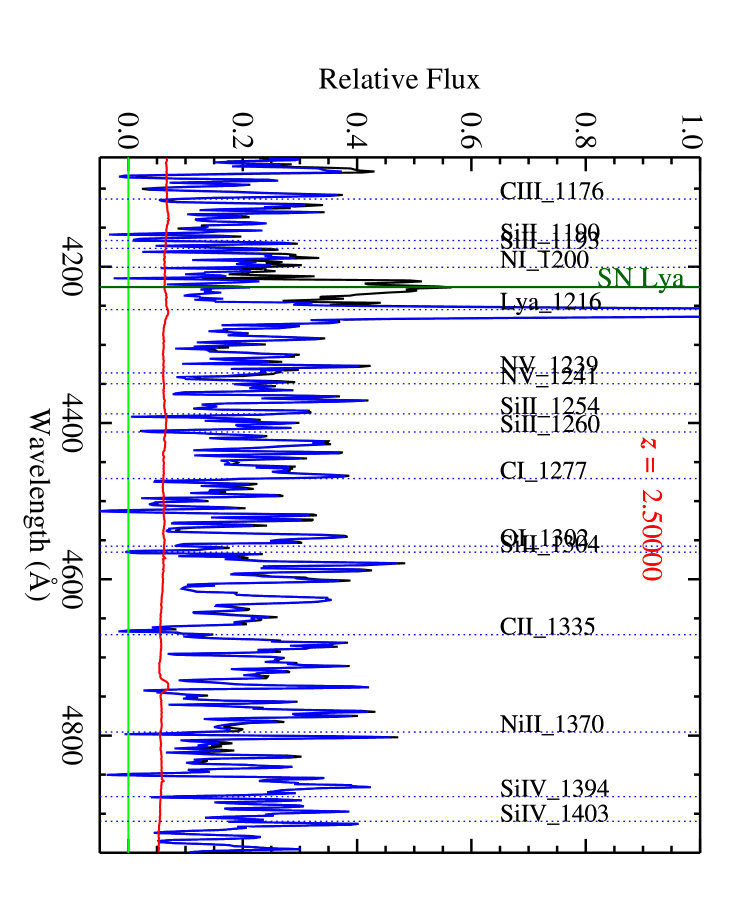
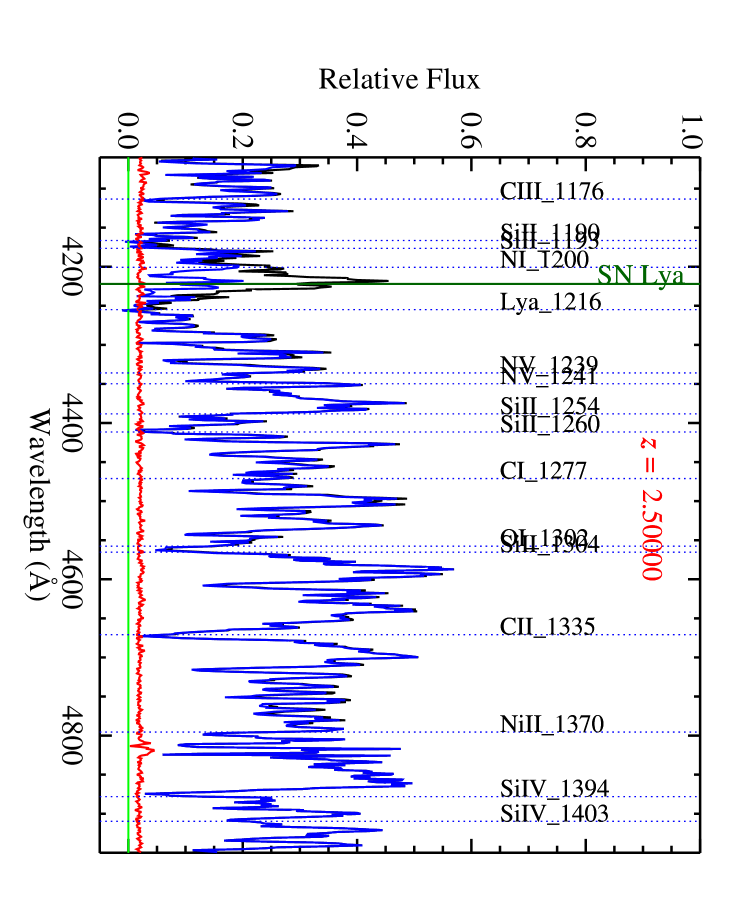
The observed SNe IIn Ly- blueshift is great enough to allow the escape of photons from star forming regions and line-of-sight interstellar clouds containing high column densities of neutral hydrogen. For example, a SN Ly- feature blueshift of 1000 km s-1 is large enough for % of the photons to escape systems with log N(Hi) = 19 (Mas-Hesse et al., 2007) and a blueshift of 3000 km s-1 can escape sightlines with damped absorption [log N(Hi) = 20.3]. From the surveys of (Steidel et al., 2003; Cooke et al., 2005), it can be seen that LBGs exhibit a smooth range of Ly profiles with 50% dominated by Ly in emission and 50% dominated by Ly in absorption of varying EW. From the results of Shapley et al. (2003) and an analysis of the spectra of Cooke et al. (2005) it can be deduced that 90% of the Ly- photons of SNe IIn can escape % of all LBGs. Therefore, assuming the emission line evolution above is representative of the SNe IIn population, we estimate that 70% of all SNe IIn are spectroscopically detectable. Figure 5 displays a simulated detection of the peak Ly emission km s-1) from a SN IIn in two LBGs. The blueshifted SN Ly emission feature is cleanly separated from the both the host LBG Ly emission feature and the host LBG Ly absorption feature.
In summary, follow-up spectroscopic detection of SNe IIn Ly- emission in LBGs is currently feasible and would identify photometrically selected SNe candidates. For SNe IIn, there are no bright night sky emission lines to interfere with Ly emission line detections. The blueshift of the SNe Ly emission line provides a natural means to separate the SNe from the host galaxy Ly feature. Subsequent observations to monitor the evolution of the SN Ly emission would provide definitive confirmation of SNe without photometric redshifts and template fitting.
3.2 Contaminants
For photometrically selected LBGs at , AGN are the primary source contaminant to mimic SNe IIn transient events. Removing AGN from the photometric results will depend directly on the design of the imaging program. Surveys using the LBG color-selection techniques described here that have follow-up spectroscopic identifications (Steidel et al., 2003, 2004; Cooke et al., 2005) find % of the LBG candidates to m to have AGN activity, or AGN deg-2. Guided by the faint AGN luminosity function [e.g., (Shankar & Mathur, 2007; Wolf et al., 2003)], we estimate AGN deg-2 to m. In practice, the final density of AGN that appear like SNe IIn will be less than this and will depend on AGN that (1) vary at the detectable level during observation, (2) exhibit only one variation over multiple epochs, and (3) follow SNe IIn FUV light curve expectations. Nevertheless, many AGN are expected to contaminate the photometric SNe candidates. All but the faintest of these can be identified and eliminated with the deep follow-up spectroscopy that is necessary to confirm SNe IIn candidates.
Using the magnitude depths in five filters (*) and the five epochs of the CFHTLS, we make a coarse estimate that AGN deg-2 will pass the above constraints and contaminate the CFHTLS data. This is a few times the number of estimated SNe IIn (observed-frame) that would be detected from (§ 4.2) and implies % efficiency for the CFHTLS Deep survey in follow-up deep spectroscopy. Future surveys with filters, epochs, and depths better tailored to this method and refined information regarding the FUV evolution of SNe IIn, will improve this efficiency. For example, AGN typically exhibit stronger Civ emission relative to Mgii emission. Further evidence supporting the observed reverse behavior of strong Mgii emission and weak Civ emission in SNe IIn (Fransson et al., 2002, 2005) would substantiate an effective method of using narrow-band filters to detect SNe IIn candidates while filtering out AGN. This method would invoke deep imaging with filters centered on Civ, Mgii , and an off-band over multiple epochs and use the Civ/Mgii line ratios to discriminate between AGN and SNe IIn.
For completeness, the recently classified Type IIa SNe (Deng et al., 2004), exhibit properties similar to SNe IIn and are very bright events. To date, only five objects have been placed in this category: SN 2006gy (Ofek et al., 2006), SN 2005gj (Aldering et al., 2006), SN 2002ic (Hamuy et al., 2003), SN 1999E (Rigon et al., 2003), and SN 1997cy (Germany et al., 2000). The typical maximum brightness and behavior of Type IIa SNe is uncertain because of the small sample, but have been observed as bright as M (Ofek et al., 2006). These rare events display bright emission lines from circumstellar interaction and would contribute to the total number of detected SNe events. With careful design and more data, Type IIa SNe detections may prove to be an excellent diagnostic of high redshift binary C+O white dwarfs that are currently believed to be their progenitors.
4 Observational Expectations
4.1 Type IIn supernovae rate estimation
Although the Type Ia supernova rate (SNR) has been measured out to , the Type II SNR has not been measured beyond (Dahlen et al., 2004; Scannapieco & Bildsten, 2005; Sullivan et al., 2006; Neill et al., 2006). To estimate the expected number of in dedicated deep searches monitoring LBGs, we first estimate the Type II SNR for LBGs and use the IIn/II fraction to estimate the number of SNe IIn LBG-1 yr-1. Finally, we use the color-selected LBG densities from deep optical surveys to calculate the number of SNe IIn deg-2 yr-1.
The SFR and IMF of LBGs are two fundamental ingredients in determining the Type II SNR. We adopt an average LBG SFR of yr-1 after considering (1) a median SFR of 44 yr-1 for a sample of 74 LBGs with determined by spectral synthesis modeling of their IR photometry (Shapley et al., 2001) and (2) an average of 36 yr-1 from a sample of 798 LBGs with determined by their rest-frame 1700Å flux (Shapley et al., 2003). These SFRs were determined using a Salpeter IMF (Salpeter, 1955) with a mass range of and is therefore the IMF we adopt here. Assuming no evolution in the average LBG SFR over and that all stars with become core-collapse SNe, we find Type II SNe LBG-1 yr-1. As a check, we compare this with the rate derived by using SNRs at and observed trends to higher redshift found in the literature and find it to be consistent. The Type Ia SNRs reported in Sullivan et al. (2006) and a median value from Scannapieco & Bildsten (2005), assuming a Type Ia/II SNR ratio of 3 (Dahlen et al., 2004; Madau et al., 1998), results in the expectations of 0.107 and 0.120 Type II SNe in LBG-1 yr-1, respectively.
The effect of dust is important in this estimation. Dahlen & Fransson (1999) show that the expected number of core-collapse SNe at high redshift is relatively insensitive to dust. They test different reddening values and show that, in order to be consistent with the measured UV flux at high redshift, higher dust requires a higher SNR. As a result, the number of detectable SNe is largely unaffected. In addition, their models assume all galaxies are established disk systems in which the main impact is from edge-on systems. From the existing HST images [e.g, Law et al. (2007)], this does not appear to be the case for most LBGs. Therefore, we consider the overall effect of dust on the expected number of core-collapse SNe to be small and within the uncertainties of the estimate below.
There are varying estimates of the IIn/II SNe fraction ranging from % (Cappellaro et al., 1997; Dahlen et al., 2004) to 12% from a tabulation of online magnitude-limited SN survey discoveries (e.g., CfA)555http://cfa-www.harvard.edu/oir/Research/supernova/SNarchive.html that are biased toward the brightest SNe. A possible physical constraint comes from the fact that LBVs with initial mass consistent with Type IIn SNe progenitors () make up % of the core-collapse progenitors using the above IMF. We adopt this latter value for our estimate and conclude that there are SNe IIn LBG-1 yr-1 at . The bulk of the uncertainty in this estimate is in the SFR measurements and the SNe IIn fraction. For the IR sample of Shapley et al. (2001) we used the median SFR, however, the mean SFR is . The fraction of LBGs with very high SFRs (some are fit with yr-1) will dominate the total number of expected SNe IIn. In addition, because observations constrain the SNe IIn fraction from being much lower than our adopted value, we consider 2.1% to be a conservative and 3% as a plausible upper limit. Using these values in determining the uncertainty, we estimate that there is one SNe IIn in LBGs. Finally, we comment on an additional factor that is not incorporated in this estimation. Most LBGs are best fit using young starburst models (Sawicki & Yee, 1998; Shapley et al., 2001; Papovich et al., 2001). Depending on the analysis, % to % of the fits have timescales since last starburst () of Myr. Such timescales are in line with the ages of massive stars and would result in these LBGs displaying a higher number of SNe, implying a higher number of expected SNe IIn.
4.2 Predictions
Imaging surveys complete to using the photometric technique of Steidel et al. (2003, 2004) and can color select 14 LBGs arcmin-2 at and 9 LBGs arcmin-2 at (Sawicki & Thompson, 2005). This results in 65000 LBGs deg-2 at after accounting for the photometric selection efficiency of each population and color-selection overlap. Our estimation above implies that there exists roughly () SNe IIn deg-2 yr-1 rest-frame (observed-frame) in color-selected LBGs to . Incorporating the observed LBG density with redshift (Steidel et al., 2003, 2004; Cooke et al., 2005), the LBG and SNe IIn detection functions (§ 2.1), and the SNe IIn magnitude distribution (§ 2), we find 3 (1), 25 (8), and 130 (40) detectable SNe IIn deg-2 yr-1 rest-frame (observed-frame) for surveys complete to m, 27, and 28, respectively, to flux uncertainty. Therefore, probing one magnitude shallower or deeper than the m depth discussed throughout this work makes a significant difference in the number of detectable SNe IIn deg-2 yr-1. From earlier arguments (§ 3.1), we predict that 70% of these SNe IIn are detectable using existing facilities for 2 years rest-frame..
We now estimate the observational expectations for the CFHTLS Deep Synoptic Survey that consists of four square-degree pointings over five yearly observing seasons (2003-2008). Each of the seasonal stacked images are complete to m and obtained over approximately six month intervals (6-9 weeks rest-frame) per year with tight constraints on the image quality to provide consistent data (§ 2.1). Accounting for the dilution of the observed magnitude and multiple detections over an 50d rest-frame stacked observation, we expect to find SNe deg-2 season-1 in the observed frame. Therefore, for the complete four-degree, five-season CFHTLS Deep Synoptic Survey, we expect photometrically detectable SNe IIn with of these expected to have detectable Ly- emission lines.
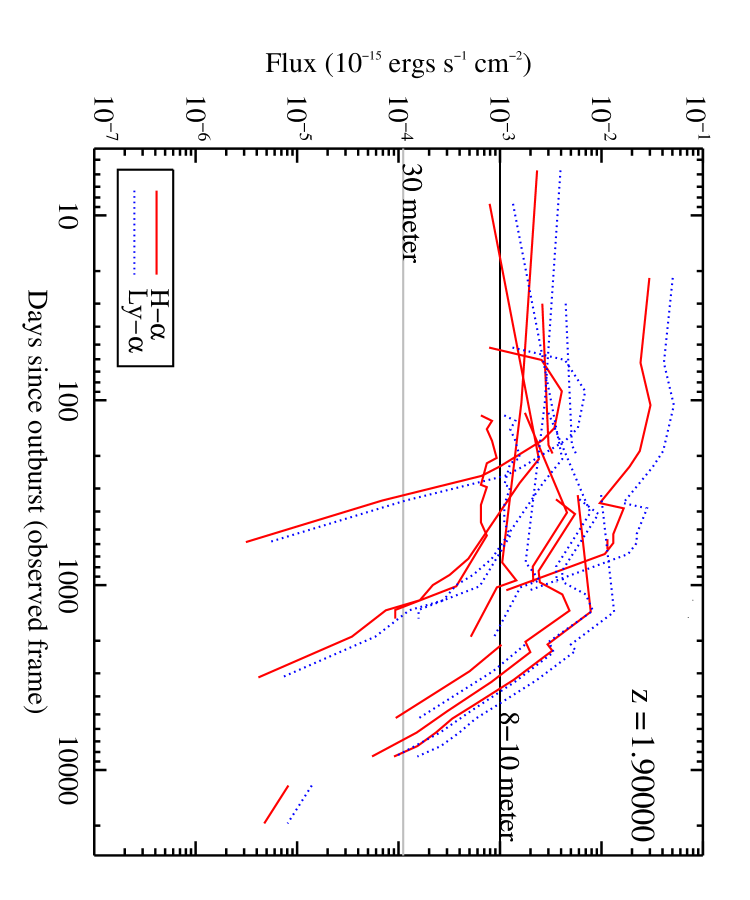
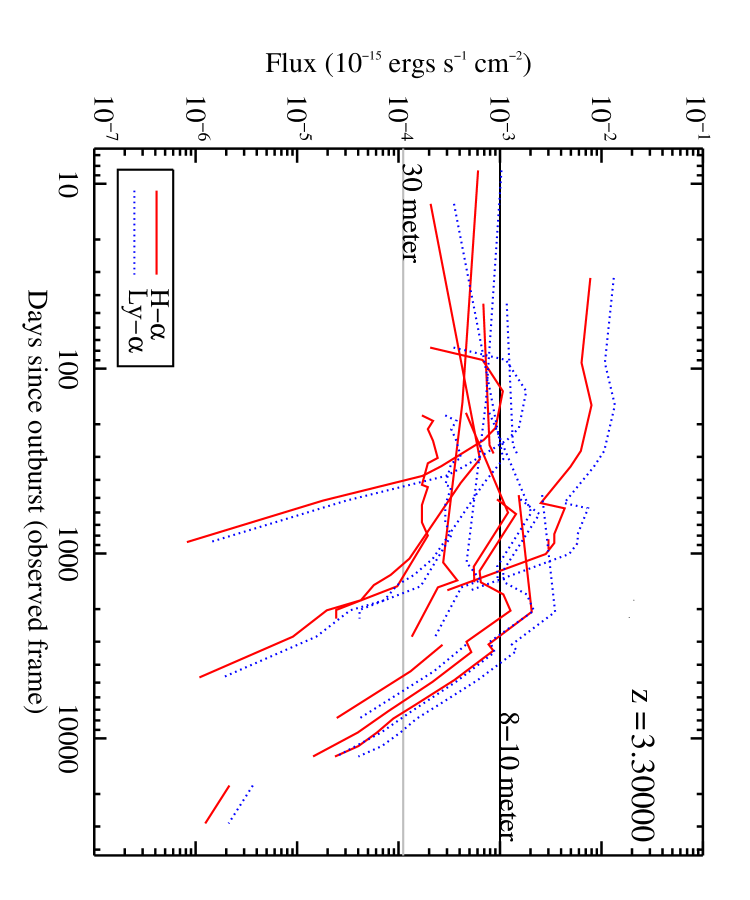
The capabilities of deep wide-field 8m-class telescope surveys and the sensitivities of future 30m-class telescopes will detect a greater density of SNe IIn. It can be seen in Figure 4 that the projected sensitivities of future facilities will spectroscopically confirm SNe emission at much greater significance, for a longer duration, and will have the ability to detect fainter SNe IIn emission lines. Figure 6 displays the results from low-redshift SNe IIn in Figure 3 corrected to . Inspection of this figure, Figure 4, and the FUV spectra of SN1995N and SN1998S (Fransson et al., 2002, 2005), indicate that future facilities have the potential to detect SNe IIn to as well as confirm SNe IIn using Mgii, H-, and other bright lines to use SNe IIn to probe the universe from .
5 Summary
We have presented a photometric and spectroscopic technique to detect SNe IIn in reasonable numbers using current technology. Although this technique can be applied to any redshift, we focus on SNe at because of (1) the sensitivities and wide-field capabilities of current optical instruments, (2) the success and efficiency of photometric selection techniques, and (3) the inherent properties of SNe IIn and galaxies.
SNe IIn have and very blue continua with an estimate FUV (1700Å) flux mag fainter at maximum brightness. In addition, SNe IIn have bright emission features that make a non-negligible contribution to the total flux that can be used for detection and contaminant rejection. We estimate that there exist SNe IIn deg-2 yr-1 rest-frame ( observed-frame) in color-selected LBGs to m. We show from our simulations using real data obtained from the CFHTLS Deep Synoptic Survey that deep, multi-band, multi-epoch wide-field imaging surveys complete to m can detect 25 SNe IIn deg-2 yr-1 rest-frame (8 observed-frame) at to flux uncertainty. These surveys can be performed independently or in conjunction with a targeted narrow- to intermediate-band deep imaging program. Contaminants, such as AGN, can be largely eliminated by the design of the photometric program, selection criteria, and by follow-up deep spectroscopy.
The general evolution of H- and Ly- emission lines at low redshift predicts that the Ly- features of % of SNe IIn are above the spectroscopic thresholds of 8m-class facilities for years rest-frame. Therefore, sensitive low-resolution optical spectrographs on 8m-class telescopes have the capability to spectroscopically identify SNe IIn photometric candidates. Positive confirmation of spectroscopic candidates can be obtained at subsequent epochs as the line flux evolves. The blueshift ( km s-1) of the Ly emission lines observed in low redshift SNe IIn would result in a clean separation from an LBG host galaxy Ly- emission and absorption if observed at . Under the assumption that this property is inherent to SNe IIn, the findings of Shapley et al. (2003) and the analysis of the LBG spectroscopic sample of Cooke et al. (2005) result in an estimate that the Ly- emission lines from SNe IIn can escape 90% of all LBGs. Combined with the strength of SNe IIn Ly emission, this results in the detectability of 70% of all SNe IIn.
To pursue the technique presented here, we have initiated a program to better characterize SNe IIn features at low to intermediate redshift using the Hubble Space Telescope and a complete program to search for SNe IIn using the CFHTLS Deep Synoptic Survey data. Analyzing seasonal stacked images of the CFHTLS Deep Synoptic survey, we estimate the photometric detection of SNe deg-2 season-1 in the observed frame, or and spectroscopic confirmation of SNe IIn in the four square-degree pointings over five years of the survey. These, and future programs, will pave the way for routine surveys using the next generation of 8m-class survey and 30m-class telescopes that will detect a greater density of SNe IIn and potentially extend SNe IIn detection and Ly- confirmation to . In addition, such surveys could confirm SNe IIn using MgII, H-, and other bright lines. The detection of SNe IIn is important to many areas of astrophysics, such as stellar physics and galaxy formation and evolution, and will become more so as we learn more about the mechanism behind SNe IIn and the details of their properties and environments.
References
- Adelberger et al. (1998) Adelberger, K. L., Steidel, C. C., Giavalisco, M., Dickinson, M., Pettini, M., & Kellogg, M. 1998, ApJ, 505, 18
- Adelberger et al. (2003) Adelberger, K. L., Steidel, C. C., Shapley, A. E., & Pettini, M. 2003, ApJ, 584, 45
- Aldering et al. (2006) Aldering, G., Antilogus, P., Bailey, S., Baltay, C., Bauer, A., Blanc, N., Bongard, S., Copin, Y., Gangler, E., Gilles, S., Kessler, R., Kocevski, D., Lee, B. C., Loken, S., Nugent, P., Pain, R., Pécontal, E., Pereira, R., Perlmutter, S., Rabinowitz, D., Rigaudier, G., Scalzo, R., Smadja, G., Thomas, R. C., Wang, L. & Weaver, B. A. 2006, ApJ, 650, 510
- Ando (2004) Ando, S. 2004, ApJ, 607, 20
- Appenzeller et al. (1998) Appenzeller, I., Fricke, K., Furtig, W., Gassler, W., Hafner, R., Harkl, R., Hess, H.-J., Hummel, W., Jurgens, P., Kudritzki, R.-P., Mantel, K.-H., Meisl, W., Muschielok, B., Nicklas, H., Rupprecht, G., Seifert, W., Stahl, O., Szeifert, T. & Tarantik, K. 1998, The Messenger, 94, 1
- Aretxaga et al. (1999) Aretxaga, I., Benetti, S., Terlevich, R. J., Fabian, A. C., Cappellaro, E., Turatto, M. & della Valle, M. 1999, MNRAS, 309, 343
- Astier et al. (2006) Astier, P., Guy, J., Regnault, N., Pain, R., Aubourg, E., Balam, D., Basa, S., Carlberg, R. G., Fabbro, S., Fouchez, D., Hook, I. M., Howell, D. A., Lafoux, H., Neill, J. D., Palanque-Delabrouille, N., Perrett, K., Pritchet, C. J., Rich, J., Sullivan, M., Taillet, R., Aldering, G., Antilogus, P., Arsenijevic, V., Balland, C., Baumont, S., Bronder, J., Courtois, H., Ellis, R. S., Filiol, M., Gonçalves, A. C., Goobar, A., Guide, D.,, Hardin, D., Lusset, V., Lidman, C., McMahon, R., Mouchet, M., Mourao, A., Perlmutter, S., Ripoche, P., Tao, C., & Walton, N. 2006, A&A, 447, 31
- Benetti et al. (1998) Benetti, S., Cappellaro, E., Danziger, I. J., Turatto, M., Patat, F., & della Valle, M. 1998, MNRAS, 294, 448
- Bertin & Arnouts (1996) Bertin, E. & Arnouts, S. 1996, A&AS, 117, 393
- Calura & Matteucci (2006) Calura, F. & Matteucci, F 2006, ApJ, 652, 889
- Cappellaro et al. (1997) Cappellaro, E., Turatto, M., Tsvetkov, D. Yu., Bartunov, O. S., Pollas, C., Evans, R. & Hamuy, M. 1997, A&A, 322, 431
- Chugai et al. (1995) Chugai, N. N., Danziger, I. J. & della Valle, M. 1995, MNRAS, 276, 530
- Chugai (2001) Chugai, N. N. 2001, MNRAS, 326, 1448
- Chugai et al. (2004) Chugai, N. N., Blinnikov, S. I., Cumming, R. J., Lundqvist, P., Bragaglia, A., Filippenko, A. V., Leonard, D. C., Matheson, T. & Sollerman, J. 2004, MNRAS, 352, 1213
- Cooke et al. (2005) Cooke, J., Wolfe, A. M., Gawiser, E., & Prochaska, J. X. 2005, ApJ, 621, 596
- Cooke et al. (2006) Cooke, J., Wolfe, A. M., Prochaska, J. X., & Gawiser, E. 2006 ApJ, 652, 994
- Dahlen & Fransson (1999) Dahlen, T. & Fransson, C. 1999 A&A, 350, 349
- Dahlen et al. (2004) Dahlen, T., Strolger, L. -G., Riess, A. G., Mobasher, B., Chary, R. -R., Conselice, C. J., Ferguson, H. C., Fruchter, A. S., Giavalisco, M., Livio, M., Madau, P., Panagia, N. & Tonry, J. L. 2004, ApJ, 613, 189
- Deng et al. (2004) Deng, J., Kawabata, K. S., Ohyama, Y., Nomoto, K., Mazzali, P. A., Wang, L., Jeffery, D. J., Iye, M., Tomita, H. & Yoshii, Y. 2004, ApJ, 605, 37
- Erb et al. (2004) Erb, D. K., Steidel, C. C., Shapley, A. E., Pettini, M., & Adelberger, K. L. astro-ph/0404235
- Fassia et al. (2001) Fassia, A., Meikle, W. P. S., Chugai, N., Geballe, T. R., Lundqvist, P., Walton, N. A., Pollacco, D., Veilleux, S., Wright, G. S., Pettini, M., Kerr, T., Puchnarewicz, E., Puxley, P., Irwin, M., Packham, C., Smartt, S. J. & Harmer, D. 2001, MNRAS, 325, 907
- Filippenko (1997) Filippenko, A. V. 1997, ARAA, 35, 309
- Filippenko (1989) Filippenko, A. V. 1989, AJ, 97, 726
- Fransson et al. (2002) Fransson, C., Chevalier, R. A., Filippenko, A. V., Leibundgut, B., Barth, A. J., Fesen, R. A., Kirshner, R. P., Leonard, D. C., Li, W., Lundqvist, P., Sollerman, J., Van Dyk & S. D. 2002, ApJ, 572, 350
- Fransson et al. (2005) Fransson, C., Challis, P. M., Chevalier, R. A., Filippenko, A. V., Kirshner, R. P., Kozma, C., Leonard, D. C., Matheson, T., Baron, E., Garnavich, P., Jha, S., Leibundgut, B., Lundqvist, P., Pun, C. S. J., Wang, L. & Wheeler, J. C. 2005, ApJ, 622, 991
- Fukugita et al. (1996) Fukugita, M., Ichikawa, T., Gunn, J. E., Doi, M., Shimasaku, K., & Schneider, D. P. 1996, AJ, 111, 1748
- Fukugita & Kawasaki (2004) Fukugita, M. & Kawasaki, M. 2003, MNRAS, 340, 7
- Gal-Yam et al. (2007) Gal-Yam, A., Leonard, D. C., Fox, D. B., Cenko, S. B., Soderberg, A. M., Moon, D. -S., Sand, D. J., Li, W., Filippenko, A. V., Aldering, G. & Copin, Y. 2007, 656, 372
- Gardner et al. (2001) Gardner, J. P., Brown, T. M., & Ferguson, H. C. 2000, ApJ, 542L, 79
- Germany et al. (2000) Germany, L. M., Reiss, D. J., Sadler, E. M., Schmidt, B, P. & Stubbs, C. W. 2000, ApJ, 533, 320
- Hagen et al. (1997) Hagen, H.-J., Engels, D. & Reimers, D. 1997, A&A, 324, 29
- Hamuy et al. (2003) Hamuy, M., Phillips, M. M., Suntzeff, N. B., Maza, J., González, L. E., Roth, M., Krisciunas, K., Morrell, N., Green, E. M., Persson, S. E., & McCarthy, P. J. 2003, Nature, 424, 651
- Immler et al. (2006) Immler, S. & Pooley, D. 2006, ATel, 802, 1
- Immler et al. (2007) Immler, S. & Brown, P. J. 2007, ATel, 1053, 1
- Jung (2000) Jung, C. K. 2000, hep-ex/0005046
- Law et al. (2007) Law, D. R., Steidel, C. C., Erb, D. K., Pettini, M., Reddy, N. A., Shapley, A. E., Adelberger, K. L., & Simenc, D. J. 2007, ApJ, 656, 1
- Leonard et al. (2000) Leonard, D. C., Filippenko, A. V., Barth, A. J., & Matheson, T. 2000, ApJ, 536, 239
- Li et al. (2002) Li, W., Filippenko, A. V., van Dyk, S. D., Hu, J., Qiu, Y., Modiaz, M. & Leonard, D. C. 2002, PASP, 114, 403
- Li et al. (2007) Li, W., Wang, X., Van Dyk, S. D.; Cuillandre, J.-C., Foley, R. J. & Filippenko, A. V. 2007, ApJ, 661, 1013
- Madau et al. (1998) Madau, P., Della Valle, M. & Panagia, N. 1998, MNRAS, 297, L17
- Martin & Sawicki (2004) Martin, C. L. & Sawicki, M. 2004, ApJ, 603, 414
- Mas-Hesse et al. (2007) Mas-Hesse, J.M., Kunth, D., Tenorio-Tagle, G., Leitherer, C., Terlevich, R. J. & Terlevich, E. 2007 astro-ph/0309396
- Nakamura (2003) Nakamura, K. 2003, J. Mod. Phys. A 18, 4053
- Neill et al. (2006) Neill, J. D., Sullivan, M., Balam, D., Pritchet, C. J., Howell, D. A., Perrett, K., Astier, P., Aubourg, E., Basa, S., Carlberg, R. G., Conley, A., Fabbro, S., Fouchez, D., Guy, J., Hook, I., Pain, R., Palanque-Delabrouille, N., Regnault, N., Rich, J., Taillet, R., Aldering, G., Antilogus, P., Arsenijevic, V., Balland, C., Baumont, S., Bronder, J., Ellis, R. S., Filiol, M., Gonçalves, A. C., Hardin, D., Kowalski, M., Lidman, C., Lusset, V., Mouchet, M., Mourao, A., Perlmutter, S., Ripoche, P., Schlegel, D., & Tao, C. 2006, AJ, 132, 1126
- Ofek et al. (2006) Ofek, E.O., Cameron, P. B., Kasliwal, M. M., Gal-Yam, A., Rau, A., Kulkarni, S. R., Frail, D. A., Chandra, P., Cenko, S. B., Soderberg, A. M., & Immler, S. 2006, astro-ph/0612408
- Oke et al. (1995) Oke, J. B., Cohen, J. G., Carr, M., Cromer, J., Dingizian, A., Harris, F. H., Labrecque, S., Lucinio, R., Schaal, W., Epps, H., & Miller, J. 1995, PASP, 107, 375
- Papovich et al. (2001) Papovich, C., Dickinson, M. & Ferguson, Henry C. 2001, ApJ, 559, 620
- Pastorello et al. (2002) Pastorello, A., Turatto, M., Benetti, S., Cappellaro, E., Danziger, I. J., Mazzali, P. A., Patat, F., Filippenko, A. V., Schlegel, D. J. & Matheson, T. 2002, MNRAS, 333 27
- Pettini et a. (2001) Pettini, M., Shapley, A. E., Steidel, C. C., Cuby, J-G., Dickinson, M., Moorwood, A. F. M., Adelberger, K. L., & Giavalisco, M. 2001, ApJ, 554, 981
- Richardson et al. (2002) Richardson, D., Branch, D., Casebeer, D., Millard, J., Thomas, R. C., & Baron, E. 2002, AJ, 123, 745
- Rigon et al. (2003) Rigon, L., Turatto, M., Benetti, S., Pastorello, A., Cappellaro, E., Aretxaga, I., Vega, O., Chavushyan, V., Patat, F., Danziger, I. J. & Salvo, M. 2003, MNRAS, 340, 191
- Salamanca et al. (2002) Salamanca, I., Terlevich, R. J. & Tenorio-Tagle, G. S. 2002, MNRAS, 330, 844
- Salpeter (1955) Salpeter, E. E. 1955, ApJ, 121, 161
- Sawicki & Thompson (2005) Sawicki, M., & Thompson, D. 2005, ApJ, 635, 100
- Sawicki & Yee (1998) Sawicki, M., & Yee, H. K. C. 1998, AJ, 115, 1329
- Scannapieco & Bildsten (2005) Scannapieco, E. & Bildsten, L. 2005 ApJ, 629L, 85
- Schlegel (1990) Schlegel, E. M. 1990, MNRAS, 244, 269
- Schlegel et al. (1999) Schlegel, E. M., Ryder, S., Staveley-Smith, L., Petre, R., Colbert, E., Dopita, M. & Campbell-Wilson, D. 1999, AJ, 118, 2689
- Shankar & Mathur (2007) Shankar, F. & Mathur, S. 2007, ApJ, 660, 1051
- Shapley et al. (2001) Shapley, A. E., Steidel, C. C., Adelberger, K. L., Dickinson, M., Giavalisco, M. & Pettini, M. 2001, ApJ, 562, 95
- Shapley et al. (2003) Shapley, A. E., Steidel, C. C., Pettini, M. & Adelberger, K. L. 2003, ApJ, 588, 65
- Steidel et al. (1996) Steidel, C. C., Giavalisco, M., Pettini, M., Dickinson, M., & Adelberger, K. L. 1996, ApJ, 462L, 17
- Steidel et al. (2003) Steidel, C. C., Adelberger, K. L., Shapley, A. E., Pettini, M., Dickinson, M., & Giavalisco, M. 2003, ApJ, 592, 728
- Steidel et al. (2004) Steidel, C. C., Shapley, A. E., Pettini, M., Adelberger, K. L., Erb, D. K., Reddy, N. A., & Hunt, M. P. 2004, ApJ, 604, 534
- Strigari et al. (2004) Strigari, L. E., Kaplinghat, M., Steigman, G. & Walker, T. P. 2004, JCAP, 03, 007
- Sullivan et al. (2006) Sullivan, M., Le Borgne, D., Pritchet, C. J., Hodsman, A., Neill, J. D., Howell, D. A., Carlberg, R. G., Astier, P., Aubourg, E., Balam, D., Basa, S., Conley, A., Fabbro, S., Fouchez, D., Guy, J., Hook, I., Pain, R., Palanque-Delabrouille, N., Perrett, K., Regnault, N., Rich, J., Taillet, R., Baumont, S., Bronder, J., Ellis, R. S., Filiol, M., Lusset, V., Perlmutter, S., Ripoche, P. & Tao, C. 2006, ApJ, 648, 868
- Sullivan (2007) Sullivan, M., 2007, private communication.
- Tapken et al. (2007) Tapken, C., Appenzeller, I., Noll, S., Richling, S., Heidt, J., Meinkoehn, E. & Mehlert, D. astro-ph/0702414
- Turatto et al. (1993) Turatto, M., Cappellaro, E., Danziger, I. J., Benetti, S., Gouiffes, C. & della Valle, M. 1993, MNRAS 262, 128
- Turatto et al. (2000) Turatto, M., Suzuki, T., Mazzali, P. A., Benetti, S., Cappellaro, E., Danziger, I. J., Nomoto, K., Nakamura, T., Young, T. R., & Patat, F. 2000, ApJ, 534, 57
- also see van Dyk et al. (2006) Van Dyk, S. D., Li, W., Filippenko, A. V., Humphreys, R. M., Chornock, R., Foley, R. & Challis, P. M. 2006, astro-ph/0603025
- Venemans, et al. (2007) Venemans, B. P., Röttgering, H. J. A., Miley, G. K., van Breugel, W. J. M., de Breuck, C., Kurk, J. D., Pentericci, L., Stanford, S. A., Overzier, R. A., Croft, S. & Ford, H. 2007, A & A, 461, 823
- Wolf et al. (2003) Wolf, C., Wisotzki, L., Borch, A., Dye, S., Kleinheinrich, M., & Meisenheimer, K. 2003, A&A, 408, 499