Linear response results for phonons and electron-phonon coupling in hcp Sc - spin fluctuations and implications for superconductivity
Abstract
We present a FP-LMTO (full potential linear muffin-tin orbitals) study of the variation in the electronic structure, phonon frequencies and electron-phonon coupling in hcp Sc under pressure. The electron-phonon coupling constant is found to increase steadily with pressure in the hcp phase, until the pressure reaches a value where the hcp phase becomes unstable. Linear response calculations for the normal pressure ratio predict a phase change somewhere between calculated pressures of 22 and 30 GPa. The calculated frequencies for the equilibrium hcp lattice parameters are in good agreement with the inelastic neutron scattering results. There is a small upward shift in the -point mode frequency under pressure, in qualitative agreement with the Raman spectroscopy study of Olijnyk et al. (J. Phys.:Condens. Matter,18, 10971 (2006)). From the measured value of the electronic specific heat constant and the calculated values of the Fermi level density of states and electron-phonon coupling constant, we conclude that the electron-paramagnon coupling constant in hcp Sc should be comparable to the electron-phonon coupling constant. This indicates that the spin fluctuation effects are strong enough to suppress superconductivity completely in hcp Sc. We argue that spin fluctuations should be reduced by a factor of two or more in the high pressure Sc-II phase. Based on estimates of the electron-paramagnon coupling constants and the calculated or estimated electron-phonon coupling constants, we argue that the hcp phase may become superconducting with a very low transition temperature immediately prior to the transition to the Sc-II phase and that the Sc-II phase should indeed be superconducting. The electronic, electron-phonon and spin fluctuation properties in hcp Sc under pressure are compared with those of the high pressure hcp phase of Fe, which was reported to be superconducting a few years back.
pacs:
74.25.Jb, 74.25.Kc, 74.70.Ad, 74.90.+nI Introduction
This work was motivated by a recent work of Hamlin and Schilling Schilling07 , who reported the measurement of the superconducting transition temperature in Sc as a function of pressure. Superconductivity in Sc is induced under pressure, with increasing monotonically to 8.2 K at 74.2 GPa. Hamlin and Schilling Schilling07 report measurements of between GPa (K) and 74.2 GPa ( K). The normal pressure phase of Sc is hcp and it is known to undergo several changes in its crystal structure as a function of pressure, the first such transition known to be occurring around 22-23 GPa Fujihisa05 ; Akahama05 ; McMahon06 from hcp (Sc-I) to a complicated structure, referred to as Sc-II. To date the normal and low pressure hcp phase is known to be non-superconducting. Earlier work by Wittig et al. Wittig79 showed that superconductivity is possibly induced in the hcp phase at high pressure around 20 GPa, immediately before it enters the complex Sc-II phase. in the hcp phase was estimated to be less than 0.1 K.
Ab initio theoretical studies of superconductivity in Sc as a function of pressure is rendered difficult by the fact that the superconducting Sc-II phase is not only complex, but also that its exact structure still remains open to investigation and refinement Fujihisa05 ; Akahama05 ; McMahon06 . Ormeci et al. Ormeci06 have studied the electronic structure of the Sc-II phase proposed by Fujihisa et al. Fujihisa05 and McMahon et al. McMahon06 and produced results suggesting that the structure proposed by McMahon et al. might provide a better representation of the Sc-II phase. Both of these proposed structures are composite incommensurate structures, consisting of host and guest substructures.
In this communication we present ab initio calculations of the electronic structure, elastic properties, phonons and electron-phonon coupling in the low pressure hcp phase of Sc. The purpose is to shed some light on why hcp Sc is not superconducting, while the substance might become superconducting under pressure. Several scenarios are possible. It might be that the electron-phonon coupling in the hcp phase is small, making superconductivity unlikely in this phase. This coupling may increase with pressure, but still remain too small for superconductivity to appear over the entire pressure range for which the hcp phase is stable. Another possibility is that the electron-phonon coupling is strong enough to support superconductivity in the hcp phase. In this latter scenario one needs to explore why superconductivity is suppressed in the hcp phase and appears only in the high pressure Sc-II phase. Calculations of the phonon frequencies as a function of pressure should also show softening of certain modes leading to the instability of the hcp phase at high pressure.
We use the full potential linear muffin-tin orbital (FP-LMTO) method savrasov-el to study the electronic structure and the linear response scheme developed by Savrasov savrasov1 ; savrasov2 to compute the phonon-frequencies, the Eliashberg spectral function and the electron-phonon coupling constant as a function of volume in hcp Sc. For the sake of simplicity and convenience in the calculation, the ratio is kept fixed at the normal pressure value Kittel . This restriction of the ratio being kept fixed at the normal pressure value should not be of any concern from the viewpoint of the main results and conclusions of this work. This will become clear from the discussion in the following sections.
Sc is the lightest of the - transition metals. It would be of interest to see how the electron-phonon coupling in hcp Sc compares with that of the late transition metal hcp Fe, which was reported to be superconducting by Shimizu et al. nature1 (see also Ref.jaccard, ) a few years back. The hcp phase is the stable phase of Fe at pressures 10 GPa and higher. Bose et al. Bose03 reported FP-LMTO linear-response results for hcp Fe. They showed, in agreement with earlier LAPW(linear augmented plane-wave)-based rigid muffin-tin (RMT) results of Mazin and coworkers mazin1 , that not only should hcp Fe be superconducting, but also conventional (electron-phonon) -wave superconductivity in hcp Fe should persist up to a much higher pressure than what is found in the experiments. Both ferromagnetic and antiferromagnetic spin fluctuation effects were considered in the works of Bose et al. Bose03 and Mazin et al. mazin1 The conclusion was that such spin fluctuation effects in hcp Fe could lower somewhat, but could not account for the rapid disappearance of with increasing pressure, as observed by Shimizu et al. nature1 Nontrivial differences between the electronic structures of Fe and Sc, due in particular to the large difference in the number of -electrons, cause significant differences in their elastic as well as electron-phonon scattering properties, which should have opposite effects on the overall electron-phonon coupling constant.
Ormeci et al. Ormeci06 have used crystalline approximants of the incommensurate structures proposed by Fujihisa et al. Fujihisa05 and McMahon et al. McMahon06 in studying the electronic structure of the Sc-II phase. The unit cells of these approximants contain 22 atoms for the model proposed by Fujihisa et al. Fujihisa05 and 42 atoms for the model suggested by McMahon et al. McMahon06 . Because of the high computational demand due to the large number of atoms in the unit cells of these approximants, we are unable to extend the linear response calculations of phonons and electron-phonon coupling to the Sc-II phase.
II Electronic structure
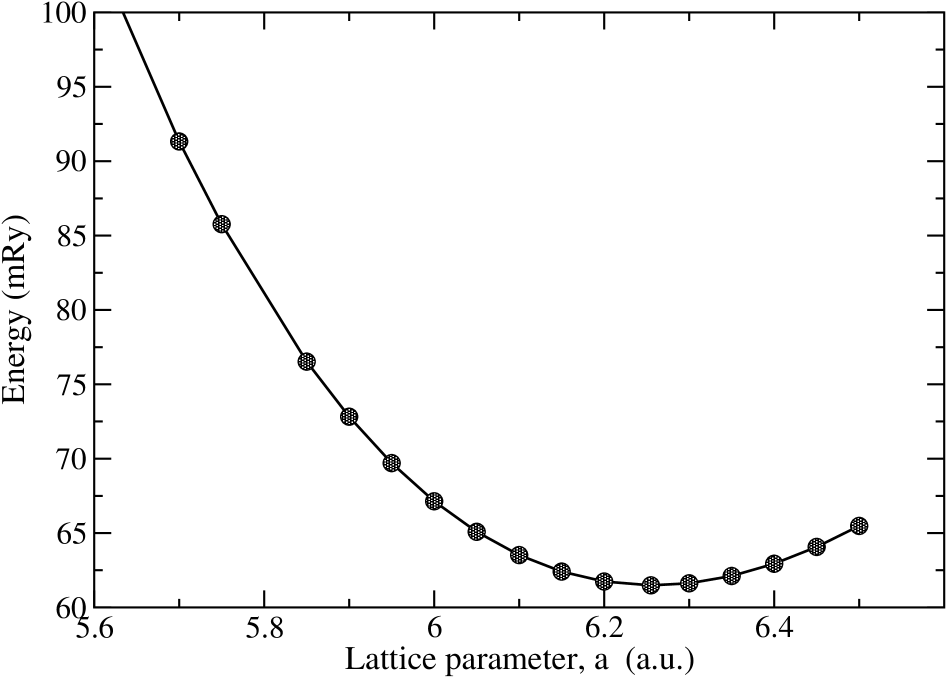
FP-LMTO results of total energy as a function of the lattice parameter in hcp Sc is shown in Fig.1. The ratio was kept fixed at the normal pressure value Kittel . As in the earlier calculation for hcp Fe Bose03 , the generalized gradient approximation of Perdew and Wang (GGA1)PW1 for the exchange-correlation potential was used. The electronic structure was computed using a two- LMTO basis for the valence band. 3- and 3-semi-core states were treated as valence states in separate energy windows. The charge densities and potentials were represented by spherical harmonics with inside the non-overlapping MT spheres and by plane waves with energies 48-70 Ry, depending on the lattice parameter, in the interstitial region. Brillouin zone (BZ) integrations were performed with the full-cell tetrahedron method peter , using 1200 k-points in the irreducible zone. The pressure and bulk modulus calculated from this energy-volume curve, using the generalized Birch-Murnaghan equation of state birch ; murnaghan , are shown in Table 1. Note that the minimum energy occurs almost exactly at the normal pressure lattice parameter of 6.255 a.u. The calculated bulk modulus of 56 GPa at this Kittel equilibrium lattice parameter is somewhat higher than the experimental value, 43.5 GPa. One interesting observation is that the lattice parameter 5.75 a.u., or the volume per atom a.u., corresponds to a pressure of 22 GPa. This is the pressure at which the hcp Sc-I phase becomes unstable against the formation of a complicated structure known as the Sc-II phase Fujihisa05 ; Akahama05 ; McMahon06 . As will be discussed later, the linear response results show that the phonon frequencies calculated for lattice parameter 5.6 a.u. are imaginary. Thus, for the normal pressure ratio, the hcp structure becomes unstable at some lattice parameter between 5.75 and 5.6 a.u. The calculated pressure at 5.6 a.u. is 30 GPa. Given the uncertainties in the pressure calculation, this result is in good agreement with the experimental observation of a phase change in Sc at 22-23 GPa. Additional linear response calculations to better locate the phase change were not done.
| a | 6.255 | 6.15 | 6.05 | 5.95 | 5.85 | 5.75 |
|---|---|---|---|---|---|---|
| 168.72 | 160.37 | 152.67 | 145.22 | 138.02 | 131.07 | |
| -0.084 | 3.21 | 6.85 | 11.22 | 16.20 | 22.28 | |
| 56.2 | 67.2 | 79.6 | 93.0 | 108 | 125 | |
| 58.06 | 54.82 | 51.59 | 49.07 | 47.27 | 47.71 |
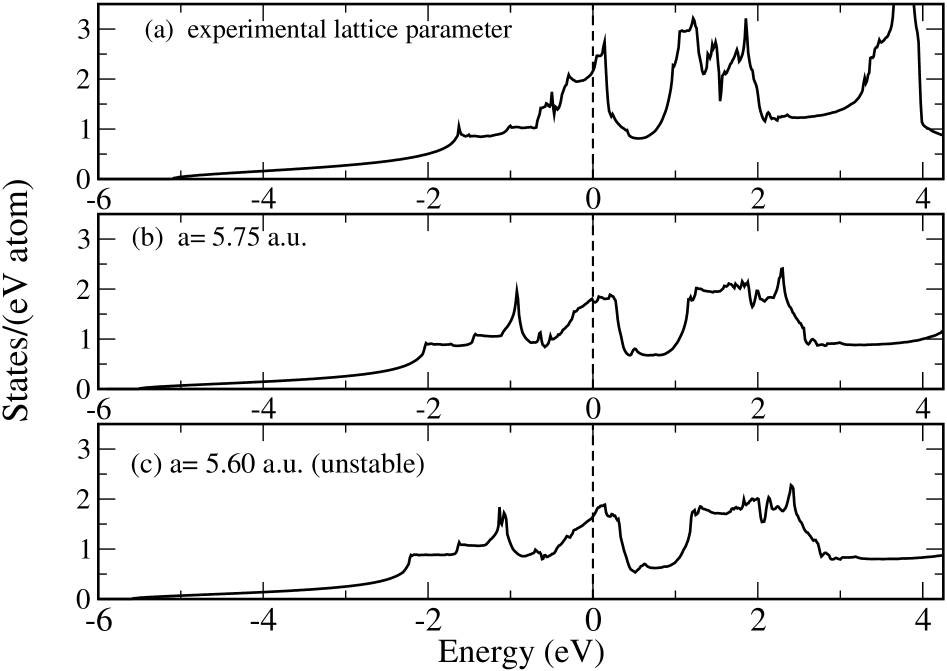
The FP-LMTO DOS calculated for three lattice parameters are shown in Fig.2. Panel (a) shows the DOS for the experimental normal pressure lattice parameters: Å, ÅKittel . Panels (b) and (c) show the DOSs for the lattice parameters 5.75 a.u. and 5.60 a.u., respectively, with the same ratio as in (a). For the equilibrium lattice parameters (panel (a)), the Fermi level falls in a shallow valley between two small peaks. With increasing pressure, the bands broaden, flattening these peaks and the valley region (panel (b)). It appears that as this region around the Fermi level changes to a shoulder (panel (c)), the hcp phase becomes unstable.
Hamlin and Schilling Schilling07 discuss the importance of the role of charge transfer in the variation of electron-phonon coupling and the changes in the crystal structure under pressure. Pettifor Pettifor77 has discussed the variation of the -band occupancy under pressure of - transition metals, showing that the increase in the -electron occupancy of the early transition metals under pressure is rapid. Duthie and Pettifor Pett-Duth77 used a band model to discuss the correlation between the -band occupancy and the crystal structures in rare earths. They showed that -electron concentration increases under pressure and a sequence of crystal structure changes takes place as changes from 1.5 to 2.5. With increasing pressure, the volume available to the electrons outside the ion cores diminishes rapidly. As a result, simple metals like Li and Na are known to become non-free-electron-like under pressure and Cs is known to become a transition metal as the -band begins to fill due to charge transfer (see references in [Schilling07, ]). In any electronic structure calculation the numbers of -, - and - electrons are essentially functions of the basis set used, if such a division is at all possible for the method used. It is easier to keep track of charge transfer in LMTO-ASA (atomic sphere approximation) varenna , where the basis consists of muffin-tin orbitals only, rather than in FP-LMTO. In Table 2 we present the orbital- or partial wave channel-resolved electron numbers as a function of the lattice parameter, as obtained by the LMTO-ASA method footnote . The results presented were obtained by using the exchange correlation potential of Perdew and Wang PW92 in the local density approximation. Checks for a couple of lattice parameters using GGA1 PW1 had revealed similar results. The decrease in and the increase in are monotonic as a function of decreasing lattice parameter. In fact, charge transfer takes place from the extended - and -orbitals to the less extended or localized - and -orbitals. Of particular interest are and , defined as and , quantifying the transfer of electrons from the delocalized to the localized channels. At normal pressure the electrons are divided almost equally between the localized and delocalized channel (). With increasing pressure the electrons more and more occupy the localized orbitals.
| a | 6.255 | 6.15 | 6.05 | 5.95 | 5.85 | 5.75 |
|---|---|---|---|---|---|---|
| 0.730 | 0.720 | 0.714 | 0.704 | 0.695 | 0.685 | |
| 0.690 | 0.677 | 0.662 | 0.645 | 0.626 | 0.603 | |
| 1.545 | 1.567 | 1.589 | 1.614 | 1.641 | 1.672 | |
| 0.031 | 0.033 | 0.034 | 0.036 | 0.037 | 0.039 | |
| 0.156 | 0.203 | 0.247 | 0.301 | 0.357 | 0.423 | |
| 1.11 | 1.15 | 1.18 | 1.22 | 1.27 | 1.33 | |
| 57.89 | 54.78 | 53.03 | 51.60 | 50.16 | 53.34 | |
| 0.941 | 0.946 | 0.964 | 0.982 | 1.020 | 1.226 | |
| 14.836 | 13.729 | 12.889 | 12.257 | 11.914 | 13.558 | |
| 40.789 | 39.110 | 37.887 | 37.080 | 36.444 | 37.222 | |
| 1.326 | 1.301 | 1.287 | 1.280 | 1.280 | 1.335 | |
| 2.67 | 2.75 | 2.83 | 2.90 | 2.92 | 2.60 |
As the pressure increases different partial bands broaden at different rates. In Table 2 we also show the changes in partial or angular momentum-resolved DOSs at the Fermi level. The ratio of the localized orbital DOSs (+ ) to the delocalized orbital DOSs (+) seem to increase steadily under pressure, except for the lowest lattice parameter shown. The decrease in for the lattice parameter 5.75 a.u. could be specific to LMTO-ASA, as the somewhat large change in between the lattice parameters 5.85 and 5.75 a.u. is not observed in the FP-LMTO results (Table 1).
Ormeci et al. Ormeci06 have calculated the partial charges in the high pressure Sc-II phase. They use the full-potential local-orbital (FPLO) method of Koepernik and EschrigEschrig with an -basis. At ambient pressure, in the hcp structure, their -projected charges for the , , and channels are 0.70, 0.59 and 1.70, respectively. In the Sc-II phase at about two thirds of the ambient pressure volume per atom, these numbers become 0.54-0.65, 0.27-0.51, and 1.92-2.05, respectively. Their calculations also suggest that a complete charge transfer would require pressures in excess of 240 GPa.
III Phonons and electron-phonon coupling
The FP-LMTO linear response results for phonons and electron-phonon coupling are summarized in Table 3. The dynamical matrix was generated for 32 phonon wave vectors in the irreducible BZ, corresponding to a mesh of (7,7,7) reciprocal lattice divisions. The BZ sums for the dynamical and electron-phonon (Hopfield) matrices was done for a (28,28,28) mesh, resulting in 1200 wave vectors in the IBZ. These choices were based on extensive tests performed by Savrasov and Savrasovsavrasov1 ; savrasov2 in their study of the phonons and electron-phonon coupling in elemental metals and alloys. Phonon density of states , Eliashberg spectral function and the function are shown in Fig. 3 for three different lattice parameters with the ratio fixed at the normal pressure value.
The calculated phonon frequencies appear to be in reasonably good agreement with the inelastic neutron scattering (INS) resultsWakabayashi71 ; Reichardt . For the normal pressure lattice parameter (6.255 a.u.), the calculated longitudinal and transverse optic (LO and TO) mode frequencies at the -point are 6.273 THz (209 cm-1) and 3.912 THz (130.5 cm-1), respectively. These compare well with the inelastic neutron scattering results of Wakabayashi et al. Wakabayashi71 : 6.91 and 4.04 THz for the LO and TO modes, respectively. The recent Raman spectroscopy study of Olijnyk et al. Olijnyk06 puts the TO mode () frequency at a somewhat higher value of 139 cm-1. On the whole, the calculated frequencies are a bit lower than the INS results of Wakabayashi et al. Wakabayashi71 These authors have analyzed the INS results in terms of a sixth-neighbor modified axially symmetric force constant model and produce a frequency distribution, which reveals a maximum frequency of about 7.25 THz or 241.8 cm-1, approximately 10% higher than the maximum calculated frequency 215 cm-1 (Table 3) in this work. The shape of the frequency distribution agrees in general with the phonon DOS shown in Fig. 3, except for the relative heights of some of the low frequency peaks.
The Raman spectroscopy work by Olijnyk et al. Olijnyk06 shows a shift of the frequency under pressure from 139 cm-1 to about 150 cm-1 at 18.8 GPa. The calculated -point TO mode frequency increases from 130.5 cm-1 at the normal pressure lattice parameter (= 6.255 a.u.) to 135.1 cm-1 at 5.75 a.u., i.e., the increase is much more subdued. In Table 3 we have presented the calculated frequency for various lattice parameters. Although the variation may seem non-monotonic, the differences are very much within the error bars of the calculation. What can perhaps be concluded is that there is no phonon-softening and most probably this frequency does increase by approximately 5 cm-1. This is about 45-50% of the observed shift. Note that calculations for the stable hcp phase for a lattice parameter between 5.75 and 5.6 a.u. might reveal a higher shift. The discrepancy between the calculated and the observed shift could be partly due to the possible variation in the ratio under pressure, which has not been considered in the calculation. Olijnyk et al. Olijnyk06 have analyzed the shift in the frequency in terms of the relation
| (1) |
where is the atomic mass and is the elastic shear modulus. They relate their result to the behavior of the shear modulus at the transition. The possible variation of the ratio with pressure should be factored in in this discussion. The coarse wave vector mesh used for the phonon frequency calculation prevents us from using the slope of the phonon dispersion curves or the long wavelength method to compute the elastic constants. Ab initio calculation of the elastic constants, including , via long wavelength and homogeneous deformation methods using energy-minimized ratios will be the subject of a separate publication.
It is noteworthy that both calculation and the Raman study show a positive shift of the frequency, in contrast to the behavior in Y and the regular Lanthanides, where a softening of the mode under pressure is associated with the transition to the high-pressure Sm-type structure Olijnyk94 ; Olijnyk05 . Incidentally, in our linear response calculation, as the lattice parameter is lowered to 5.6 a.u. where the instability of the hcp phase is manifest via appearance of some imaginary frequencies, the mode frequency stays real and has a lower value 124 cm-1. At a lattice parameter of 5.2 a.u., this frequency, along with many others, are imaginary.
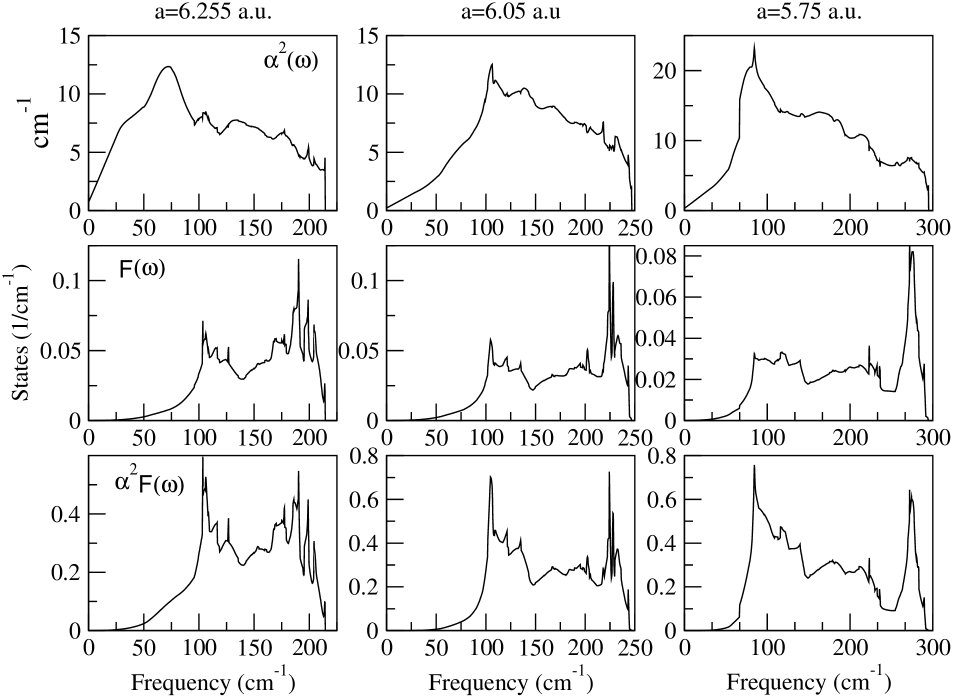
Broadening of the phonon bands and the increase in the maximum phonon frequencies with pressure is apparent in Fig. 3. Maximum phonon frequency increases from 215 cm-1 to 295 cm-1, as the lattice parameter changes from the normal pressure value to 5.75 a.u., where the estimated pressure (Table 1) is 22-23 GPa. Note that with increasing pressure, initial increases in , and are followed by a decrease, revealing phonon softening. At normal pressure, the shape of the function follows that of the phonon DOS . With increasing pressure, differences between the shape of the two functions appear due to increased contribution from low frequency phonons, a consequence of phonon softening. There is a feed-back effect: electron-phonon coupling leads to both phonon linewidth and renormalization of the phonon frequency, and the latter, in turn, affects the coupling constant. Unfortunately, the 7,7,7 division of the BZ misses most of the symmetry points. However, it appears that there are several regions of the wave vector space that show large mode coupling. Linear response calculations for the lattice parameter 5.6 a.u. show that the phonon frequency at the wave vector closest to the L-point for the 7,7,7 division becomes imaginary first. For the lattice parameter 5.75 a.u., this wave vector has a very large mode coupling constant. In Table 3, it is clear that general phonon softening starts as the lattice parameter increases beyond 6.05 a.u. (as seen from ) or 5.85 a.u. (as seen from and ), while the mode continues to stiffen and the maximum phonon frequency continues to increase.
The electron-phonon coupling parameter is a combination of an electronic parameter (Hopfield parameter) ( being the Fermi level DOS for one type of spin) and the mean square phonon frequency : . is the Fermi surface average of the square of the electron-phonon matrix element. The electronic and phonon-related parameters act in opposite directions in affecting the coupling constant: is enhanced by having higher at lower frequency. As the Hopfield parameter for transition metals has often been calculated using the rigid muffin-tin approximation of Gaspari and Gyorffy RMT , in Table 3 we have compared the values obtained via the FP-LMTO linear response method () and those obtained by using the RMT scheme implemented within the LMTO-ASA method glotzel ; skriver , known as the rigid atomic sphere (RAS) method. The latter values, labeled as , are in general agreement with the FP-LMTO results, but are somewhat overestimated, with the level of the overestimation increasing with pressure. This is in contrast with the results for the late transition metal hcp Fe, where RAS was shown to consistently underestimate the Hopfield parameter, with the level of the underestimation increasing with pressure Bose03 . The values of the Fermi surface averaged electron-phonon matrix element , obtained from the linear response calculation and by using the RMT approximation, are also shown in Table 3.
| 6.255 | 6.15 | 6.05 | 5.85 | 5.75 | ||
| Ry/bohr2 | 0.0381 | 0.0433 | 0.0519 | 0.0666 | 0.0771 | |
| (Ry/bohr)2 | 0.0026 | 0.0031 | 0.0040 | 0.0056 | 0.0065 | |
| (RMT/RAS) | Ry/bohr2 | 0.0439 | 0.0509 | 0.0591 | 0.0826 | 0.1077 |
| (RMT/RAS) | (Ry/bohr)2 | 0.0030 | 0.0037 | 0.0045 | 0.0065 | 0.0081 |
| K | 160.4 | 195.0 | 198.1 | 195.4 | 177.7 | |
| cm-1 | 111.5 | 135.5 | 137.7 | 135.8 | 123.5 | |
| cm-1 | 214.5 | 230.4 | 246.9 | 279.6 | 294.7 | |
| cm-1 | 130.5 | 134.95 | 133.4 | 136.14 | 135.0 | |
| cm-1 | 122.4 | 142.3 | 145.1 | 145.6 | 135.3 | |
| cm-1 | 131.5 | 148.6 | 152.3 | 155.8 | 148.1 | |
| 0.253 | 0.256 | 0.260 | 0.266 | 0.269 | ||
| 0.160 | 0.161 | 0.163 | 0.165 | 0.166 | ||
| 0.639 | 0.576 | 0.657 | 0.807 | 1.033 | ||
| K | 2.34 | 1.66 | 2.96 | 5.66 | 9.18 | |
| K | 2.17 | 1.75 | 3.13 | 6.00 | 9.64 |
IV Superconductivity in hcp Sc, based purely on electron-phonon coupling
Since ab initio results of the electron-phonon coupling in hcp Sc have not been reported in the literature, it would be of some interest to derive values of the superconducting transition temperature based on the present calculations. Indeed, the values of the coupling constant listed in Table 3 suggest that could be high enough to be experimentally observable. The superconducting transition temperature can be obtained by solving the linearized isotropic Eliashberg equation at (see, e.g., Ref. allen-mitro, ):
| (2) | |||||
where is a Matsubara frequency, is an order parameter and is a renormalization factor. Interactions and contain a phonon contribution , a contribution from spin fluctuations , and effects of scattering from impurities. With scattering rates and referring to magnetic and nonmagnetic impurities, respectively, the expressions for the interaction terms are :
| (3) | |||||
and
| (4) | |||||
The phonon contribution is given by
| (5) |
where is the Eliashberg spectral function, defined as
| (6) |
Here, is the electron-phonon matrix element, with being the phonon polarization index and representing electron wave vectors with band indices , and , respectively. is the electron-phonon coupling parameter, the values of which are given in Table 3. The contribution connected with spin fluctuation can be written as
| (7) |
where is the spectral function of spin fluctuations, related to the imaginary part of the transversal spin susceptibility as
where denotes Fermi surface average. is often referred to as the electron-paramagnon coupling constant.
In Eq.(4), is the screened Coulomb interaction,
| (8) |
with being the Fermi surface average of the Coulomb interaction. E is a characteristic electron energy, usually chosen as the Fermi energy and is a cut-off frequency, usually chosen ten times the maximum phonon frequency: .
For a start, we ignore all consideration of spin fluctuations and impurity scattering and solve the Eliashberg equation with only the electron-phonon term and the Coulomb pseudopotential . As is often done, we assume that a reasonable value for is , and from the calculated Fermi energies we obtain for all volumes, with the cut-off frequency assumed to be ten times the maximum phonon frequency. The values are listed in Table 3. As shown in this table, the superconducting transition temperature in hcp Sc based on consideration of electron-phonon coupling alone can be significant, increasing monotonically with pressure from 2K to K until the instability of the hcp phase sets in. Interestingly, the values reported by Hamlin and Schilling Schilling07 for the high pressure Sc-II phase fall in this range, while no superconducting behavior has been observed in the hcp phase.
For pedagogical reasons, we have listed in Table3 the values of obtained by using the Allen-Dynes formallen-mitro of the McMillan expression:
| (9) |
where is the logarithmically averaged phonon frequencyallen-mitro , obtained from our linear response calculations and reported in Table 3. Note that the Coulomb pseudopotential appearing in the McMillan equation above is related to appearing in the Eliashberg equation viaallen-mitro
| (10) |
Our results are computed with . The values obtained by solving the Eliashberg equations and those from the McMillan expression Eq.(9) show excellent agreement. Earlier, calculations for hcp Fe Bose03 had shown the McMillan expression to overestimate with respect to the results from the Eliashberg equation, while for fcc and bct boron an opposite trend was revealed Bose05 .
V Spin fluctuation effects
V.1 hcp Sc at normal pressure
Faced with the results of the previous section, one needs to produce convincing arguments as to why hcp Sc is not superconducting despite sufficiently strong electron-phonon coupling. A mechanism that is known to cause suppression of superconductivity is spin fluctuations, which is often quoted as the reason why fcc Pd is not superconductingBerk-Schrieffer . It is argued that the high value of in fcc Pd leads to considerable Stoner enhancement of paramagnetic spin susceptibility, making it a borderline ferromagnetic material, and spin fluctuations tending to ferromagnetic alignment of spins lead to the breaking of the Cooper pairs. That such a mechanism is operative in hcp Sc as well is highly probable and has been discussed in the literature on a few occasionsCapellmann ; Das . Jensen and MaitaJensen-Maita argue that the spin fluctuation effects are responsible for the rapid depression of in the Zr-Sc alloy system, as Sc is added. Ab initio calculations of the spin susceptibility of hcp Sc at equilibrium volume based on the spin-density functional theory by MacDonald et al. MacDonald77 yield an exchange-correlation enhancement factor of 4.03 over the band value and 17.2 over the free-electron value at the same average electron density as in hcp Sc. An earlier calculation by DasDas puts the Stoner enhancement factor at 4.6 (over the band value). The value calculated for fcc Pd by JanakJanak is 4.46. This shows that the spin fluctuations in hcp Sc should be as strong as in fcc Pd.
For a proper theoretical treatment of the spin fluctuation effects one needs to compute from the spin susceptibility function given by Eq.(7). However, it is important to note that such treatments tacitly assume a Migdal-like theorem being applicable to spin fluctuations. The Eliashberg equations (Eq.(2)) are based on the assumption that the maximum or the cut-off energy of spin fluctuation is much smaller than the characteristic electronic energy, e.g. the Fermi level. A somewhat qualitative treatment of spin fluctuations can be based on estimating from experiments. Both electron-phonon and the electron-paramagnon interactions contribute to the electronic specific heat. In an independent one-electron picture this is interpreted as the electronic mass enhancement or equivalently, enhancement of the density of states over the bare value . The latter is the value given by calculations, where these interactions are not included in the one-electron Hamiltonian. Thus, a reliable estimate of the electron-paramagnon coupling constant can be obtained from the measured value of the temperature co-efficient of the electronic specific heat , and the calculated values of the bare electron density of states and the electron-phonon coupling constant :
| (11) | |||||
| (12) | |||||
| (13) |
Here, and refer to the values per atom. The Coulomb interactions are included in an average sense in the density functional calculations of , and have therefore been left out of Eq. (12).
Among all the elemental metals, excluding the rare-earths, Sc has the largest electronic specific heat constant , followed by Y and PdGschneidner . The reported experimental values at normal pressure are 10.9-10.33 mJ/mole K2Jensen-Maita ; Gschneidner ; Tsang ; Reichardt ; Flotow ; Swenson . Considering the latest and the most conservative value of 10.33 mJ/mole K2Tsang ; Reichardt , we get = 2.2 states/(eV atom spin). With the calculated value of 1.067 states/(eV atom spin), we get = 1.063. The calculated value of 0.639 then yields 0.422. Effects of spin fluctuations on can be incorporated by a simple rescaling of and the Coulomb pseudopotential : , Mitrovic . An extension of the McMillan formulamazin1 that is often used to incorporate the spin fluctuation effects is
| (14) |
This formula is meaningful as long as is sufficiently less than , so that the denominator in the argument of the exponential in Eq. (14) stays positive and not close to zero. For the above values of , and the Coulomb pseudopotential =0.16 (see Table 3), this condition breaks down. In fact, for comparable values of and , the Kernel of the Eliashberg equation (Eq. (2)) , given by Eq.(4), becomes negative, allowing no solution for . It should be emphasized that the McMillan-type formulas in the presence of spin fluctuations are good for rough ball-park estimates of only.
Note that our calculated value of for normal pressure hcp Sc is significantly higher than the value that has been suggested by Knapp and JonesKnapp , based on a comparison of the high and low temperature electronic specific heats. A value of would suggest , more than twice larger than . Our results suggest that , but their values are close. This leads to the possibility that if spin fluctuations can be suppressed via application of pressure, superconductivity can indeed appear.
Based on the analysis of high and low temperature specific heats, Knapp and JonesKnapp also suggested that for Pd . The electronic specific heat constant for Pd is only slightly lower than that in hcp ScGschneidner ; Knapp , lying between 10.0 and 9.2 mJ/mole K2. The calculated bare band density of states for fcc Pd is about 1.3 states/(eV atom spin), giving in the range 0.66 and 0.5. An analysis by Savrasov and Savrasovsavrasov2 puts the value at 0.69. The value suggested by Knapp and Jones would leave no room for spin fluctuation effects in Pd, and would render Pd superconducting. The FP-LMTO linear response calculation for fcc Pd by Savrasov and Savrasovsavrasov2 yields , giving in the range 0.3-0.15. These values of and can adequately explain the nonexistence of superconductivity in fcc Pd. We have repeated the linear response calculation for fcc Pd and obtain a value of , in close agreement with the result of Savrasov and Savrasovsavrasov2 . Note that the calculation by Pinski and ButlerPinski based on the RMT approximation yields for fcc Pd, in reasonable agreement with the FP-LMTO linear response results. To summarize, our linear response calculations and electronic specific heat analysis show that in both hcp Sc and fcc Pd the values of electron-phonon and electron-paramagnon coupling constants are comparable, with the latter being slightly lower. This is qualitatively different from the previous results of Knapp and JonesKnapp , which would suggest that in Sc is significantly lower than , and vice versa for fcc Pd. Note that according to our results both and are larger in hcp Sc than the corresponding quantities in fcc Pd.
While the nature of spin fluctuations in fcc Pd is accepted to be ferromagnetic, that in hcp Sc could be antiferromagnetic. The dynamic susceptibility in Pd has a peak at , whereas in hcp Sc is expected to have a peak at some finite wave vector . First-principles calculation of including spin-orbit coupling and all other relativistic effects by Thakor et al. Thakor yields a peak at the wave vector , consistent with a Fermi surface nesting vector. Earlier calculations produce a peak along the same direction but at different valuesRath ; Liu of . CapellmannCapellmann has discussed the effect of incipient antiferromagnetism in Sc and shown that the antiferromagnetic spin fluctuations should lead to a repulsive electron-electron interaction, resulting in suppression of superconductivity. The modified McMillan formula (Eq.(14)) has been used to estimate for both ferromagnetic and antiferromagnetic spin fluctuationsmazin1 ; Bose03 .
V.2 Superconductivity in hcp Sc at high pressure immediately before the transition to Sc-II phase
Our linear response calculation yields a high value of the electron-phonon coupling constant at high pressure hcp phase prior to the transition to the complex Sc-II structure. It is natural to ask whether spin fluctuations should be able to suppress superconductivity despite such strong electron-phonon coupling. Since specific heat data are not available for such high pressures, a reliable estimate of is difficult. However, a reasonable step might be to scale the ambient pressure according to the density of states at high pressure shown in Table 1. This gives for the smallest volume or the highest pressure calculation. With , and , as shown in Table 3, and using Eq.(14), we get = 0.14 K. As pointed out earlier, at comparable values of and , Eq.(14) may not be reliable, and one needs to solve the Eliashberg equation. However, our estimate of indicates that there is a possibility of hcp Sc turning superconducting just before the onset of the high pressure Sc-II phase. This is indeed what has been reported by Wittig et al. Wittig79 . Note that such a conclusion would not be tenable for smaller values of , as the results of Knapp and JonesKnapp would suggest.
The use of energy-optimized ratio at higher than ambient pressures may change the calculated values of somewhat, but such small changes are not expected to influence our results qualitatively and will not affect the nature of the conclusions.
V.3 Superconductivity in Sc-II phase
Spin fluctuations are expected to be significantly reduced in the Sc-II phase. According to the calculations of Ormeci et al. Ormeci06 , the density of states at the Fermi level in the Sc-II structure should be about half the value in the ambient pressure hcp Sc. This suggests that should be reduced to a value of 0.2 or less. Reasonable choices of in the Sc-II phase at pressures 30 GPa (see Table 3) and should be 210.0 K and 0.166, respectively. A value of =0.95 in Eq.(14) would yield a =1.4 K. Reducing the value of to 0.1 would result in a of 4.5 K. These numbers suggest that superconductivity in the Sc-II phase can be explained based on the quantities calculated for the high pressure hcp Sc and reasonable estimates of the reduction in the spin fluctuation effects that is expected as a result of the change in the density of states. Note that phonon softening causes to increase in the hcp phase immediately before the transition to the Sc-II structure. At the start of the Sc-II phase the value of should be somewhat less than the value 1.033 shown in Table 3, hence the choice 0.95. It should be noted that although the density of states decreases with increasing pressure, there is a rapid increase in the electron-phonon matrix element with decreasing volume (see Table IV). A high value of in the Sc-II phase is thus possible despite the reduced value of . Chances are that at the start of the Sc-II phase both and are somewhat less than the values suggested here.
VI Comparison between hcp Sc and hcp Fe
The bulk moduli of all transition metals are known to increase (at least initially) as a function of band filling varenna2 , and the bulk moduli of the late transition metals are in general higher than those of the early ones. The bulk modulus of Fe is thus expected to be larger than that of Sc, a consequence of Fe having more -electrons. The calculations of Bose et al. Bose03 for the hcp phase of Fe show values in the range of 300 GPa to 970 GPa, corresponding to volumes per atom for which the calculated is above zero (the theoretical superconducting phase). These values are 4-5 times higher than the bulk modulus values of Sc shown in Table 1. Accordingly, the average phonon frequency in hcp Fe is about four times higher than in Sc. Because of a much larger number of -electrons in hcp Fe (6.5 on average) than Sc (1.6 on average), the electron-phonon matrix element in Fe is also much larger. As a result, despite the lower value of , the Hopfield parameter in hcp Fe turns out to be more than double that in Sc (compare Table 3 with TABLE II of Ref. [Bose03, ]). However, the dominating effect turns out to be the lower phonon frequencies in Sc, leading to higher values of .
Spin fluctuations, most probably of an antiferromagnetic natureBose03 ; mazin1 , are believed to be present in the high pressure hcp phase of Fe. Because the density of states in hcp Fe is about half that in hcp Sc, spin fluctuations in hcp Fe should be much weaker. There is no specific heat data available for hcp Fe, the stable phase of Fe at pressures of 10 GPa and higher. As a result, an experimental estimate of in hcp Fe is not available. Some theoretical estimates were provided in Refs. [Bose03, ; mazin1, ].
For a crude estimate of the ratio between the values of for hcp Fe and Sc, we can assume the Hopfield parameter to be simply proportional to the fractional -DOS, . For an estimate of , we can use the result proposed by Moruzzi, Janak and Schwarz MJS , relating the Debye temperature to the bulk modulus, atomic mass and the average Wigner-Seitz radius:
| (15) |
where is the average Wigner-Seitz radius in a.u. and is the bulk modulus in kbar. This result suggests that . Using values from Table 1 and TABLE I of [Bose03, ], the DOS values from Table 2, computed from a.u, for Fe and a.u., for Sc, we get . This compares favorably with the value 0.66, according to the computed linear response values (Table 3 and TABLE II of [Bose03, ]). We have used states/(Ry cell) and states/(Ry cell) (TABLE I of [Bose03, ]) for Fe. The proportionality of to fractional -DOS, , can be somewhat justified on the basis of the RMT result of Gaspari and Gyorffy RMT :
| (16) |
where is the Fermi level DOS per atom per spin and is a relative partial state density,
| (17) |
is the electron-phonon matrix element obtained from the gradient of the potential and the radial solutions and of the Schrödinger equation evaluated at the Fermi energy. Neglecting the matrix elements and all partial DOSs other than amounts to the result . Of course, this provides a very crude estimate and can only be relied on in deciding whether for one material is greater or lower than for the other and no quantitative reliability can be guaranteed. In fact, in getting the estimate we have ignored the possible differences in the - and - DOSs of the two solids. Consideration of these differences would lead to an inferior quantitative agreement. Also, the ratio for Fe to Sc for the volumes considered is 2.35 according to Eq.(15), while the value from the linear response calculation is 3.5.
VII Summary
FP-LMTO linear response calculations for the hcp phase of Sc, based on a fixed ratio of 1.592, shows a monotonic increase in electron-phonon coupling with pressure. Calculated phonon frequencies for the equilibrium lattice parameter are 6-10% lower than those obtained via INS experimentsWakabayashi71 . The agreement can perhaps be improved with calculations done on a finer wave vector mesh. The estimated pressure, based on the linear response results, for the instability to appear is 23-30 GPa. This pressure range, which can certainly be narrowed with additional calculations, agrees with the experimental observations. The -point frequency shows a modest increase with pressure, in qualitative agreement with the Raman work by Olijnyk et al. Olijnyk06 Energy-optimized choice of the ratio for each volume per atom may lead to a better agreement.
The electron-phonon coupling constant is found to increase steadily with pressure in the hcp phase, until the pressure reaches a value where the hcp phase becomes unstable. An estimate of the electron-paramagnon coupling constant based on the measured temperature coefficient of the electronic specific heat, calculated band density of states and suggests that the spin fluctuations at normal pressure should be strong enough to suppress superconductivity completely. At the highest pressures where the hcp phase is still stable, the increase in and a decrease in in proportion to the calculated band density of states suggest the possibility of a very low superconductivity, as noted by Wittig et al. Wittig79 A comparison of the band densities of states in the hcp and the Sc-II phases shows that the spin fluctuation effects in the Sc-II phase should be reduced by a factor of two or more. It is argued that this suppression of spin fluctuation combined with electron-phonon coupling constants of a magnitude similar to that calculated for the high pressure hcp phase can indeed account for the observed superconductivity in the Sc-II phase.
ACKNOWLEDGMENTS
This work was supported by a grant from the Natural Sciences and Engineering Research Council of Canada. The author acknowledges helpful discussions with B. Mitrović, J. Kortus and O. Jepsen.
References
- (1) J.J. Hamlin and J.S. Schilling, Phys. Rev. B76, 012505 (2007); see also Cond-mat/0703730v1, 27 Mar 2007.
- (2) J. Wittig, C. Probst, F.A. Schmidt, and K.A. Gschneidner, Jr., Phys. Rev. Lett.42, 469 (1979).
- (3) H. Fujihisa et al. , Phys. Rev. B 72, 132103 (2005).
- (4) Y. Akahama, H. Fujihisa, and H. Kawamura, Phys. Rev. Lett.94, 195503 (2005).
- (5) M.I. McMahon, L.F. Lundegaard, C. Hejny, S. Falconi, and R.J. Nelmes, Phys. Rev. B73,134102 (2006).
- (6) S.Yu. Savrasov, and D.Yu. Savrasov, Phys. Rev. B46, 12181 (1992).
- (7) S.Y. Savrasov, Phys. Rev. B54, 16470 (1996).
- (8) S.Y. Savrasov, and D.Y. Savrasov, Phys. Rev. B54, 16487 (1996).
- (9) C. Kittel, Introduction to Solid State Physics, John Wiley 1996, 7th Edn., p. 23.
- (10) K. Shimizu, T. Kimura, S. Furomoto, K. Takeda, K. Kontani, Y. Onuki, and K. Amaya, Nature (London), 412, 316 (2001); see also S.S. Saxena and P.B. Littlewood, Nature (London), 412, 290 (2001).
- (11) D. Jaccard, A. T. Holmes, G. Behr, Y. Inada, and Y. Onuki, Physics Letters A, Vol. 299 (2-3) (2002) pp. 282-286 cond-mat/0205557.
- (12) S.K. Bose, O.V. Dolgov, J. Kortus, O. Jepsen, and O.K. Andersen, Phys. Rev. B67, 214518 (2003).
- (13) I.I. Mazin, D.A. Papaconstantopoulos, M.J. Mehl, Phys. Rev. B65, 100511 (R) (2002).
- (14) J.P. Perdew, J.A. Chevary, S.H. Vosko, K.A. Jackson, M.R. Pederson, D.J. Singh, and C. Fiolhais, Phys. Rev. B46, 6671 (1992).
- (15) P.E. Blöchl et al., Phys. Rev. B49, 16223 (1994).
- (16) F. Birch, J. Geophys. Res. 457, 227 (1952).
- (17) F.D. Murnaghan, Proc. Nat. Acad. Sci. USA 30, 244 (1944).
- (18) D.G. Pettifor, J. Phys. F 7, 623 (1977).
- (19) J.C.Duthie and D.G. Pettifor, Phys. Rev. Lett.38, 564 (1977).
- (20) O.K. Andersen, O. Jepsen, and D. Glötzel, in Highlights of Condensed Matter Theory, edited by F. Bassani et al. (North-Holland, Amsterdam, 1985), p.59.
- (21) Inside each muffin-tin (atomic) sphere there is a small contribution from the tails of orbitals centered about the surrounding spheres. This may cause a disproportionate increase in the high -components, particularly . The increase in the with decreasing volume may be partly due to this effect.
- (22) J.P. Perdew and Y. Wang, Phys. Rev. B45, 13244 (1992).
- (23) A. Ormeci, K. Koepernik, and H. Rosner, Phys. Rev. B74, 104119 (2006).
- (24) K. Koepernik and H. Eschrig, Phys. Rev. B59, 1743 (1999).
- (25) N. Wakabayashi, S.K. Sinha, and F.H. Spedding, Phys. Rev. B4, 2398 (1971), see also Landöldt-Bernstein New Series 111/13a, Metals: Phonon and Electron States and Fermi Surfaces, eds. P.H. Dederichs, H. Schober, and D.J. Sellmyer, series eds. K.-H. Hellwege and J.L. Olsen, Springer-Verlag, 1981.
- (26) J. Pleschiutschnig, O. Blaschko, and W. Reichardt, Phys. Rev. B44, 6794 (1991).
- (27) H. Olijnyk, S. Nakamo, A.P. Jephcoat and K. Takemura, J. Phys. : Condens. Matter 18, 10971 (2006).
- (28) H. Olijnyk, High Pressure Res. 13, 99 (1994).
- (29) H. Olijnyk, J. Phys. : Condens. Matter 17, 43 (2005).
- (30) P.B. Allen and B. Mitrović, Solid State Physics, edited by H. Ehrenreich, F. Seitz, and D. Turnbull (Academic, New York 1982), vol. 37, p.1.
- (31) G.D. Gaspari and B.L. Gyorffy, Phys. Rev. Lett. 28, 801 (1972).
- (32) D. Glötzel, D. Rainer, and H.R. Schober, Z. Phys. B 35, 317 (1979).
- (33) H.L. Skriver and I. Mertig, Phys. Rev. B32, 4431 (1985). , 5325 (1993).
- (34) S.K. Bose, T. Kato, and O. Jepsen, Phys. Rev. B72, 184509 (2005).
- (35) N.F. Berk and J.R. Schrieffer, Phys. Rev. Lett.17, 433 (1966).
- (36) H. Capellmann, J. Low Temp. Phys. 3, 189 (1970).
- (37) S.G. Das, Phys. Rev. B13, 3978 (1976).
- (38) M.A.Jensen and J.P. Maita, Phys. Rev.149, 409 (1966).
- (39) A.H. MacDonald, K.L. Liu, and S.H. Vosko, Phys. Rev. B16, 777 (1977).
- (40) J.F. Janak, Phys. Rev. B16, 255 (1977).
- (41) See Table XIII and Fig. 18 of K.A. Gschneidner, Jr., Solid State Physics 16, edited by F. Seitz and D. Turnbull, Academic Press 1964, pp. 275-426.
- (42) T.-W.E. Tsang, K.A. Gschneidner, Jr., F.A. Schmidt, and D.K. Thome, Phys. Rev. B31, 235 (1985).
- (43) H.E. Flotow and D.W. Osborne, Phys. Rev. 160, 467 (1967).
- (44) C.A. Swenson, Phys. Rev. B53, 3669 (1996).
- (45) J.M. Daams, B. Mitrović, and J.P. Carbotte, Phys. Rev. Lett. 46, 65 (1981).
- (46) G.S. Knapp and R.W. Jones, Phys. Rev. B6, 1761 (1972).
- (47) F.J. Pinski and W.H. Butler, Phys. Rev. B19, 6010 (1979).
- (48) V. Thakor, J.B. Staunton, J. Poulter, S. Ostanin, B. Ginatempo, and E. Bruno, Phys. Rev. B68, 134412 (2003).
- (49) J. Rath and A.J. Freeman, Phys. Rev. B11, 2109 (1975).
- (50) S. Liu, R.P. Gupta, and S.K. Sinha, Phys. Rev. B4, 1100 (1971).
- (51) see, for example, page 148, Fig. 25 of Ref. [varenna, ].
- (52) V.L. Moruzzi, J.F. Janak, and K. Schwartz, Phys. Rev. B 37, 790 (1988).