A Comparison of the Variability of the Symbiotic X-ray Binaries GX 1+4, 4U 1954+31, and 4U 1700+24 from Swift/BAT and RXTE/ASM Observations
Abstract
We present an analysis of the X-ray variability of three symbiotic X-ray binaries, GX 1+4, 4U 1700+24, and 4U 1954+31, using observations made with the Swift Burst Alert Telescope (BAT) and the Rossi X-ray Timing Explorer (RXTE) All-Sky Monitor (ASM). Observations of 4U 1954+31 with the Swift BAT show modulation at a period near 5 hours. Models to explain this modulation are discussed including the presence of an exceptionally slow X-ray pulsar in the system and accretion instabilities. We conclude that the most likely interpretation is that 4U 1954+31 contains one of the slowest known X-ray pulsars. Unlike 4U 1954+31, neither GX 1+4 nor 4U 1700+24 show any evidence for modulation on a timescale of hours. An analysis of the RXTE ASM light curves of GX 1+4, 4U 1700+24, and 4U 1954+31 does not show the presence of periodic modulation in any source, although there is considerable variability on long timescales for all three sources. There is no modulation in GX 1+4 on either the optical 1161 day orbital period or a previously reported 304 day X-ray period. For 4U 1700+24 we do not confirm the 404 day X-ray period previously proposed for this source from a shorter duration ASM light curve. We conclude that all three sources have substantial low-frequency noise in their power spectra that may give the appearance of periodic modulation if this noise is not properly accounted for, particularly if short duration light curves are examined.
1 Introduction
A symbiotic binary is a system which contains a hot object accreting from an M giant companion, either from the wind of the M star or via Roche lobe overflow (e.g. Iben & Tutukov 1996). In most symbiotic stars the accreting object is a white dwarf, and these systems can be modest X-ray emitters (e.g. Mürset et al. 1997). In far fewer systems is the accreting object thought to be a neutron star. There are presently only five sources for which there is strong evidence that they are “symbiotic X-ray binaries” with a neutron star component. This paper discusses three of these sources: GX 1+4, 4U 1954+31, and 4U 1700+24. GX 1+4 has been known as a symbiotic source containing an X-ray pulsar for some time (e.g. Davidsen et al. 1977). 4U 1700+24 was suspected to be a symbiotic source and this is now confirmed and 4U 1954+31, which was initially thought to be a high-mass X-ray binary, has also recently been found to have an M giant counterpart (Masetti et al. 2006). In addition to these sources, Sct X-1 IGR J16194-2810, and 1RXS J180431.1-273932 have also recently been suggested to be symbiotic X-ray binaries (Kaplan et al. 2007, Masetti et al. 2007b, Nucita et al. 2007).
We present an analysis of the X-ray variability of GX 1+4, 4U 1954+31, and 4U 1700+24 using long term observations made with the Swift Burst Alert Telescope (BAT) and the Rossi X-ray Timing Explorer (RXTE) All Sky Monitor (ASM). Sct X-1, IGR J16194-2810, and 1RXS J180431.1-273932 are not considered here as these sources were not strongly detected by the BAT and ASM light curves are not available for IGR J16194-2810 and 1RXS J180431.1-273932. These observations enable a study of variability on timescales from hours to years. The BAT observations show the presence of a strong modulation with period of about 5 hours in 4U 1954+31, first reported by Corbet et al. (2006). We consider possible mechanisms that could cause this modulation. Modulation on timescales of hours is not seen in either GX 1+4 or 4U 1700+24. We find no evidence for orbital modulation in any of these three systems.
2 Previous Observations of Symbiotic X-ray Binaries
We summarize here previous observations of symbiotic X-ray binaries with emphasis on variability and previously claimed periodicities in GX 1+4, 4U 1954+31, and 4U 1700+24. Source parameters are listed in Table 1.
2.1 GX 1+4
Pulsations with a period of 120s from GX 1+4 were discovered by Lewin et al. (1971). The optical counterpart was identified as the bright infrared source V2116 Oph (Glass & Feast 1973) and GX 1+4 was classified as a symbiotic X-ray binary containing an M giant mass donor by Davidsen et al. (1977), making it the first such object to be identified. The long term X-ray light curve shows large variability, and the pulsar shows both spin-up and spin-down (e.g. Chakrabarty et al. 1997). Chakrabarty & Roche (1997) presented extensive optical, infrared, and X-ray observations of GX 1+4 and concluded that the binary period must be greater than 100 days, and is most likely greater than 260 days, based on the assumption that the M giant does not overfill its Roche lobe. Cutler et al. (1986) proposed an orbital period of approximately 304 days based on variations in the pulse period measured with the high-energy X-ray spectrometer on OSO-8, and Pereira et al. (1999, 2000) claimed confirmation for this from BATSE pulse period measurements with a refined period of 303.8 1.1 days. Pereira et al. (1999) noted that the pulse period variations could not be attributed to orbital Doppler modulation as this would require an implausibly large mass for the companion star and instead the period changes must be related to changes in the accretion torque. Using infrared radial velocity measurements of the M giant, Hinkle et al. (2006) excluded the 304 day period as an orbital period and instead found a period of 1161 12 days and a system eccentricity of 0.10 0.02. GX 1+4 is thus a very variable source with well studied pulsations. Its classification as a symbiotic X-ray binary is firm - the pulsations, the change in their period, and the high luminosity clearly show that the system contains a neutron star.
2.2 4U 1954+31 (3A 1954+319)
Pointed observations of 4U 1954+31 were first obtained with EXOSAT (Cook et al. 1984) and Ginga (Tweedy et al. 1989). In both sets of observations flaring behavior on timescales of minutes was reported. Cook et al. (1984) found that the X-ray spectrum could be fitted with either a power-law or a thermal bremsstrahlung model. Tweedy et al. (1989) reported that a more complicated model was required such as the typical X-ray pulsar spectrum of a power-law with high energy cutoff. However, even with this model Tweedy et al. (1989) found evidence for the presence of an additional soft component. Because of the variability and the power law spectrum both Cook et al. (1984) and Tweedy et al. (1989) concluded that 4U 1954+31 was likely to be a high-mass X-ray binary (HMXB). However, Masetti et al. (2006) obtained a precise position from Chandra observations which enabled the optical counterpart to be identified as an M giant. 4U 1954+31 is thus a symbiotic system rather than an HMXB. Masetti et al. (2007a) give a summary of a variety of X-ray observations of 4U 1954+31. No orbital period has been proposed for this system and, apart from the 5 hour period discussed in this paper, no pulsations had previously been reported.
2.3 4U 1700+24 (2A 1704+241)
4U 1700+24 was proposed to be a symbiotic X-ray binary by Garcia et al. (1983) on the basis of a positional association with the M giant star HD 154791 obtained from observations with the Einstein Observatory Imaging Proportional Counter (IPC). A position obtained with the ROSAT High Resolution Imager by Morgan & Garcia (2001) was apparently inconsistent with HD 154791. However, subsequent observations with the Chandra High Resolution Camera Imager by Masetti et al. (2006) gave a position consistent with that of HD 154791 and inconsistent with that reported by Morgan & Garcia (2001). The Masetti et al. (2006) position appears to firmly identify 4U 1700+24 as a symbiotic system.
Garcia et al. (1983) reported the presence of 900s quasi-periodic modulation from their IPC observations. Morgan & Garcia (2001) also claimed to detect modulation near a period of 900s in ROSAT observations, but with a different frequency from that reported previously. Masetti et al. (2002) reported on ASCA, BeppoSAX, ROSAT, and RXTE Proportional Counter Array (PCA) observations of 4U 1700+24. They found erratic “shot noise” variability on timescales of tens to thousands of seconds but did not confirm the modulation on the 900s timescale reported by Garcia et al. (1983) and Morgan & Garcia (2001).
Masetti et al. (2002) reported a tentative periodicity of 400 days from RXTE ASM observations obtained between 1996 and 2001. Galloway et al. (2002) also analyzed RXTE ASM observations obtained between January 1996 and April 2002 and claimed to confirm this modulation at a refined period of 404 20 days. Galloway et al. (2002) also reported optical radial velocity measurements which showed marginally significant modulation at a period of 404 3 days and suggested that the modulation could be caused by either orbital motion or pulsational modulation of the red giant.
In summary, there is strong evidence that 4U 1700+24 is a symbiotic X-ray source. It is highly variable in the X-ray band, there is possible evidence of modulation on a 400 day timescale, but there is no convincing evidence of pulsations.
2.4 Scutum X-1, IGR J16194-2810, and 1RXS J180431.1-273932
Sct X-1 has been observed by many instruments since its discovery in a rocket flight by Hill et al. (1974). Kaplan et al. (2007) recently derived a corrected position for Sct X-1 that showed it to be associated with a late type giant or supergiant optical counterpart. Pulsations at a period of 111 s were first detected in Ginga observations (Makino 1988; Koyama et al. 1991) and Kaplan et al. (2007) showed from observations with Ginga, RXTE, and XMM-Newton that the pulsar has exhibited spin-down over a period of 17 years.
IGR J16194-2810 is another recently discovered symbiotic X-ray binary. The source was reported in the 2nd IBIS survey (Bird et al. 2006) and associated with the ROSAT source 1RXS J161933.6-280736 by Stephen et al. (2006). Masetti et al. (2007b) used a position obtained with the Swift X-ray Telescope to identify an M2 III optical counterpart. Masetti et al. reported erratic X-ray variability on timescales of hundreds to thousands of seconds, but no pulsations were found.
1RXS J180431.1-273932 has been found to be a pulsar with a 494s period by Nucita et al. (2007) from XMM observations. Nucita et al. (2007) also identify an optical counterpart with a possible M6III classification. This classification would make 1RXS J180431.1-273932 another pulsing symbiotic X-ray binary.
3 Observations
3.1 Swift BAT
The Swift BAT is described in detail by Barthelmy et al. (2005) and the data reduction process is described by Markwardt et al. (2005) and Tueller et al. (2007). The BAT is a very wide field of view (1.4 sr half-coded) hard X-ray telescope that utilizes a 2.7 m2 coded-aperture mask and a 0.52 m2 CdZnTe detector array divided into 32,768 detectors each with an area of 0.16 cm2. The pointing direction of the BAT is determined by observations using the narrow-field XRT and UVOT instruments also on board Swift which are primarily used to study gamma-ray bursts and their afterglows. BAT observations of X-ray sources are thus generally obtained in a serendipitous and unpredictable fashion. Typically the BAT observes 50% to 80% of the sky each day. The data considered here consists of individual “snapshots”, i.e. times spent observing the same position without a break. These snapshots have exposure times ranging between 150 to 2678 s with means of 891 s (GX 1+4), 987 s (4U 1954+31) and 979 s (4U 1700+24). The time resolution of our data is equal to the snapshot duration.
From these snapshots light curves are constructed in 4 energy bands: 14 to 25, 25 to 50, 50 to 100, and 100 to 195 keV. For the entire energy range the Crab produces approximately 0.045 counts s-1 per fully illuminated detector for an equivalent on-axis source (hereafter abbreviated to counts s-1). In each energy band the Crab produces 0.019, 0.018, 0.0077, and 0.0012 counts s-1 respectively. The BAT light curves used here cover the periods MJD 53,373 to 53,818 (GX 1+4), 53,350 to 53,815 (4U 1954+31), and 53,352 to 53,818 (4U 1700+24).
3.2 RXTE ASM
The RXTE ASM (Levine et al. 1996) consists of three similar Scanning Shadow Cameras which perform sets of 90 second pointed observations (“dwells”) so as to cover 80% of the sky every 90 minutes. Light curves are available in three energy bands: 1.5 to 3 keV, 3 to 5 keV, and 5 to 12 keV. The Crab produces approximately 75.5 counts s-1 in the ASM over the entire energy range and 26.8 (1.5 to 3.0 keV), 23.3 (3 to 5 keV), and 25.4 (5 to 12 keV) counts s-1 in each energy band. Observations of blank field regions away from the Galactic center suggest that background subtraction may produce a systematic uncertainty of about 0.1 counts s-1 (Remillard & Levine 1997). The ASM light curves used in our analysis span the period from MJD 50,087 to 54,195 except for the light curve of GX 1+4 which starts on MJD 50,088.
4 Analysis and Results
The RXTE ASM light curves cover a longer duration than the Swift BAT light curves and so are better suited for searches for orbital modulation on the long time scales expected for symbiotic X-ray binaries. The BAT light curves are generally more sensitive than the ASM light curves, particularly for highly-absorbed sources, and so have advantages in studying variability on shorter timescales. We use power spectra of the light curves to search for periodic modulation and in all cases the calculation of power spectra employed the “semi-weighting” scheme discussed in Corbet et al. (2007a, b).
4.1 GX 1+4
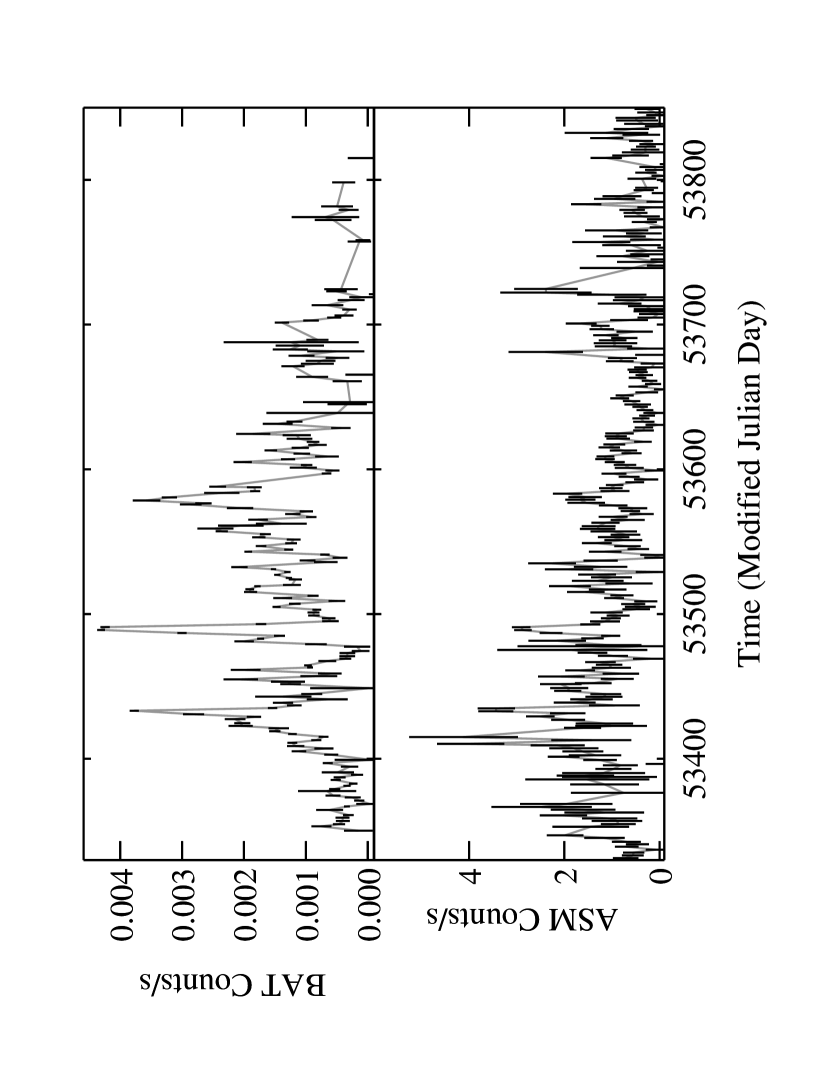
The ASM and BAT light curves of GX 1+4 are shown in Fig. 1 and the mean count rates are given in Table 1. There is considerable variability seen with both instruments. During the interval covered simultaneously by both instruments the BAT light curve shows dramatic flaring while the modulation in the ASM light curve appears to have lower amplitude.
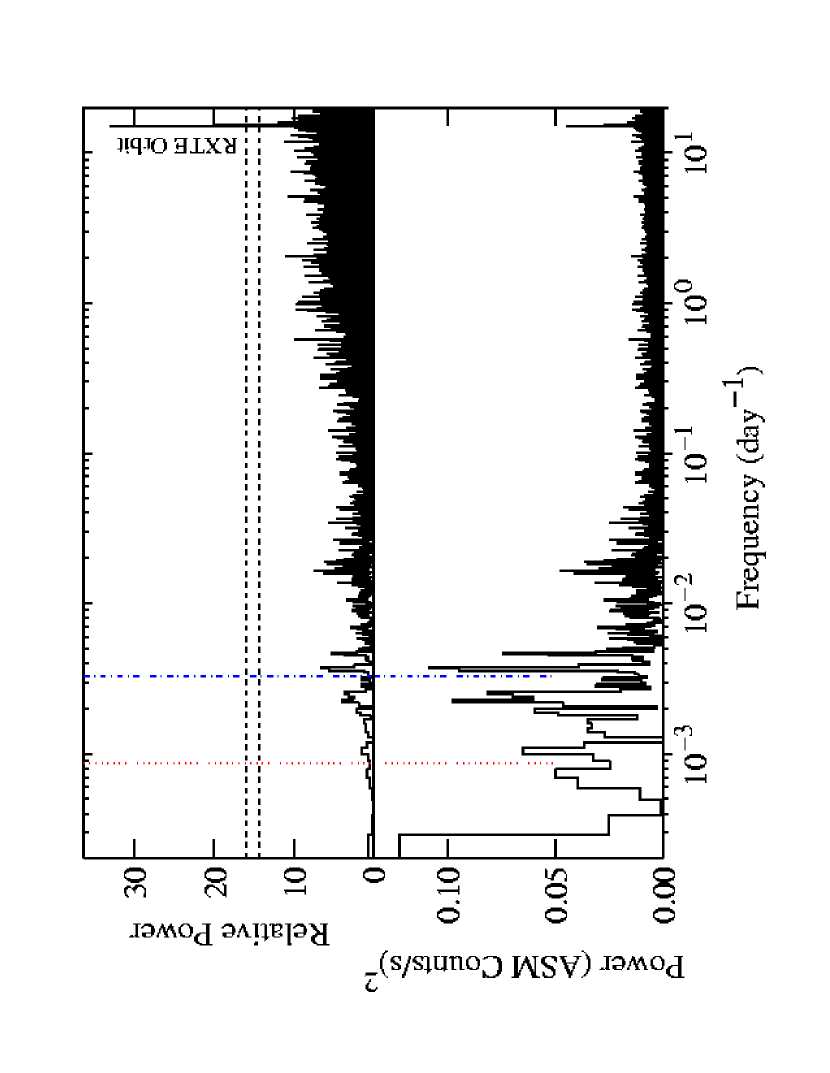
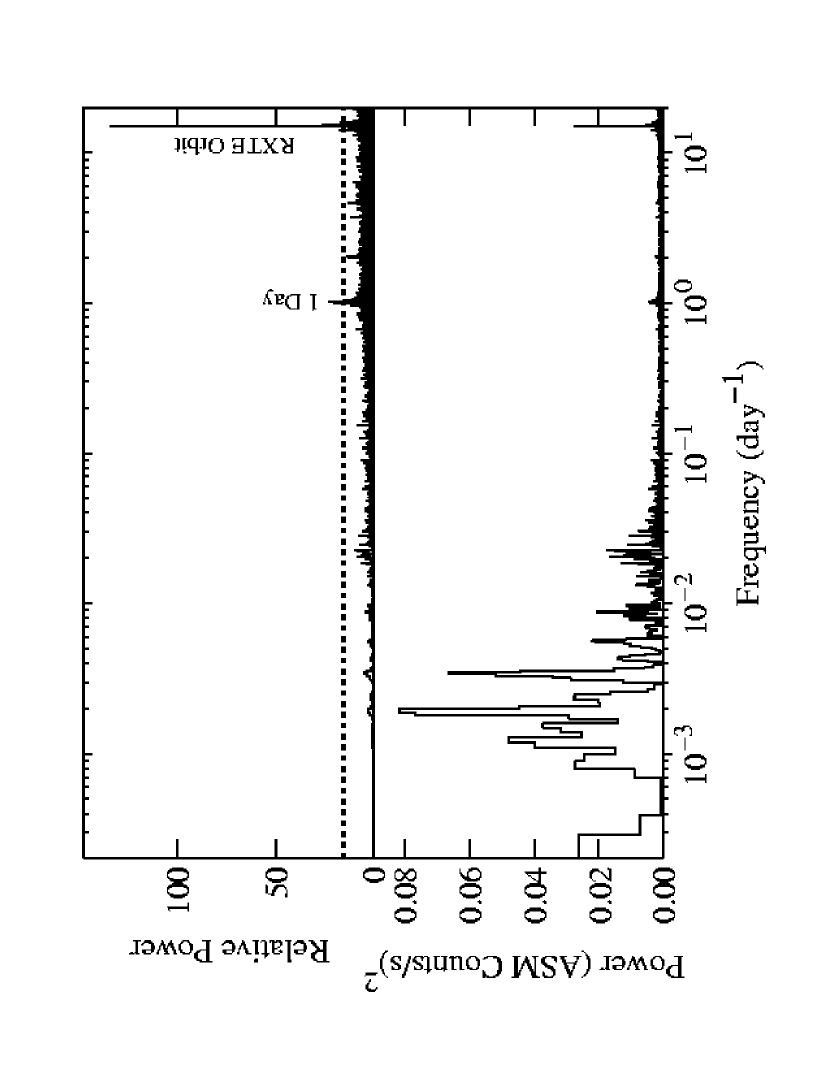
The power spectrum of the entire ASM light curve for periods between 0.05 to 4100 days with 200,000 frequency steps is shown in Fig. 2. The length of the light curve implies a frequency resolution of 2.410-4 day-1 which was confirmed by calculating power spectra with the data values replaced with sine waves. The power spectrum in Fig. 2 is thus oversampled by a factor of 2.4. Although there are a number of peaks in the power spectrum at low frequencies, none exactly coincides with either the 1160 day period proposed by Hinkle et al. (2006) or the 304 day period reported by Cutler et al. (1986). Although the largest peak in the power spectrum is at 270 days, which is similar length to the Cutler et al. 304 day period, the peak does not overlap with this period. There are also other peaks almost as strong as the peak at 270 days, which appears to be part of the general low frequency noise present in the power spectrum.
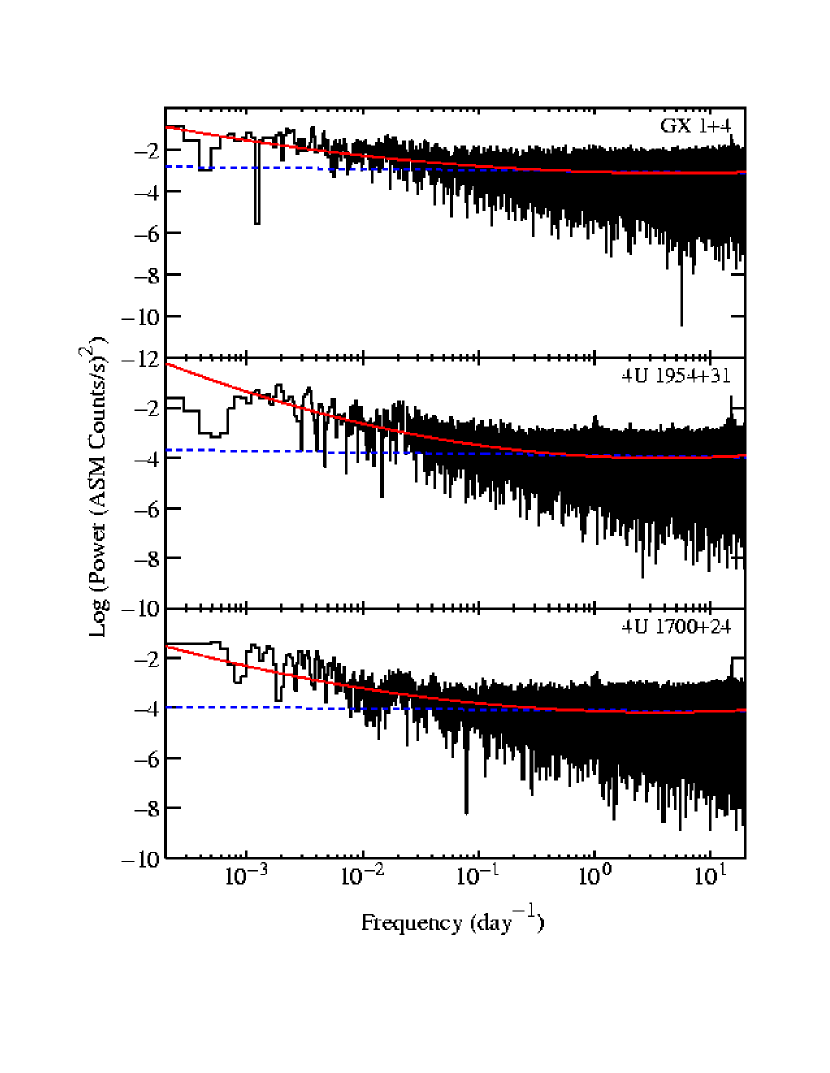
In order to estimate the amount of low frequency noise present in the spectrum and remove it we examined the relationship between the continuum power level and frequency. This was done using the logarithms of power and frequency as advocated, for example, by Vaughan (2005). It was found that a linear fit to log(power) vs. log(frequency), i.e. a power-law relationship between power and frequency, underestimated the power at low frequencies (Fig. 3). Instead it was found that a quadratic fit gave a reasonable approximation to the continuum noise level. This quadratic fit was subtracted from the logarithm of the power spectrum together with a constant of value 0.25068 in order to account for the bias due to the distribution of the power spectrum (e.g. Papadakis & Lawrence 1993, Vaughan 2005). The power spectrum corrected in this way for the “red noise” contribution is shown in the upper panel of Fig. 2. The 95% and 99% significance levels are also plotted, although these do not include the effects of the red noise subtraction, including the choice of model for this. These effects are greater at lower frequencies and thus even larger power spectrum levels than those marked would be required to achieve true 95% or 99% significance levels. With the continuum noise removed in this way it can be seen that none of the low frequency peaks achieves statistical significance. At higher frequencies there is a significant peak around the orbital period of RXTE at 15.0185 day-1 and a smaller peak close to 1 day-1 which is likely related to aliasing of the strong low frequency noise with a one day sampling pattern (see Farrell, O’Neill & Sood 2005, Wen et al. 2006).
In Fig. 4 we show the ASM light curve of GX 1+4 folded on the Hinkle et al. (2006) orbital period. The folded light curve does not show obvious periodic modulation. In particular, there is neither a flux enhancement at periastron passage nor flux reduction at the phase of predicted eclipse (Hinkle et al. 2006).
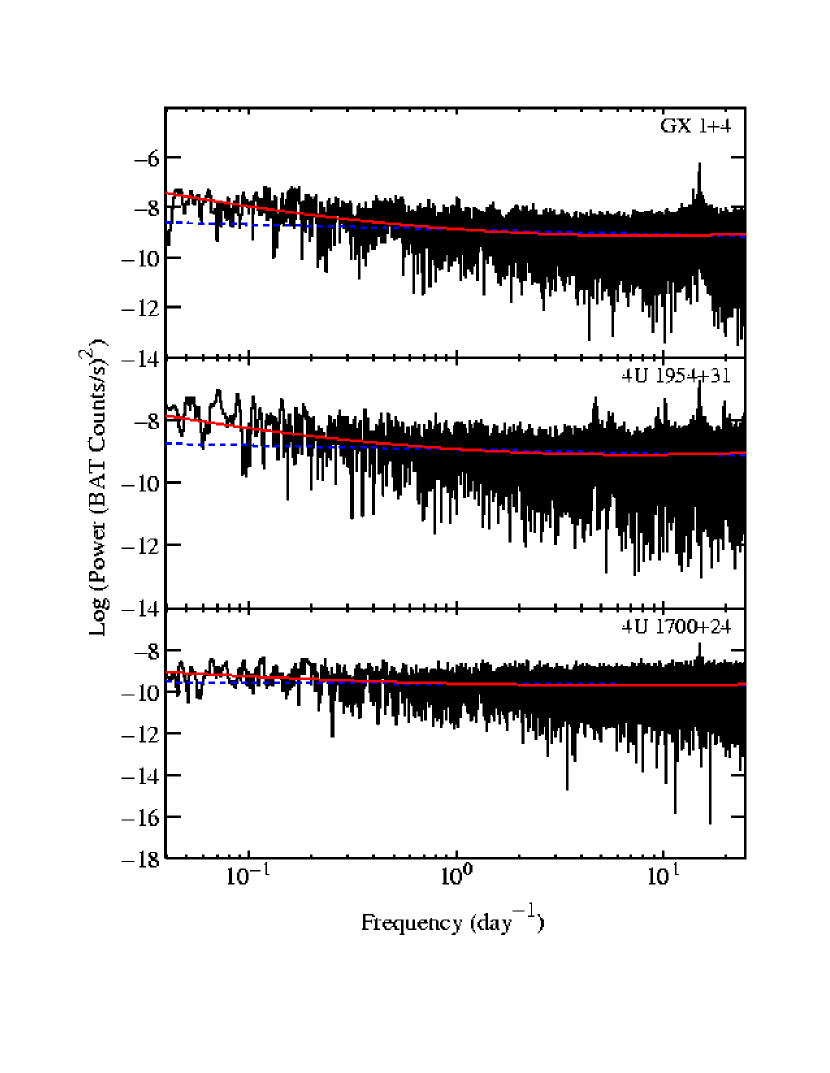
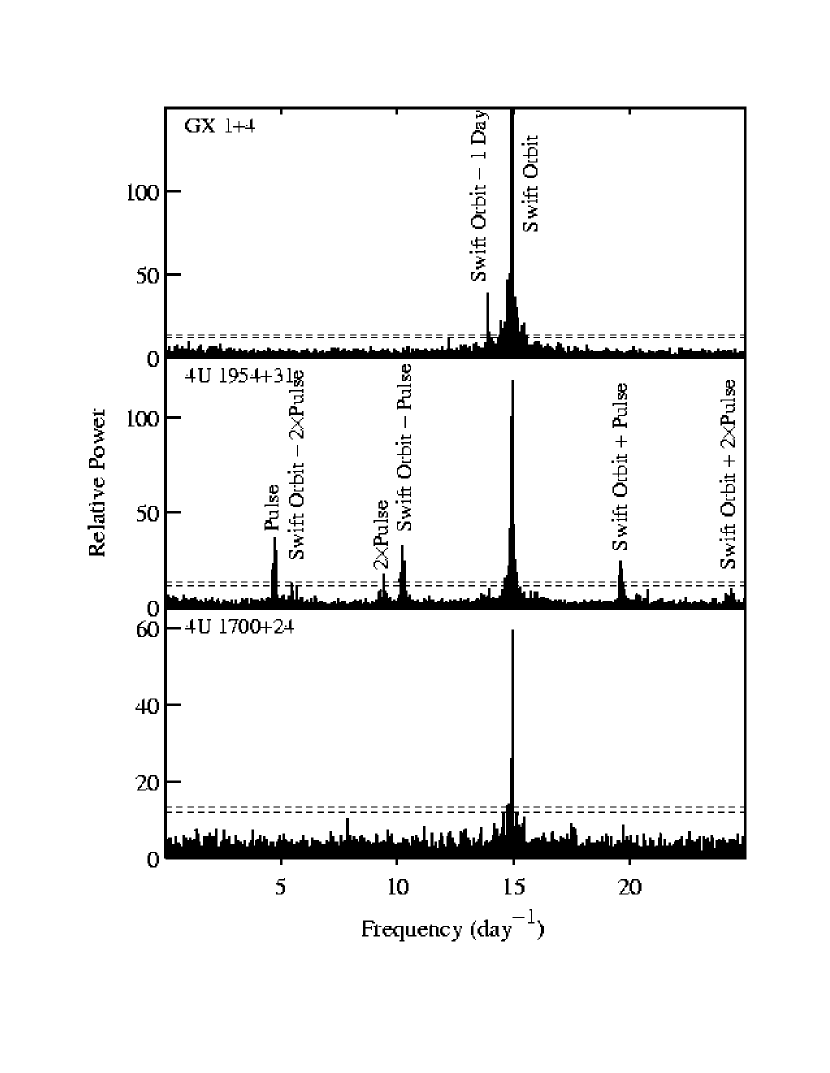
We next investigated the BAT light curve of GX 1+4 to search for modulation at higher frequencies. The BAT power spectrum of GX 1+4 was calculated for the period range of 0.04 to 25 days with 40,000 frequency steps. The total light curve duration of about 440 days implies a nominal frequency resolution of about 210-3 day-1. However, there are several gaps in the light curve and an analysis with data values replaced with a sine wave indicates that the resolution is somewhat worse at 2.510-3 day-1. The calculated power spectrum thus is oversampled by a factor of 4. In a similar way that low frequency noise was removed from the ASM power spectrum we again fitted log(power) vs. log(frequency) with a quadratic function as shown in Fig. 5. The BAT power spectrum of GX 1+4 corrected for the continuum noise level is shown Fig. 6. No features due to source variability are detected. A set of peaks in the range of approximately 14.89 to 14.96 day-1 is due to the orbital period of the Swift satellite. At slightly lower frequencies, another set of small peaks is seen near 13.92 day-1. As these peaks are 1 day-1 less than the Swift orbit peaks, these are also thought to be artifacts.
4.2 4U 1954+31
The light curves of 4U 1954+31 obtained with the RXTE ASM and Swift BAT are shown in Figs. 7 and 8 and the mean count rates are given in Table 1. The ASM light curve shows the presence of several outbursts, the most recent of which was also observed with the BAT. However, some differences are seen in the structure within the flare (Fig. 8).
We first searched for long period variations by calculating the power spectrum of the RXTE ASM light curve. We employed the same fitting technique to remove the low-frequency noise that was employed for GX 1+4. The resulting power spectra before and after correction for low-frequency noise are shown in Fig. 9. At low frequencies there is no significant detection of a period that could be due to orbital modulation, but substantial noise is present in the uncorrected power spectrum that is likely to be related to the outbursts that can be seen in the light curve.
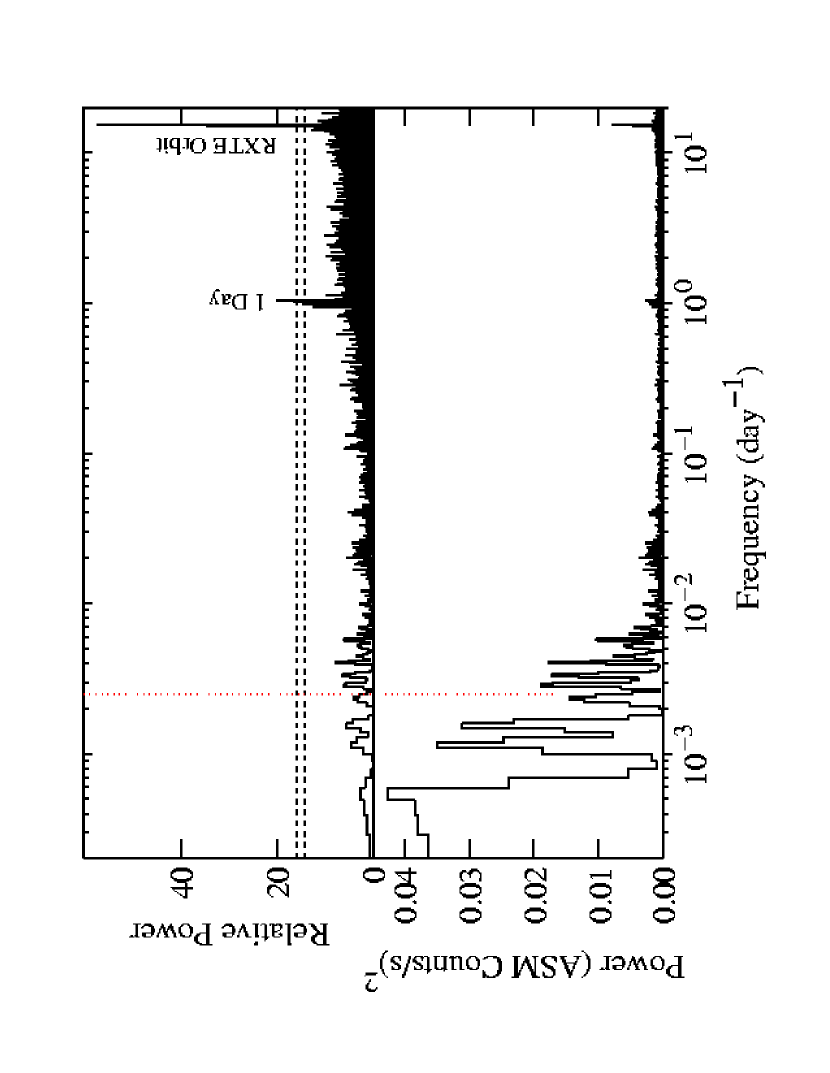
We next utilized the more sensitive BAT observations to investigate higher frequency variability. This was calculated in the same way as for GX 1+4 with the same technique used to remove low-frequency noise. Due to gaps in the light curve the frequency resolution was found to be reduced to 310-3 day-1. The power spectrum of the entire BAT light curve is shown in Fig. 6 with linear frequency scaling to emphasize the high frequency portion of the spectrum. The dominant feature in the power spectrum is a set of peaks around the orbital period of the Swift satellite between approximately 14.7 to 15.1 day-1. The peaks seen near 13.92 day-1 in GX 1+4, which were ascribed to a one day-1 alias of the Swift orbital period, are at most only very weakly present. This is probably due to the lower flux of 4U 1954+31 compared to GX 1+4 and the correspondingly lower modulation at the Swift orbital period. However, in addition to the features at the Swift orbital period, a number of other significant peaks can be seen. Investigation of these peaks shows that they are all related to a modulation at a period of approximately 5.09 hours (4.72 day-1) and aliases with the orbital period of the Swift satellite. Present are the first and second harmonics of this 5 hour period and beats between this period and Swift’s orbital period. The Fourier modulation amplitude at 5 hours is approximately 6.5 10-4 counts s-1.
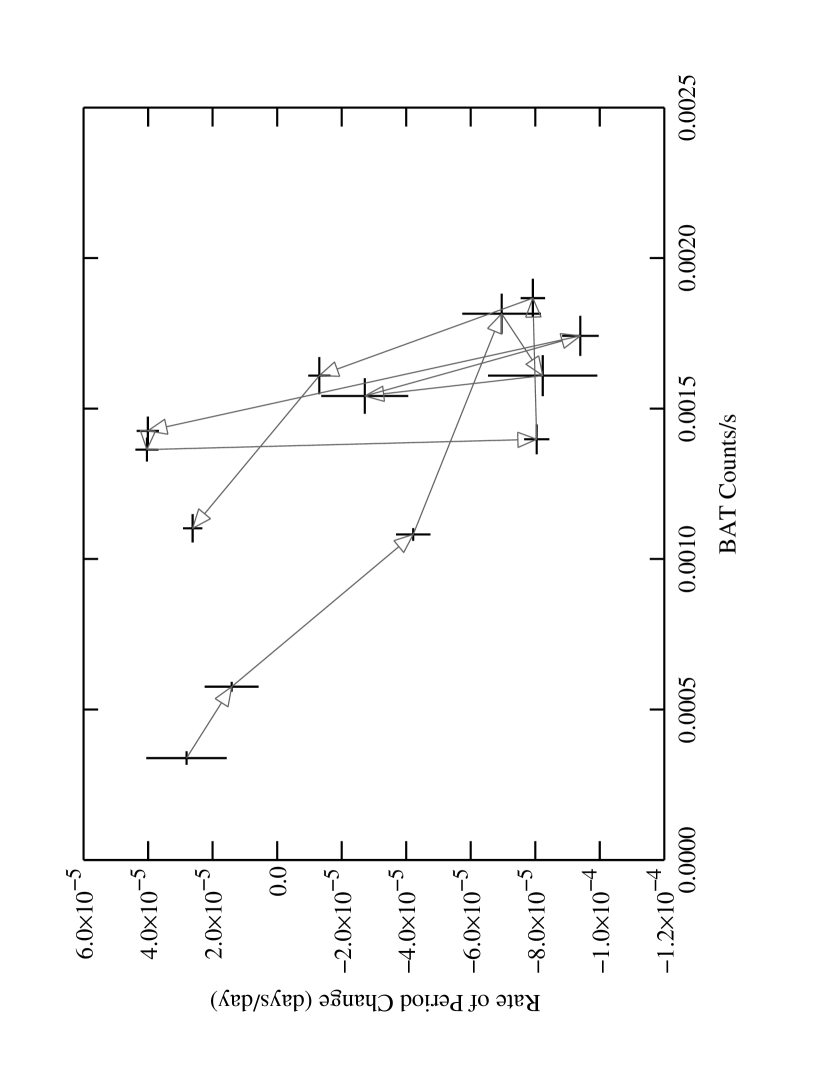
The peak in the power spectrum near 5 hours shows a complex structure (Fig. 10). When power spectra are calculated from subsets of the BAT light curve (Fig. 11) it is seen that during the course of the BAT observations the period decreased from approximately 5.19 to 5.02 hours in a nearly monotonic fashion (Fig. 12). We estimate the period decrease rate to be -2.6 0.2 10-5 day day-1, equivalent to a timescale of 22 2 years (see also Mattana et al. 2006). No trend was seen in the pulsed fraction which had a mean of 60%, where the pulsed flux is defined as the Fourier amplitude divided by the mean flux. We corrected the BAT light curves for the period change and folded them on the pulse period (Fig. 13). The 14 to 25 keV and 25 to 50 keV folded data show similar morphology, whereas the 50 to 100 keV profile appears to show a maximum at a slightly earlier phase. The count rate is too low in the 100 to 195 keV band to measure the pulse profile.
We next computed the rate of change in the period as a function of the count rate and this is shown in Fig. 14. There is a modest anti-correlation between period change and count rate - the linear correlation coefficient is -0.53 and the probability of obtaining this level of correlation from a random data set is 6.5%. At the lower count rates at the start and end of the outburst the rate of period decrease is much lower and might transition to period increase.
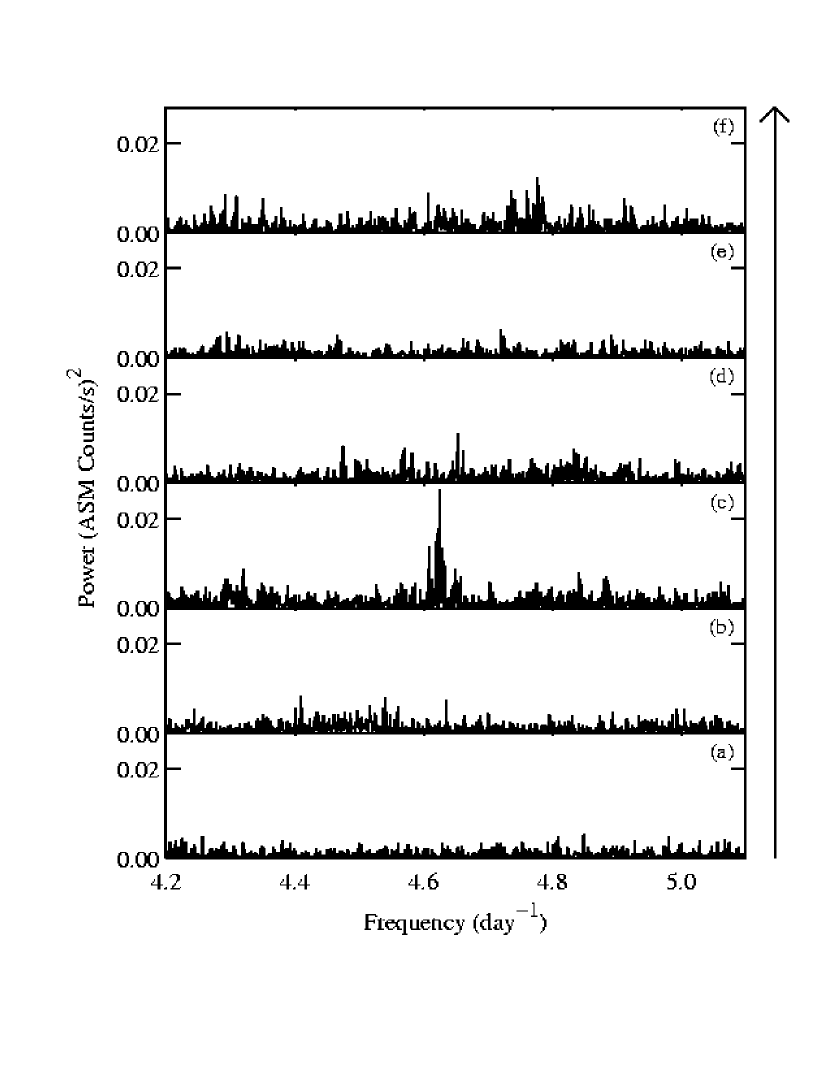
Because of the detection of the 5 hour period in the BAT light curve we examined the ASM power spectrum in more detail for the possible presence of this period. The ASM power spectrum is plotted with linear frequency scaling in Fig. 15. A low amplitude peak is seen near 4.72 day-1, consistent with the range of frequencies found in the BAT. If we make a significance calculation for the ASM peak with an assumed restricted range of frequencies of 4.5 to 4.9 day-1, which encompasses the range of frequencies seen with the BAT, then the ASM detection is significant at 99%. We then investigated dividing the ASM power light curve into sections and calculating power spectra of these to investigate the time dependence of this peak. After some experimentation, we found that dividing the light curve into 655 day duration sections gave a reasonable balance between having sufficient data in a section to show a peak, and providing information on when this modulation near the 5 hour period may have occurred. Fig. 16 shows the ASM power spectrum in the 4.2 to 5.1 day-1 range for the light curve divided into these sections, the start and end times of the light curves are given in the Figure caption. For this choice of time ranges there is only one possible detection of modulation near the 5 hour period. This is for the section of the light curve that was obtained between MJD 51,397 and 52,052.
We next corrected the ASM light curves in the time range MJD 53,350 to 53,650 for the period changes detected in the BAT light curve, and folded the energy separated data (Fig. 17). The folded 1.5 - 3 keV and 3 - 5 keV bands do not exhibit any obvious modulation. The folded 5 - 12 keV ASM light curve suggests a possible modulation which peaks at the same phase as the folded BAT light curves.
4.3 4U 1700+24
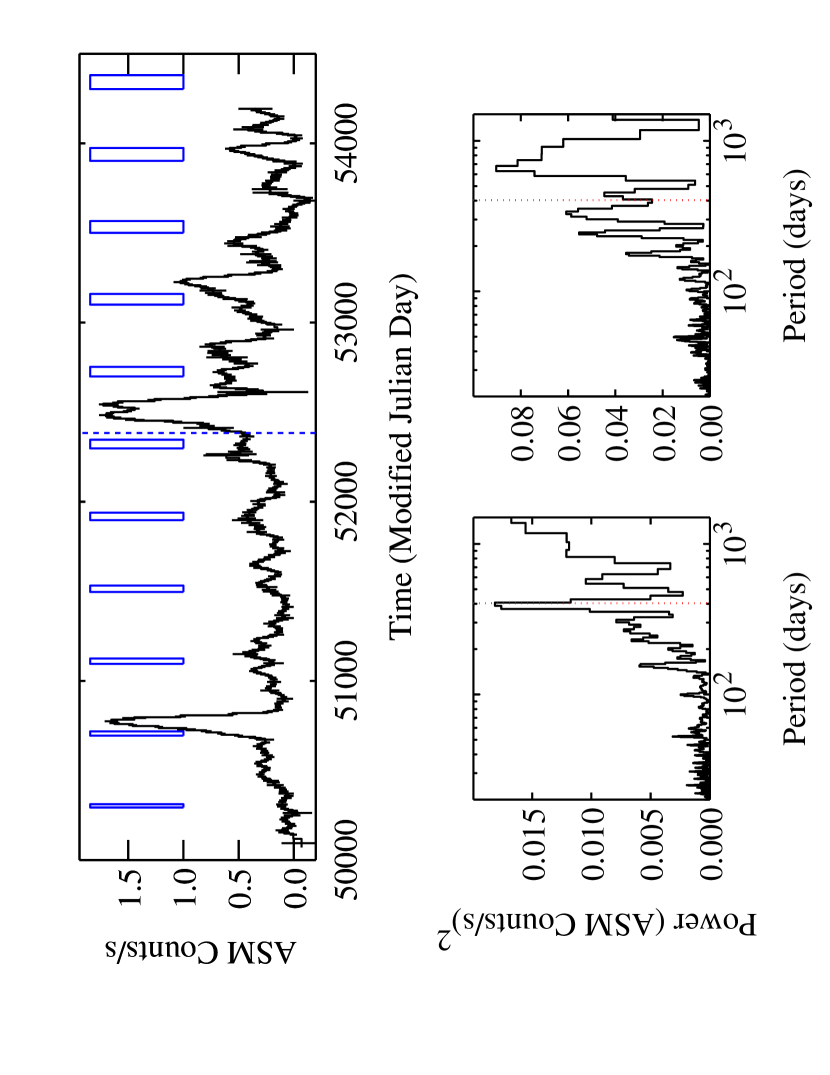
The ASM and BAT light curves of 4U 1700+24 are shown in Fig. 18 and the mean count rates are given in Table 1. The ASM light curve shows considerable variability with at least two prominent outbursts.
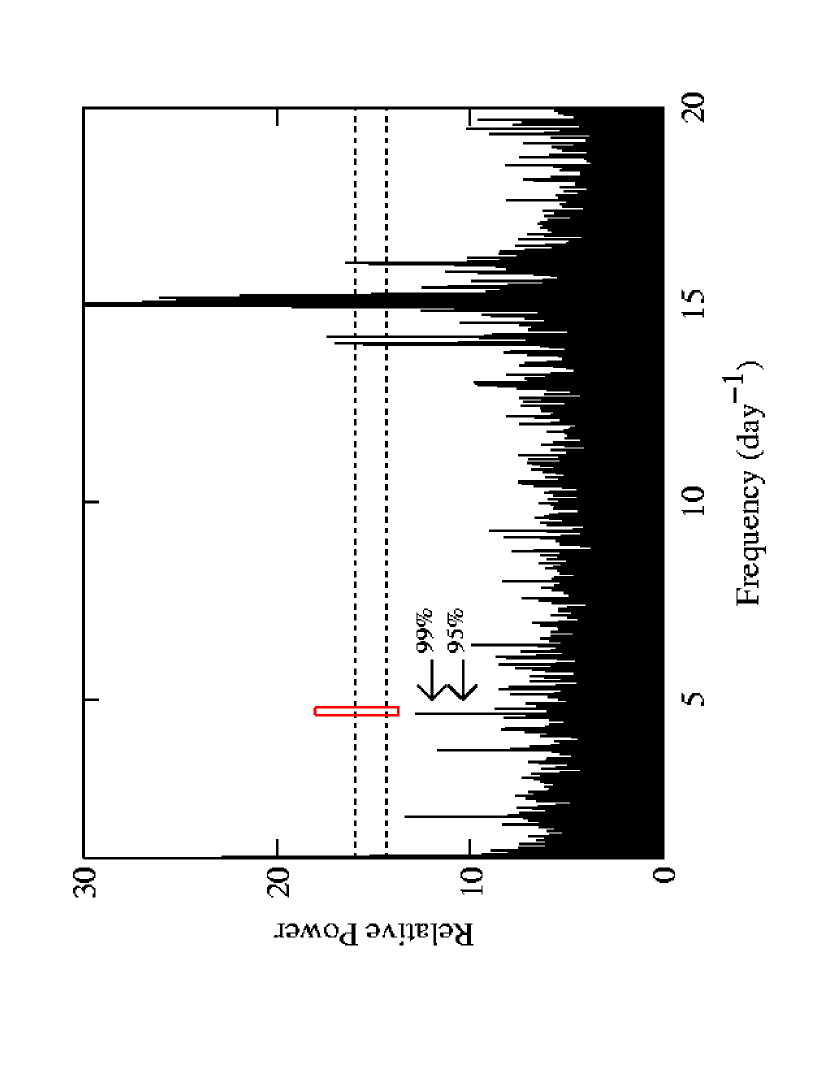
The power spectrum of the ASM light curve of 4U 1700+24 was obtained in the same way as for GX 1+4 and 4U 1954+31 including the same removal of low-frequency noise. The uncorrected and corrected power spectra are shown in Fig. 19 where the dashed line indicates the 404 day period proposed by Masetti et al. (2002) and Galloway et al. (2002). This period does not coincide with any significant peak in the power spectrum. Although a small peak is present near this period in the uncorrected power spectrum this is apparently part of the low-frequency noise. In Fig. 20 (top panel) we plot a smoothed version of the ASM light curve together with the predicted times of periastron passage using the orbital fit of Galloway et al. (2002). The division between the data presented in Galloway et al. (2002) and data obtained subsequently is marked by the dashed line. Although some flares coincide with the predicted times of periastron passage, many do not. In particular, the largest flare in the light curve around approximately MJD 52500 is near the time of predicted apastron passage. In the bottom panels of Fig. 20 we plot the power spectra of the two light curve sections, not corrected for low frequency noise. The power spectrum of the later section of the light curve does not show modulation at 404 days.
The BAT light curve of 4U 1700+24 shows that the source was in a low luminosity state during this time. We corrected the power spectrum for any low-frequency components as for GX 1+4 and 4U 1954+31. However, Fig. 5 shows that the power spectrum was fairly flat compared to the other two sources. The corrected power spectrum of the BAT light curve is plotted in Fig. 6. It does not show the presence of any periodicities from the source at high frequencies and the only significant feature present is at the Swift orbital period. The one day-1 alias peaks of the Swift orbital period near 13.92 day-1 seen in GX 1+4 are not seen in 4U 1700+24, which is likely due to the relative faintness of 4U 1700+24 and the low amplitude of the modulation at the Swift orbital period.
5 Discussion
5.1 Lack of Orbital Flux Modulation
None of the three symbiotic X-ray binaries considered here shows modulation on long timescales which could be interpreted as the orbital period of the system. There is no modulation at the 1161 day orbital period of GX 1+4 and the previously proposed modulation period of 404 days in 4U 1700+24 is also not a persistent feature of the X-ray light curve. The long term light curves of all three of these systems appear to be dominated by irregular flaring type behavior. Fig. 3 illustrates the importance of removing low-frequency noise before searching for the long orbital periods expected in this type of system. The lack of such subtraction probably accounts for the previously reported periods in these sources. Although Galloway et al. (2002) also reported radial velocity variations that appeared to coincide with the claimed X-ray period, the significance of the period was low, and these authors also reported evidence for radial velocity variations on longer timescales. The cause of the flares in these sources may be variability in the stellar wind of the M giant as almost all red giants are optically photometrically variable on time scales of hundreds to thousands of days (e.g. Percy et al. 2001). If the mass loss rate in the wind varies in conjunction with the photometric variations then this could produce a modulation of the accretion rate onto the neutron star. For GX 1+4, a modest eccentricity of 0.100.02 was reported by Hinkle et al. (2006). Our results show that for GX 1+4, 4U 1954+31, and 4U 1700+24 any accretion rate modulation caused by an eccentric orbit is much less than that caused by other mechanisms.
5.2 The 5 hour period in 4U 1954+31
Masetti et al. (2006) determined the optical counterpart of 4U 1954+31 to be an M 4-5 giant which would imply a long orbital period in order for the star not to overfill its Roche lobe. For comparison, Chakrabarty & Roche (1997) derive a constraint of Porb 100 days for GX 1+4 where the donor is an M5 III star. The 5 hour period thus cannot be the orbital period of a compact object about the M star. The change in the 5 hour period cannot be predominantly due to orbital Doppler modulation. If this was the case from Fig. 12 it can be seen that the orbital period would be 500 days, and the velocity semi-amplitude would be 10,000 km s-1. These values would give a huge mass function of 5 106M⊙. The large change in the 5 hour period must thus be intrinsic to the source of the modulation. This makes it implausible that this 5 hour period is caused by orbital modulation which rules out triple star models. We note that the period change is also too large for the period to come from the rotation period of an accreting white dwarf because of the large moment of inertia of these objects. We therefore consider other possible models that could explain the 5 hour modulation.
5.2.1 Neutron Star Rotation Period
The 5 hour period in 4U 1954+31 is somewhat reminiscent of the 2.7 hour period seen in the high-mass X-ray binary 2S 0114+650. This period was discovered by Finley, Belloni, & Cassinelli (1992) and was proposed to be a neutron star rotation period. Apparent confirmation of this interpretation comes from the continued presence of the 2.7 hour modulation in the ASM light curve (Corbet et al. 1999; Farrell et al. 2006) which implies the modulation is rather coherent. An indirect argument for the modulations on periods of hours in both 4U 1954+31 and 2S 0114+650 being neutron star pulsation periods is that no other periodicity has been found in these systems that could be neutron star pulsation periods. A long period of 1.6 hours has also been reported for IGR J16358-4726 (Kouveliotou et al. 2003, Patel et al. 2004). However, for IGR J16358-4726 it is not clear whether this period is a neutron star rotation period or an orbital period. A 5 hour neutron star rotation period for 4U 1954+31 would make it one of the longest known with only the 6.67 period from the point source in the supernova remnant RCW 103 exceeding this value (De Luca et al. 2006).
If the periodicity in 4U 1954+31 does indeed represent the rotation period of a neutron star, then the rapid spin-up requires an X-ray luminosity of approximately 51035 ergs s-1 (e.g. Mason 1977, Joss & Rappaport, 1984). For comparison, in an earlier outburst of 4U 1954+31 Masetti et al. (2007a) derive luminosities of 21035 ergs s-1, not corrected for absorption from RXTE and BeppoSAX observations obtained on MJD 50796 and 50937 respectively. Masetti et al. (2007a) also found the absorption to be complex and variable. The observed X-ray flux therefore appears to be consistent with that required to account for the observed spin-up.
For a 5 hour rotation period, material corotating in a Keplerian orbit about the neutron star would be at a radius of 1011 cm. In contrast, the magnetospheric radius, at which the magnetic field would dominate over the ram pressure, would be located at 109 (LX/1035ergs s-1)-2/7 (B/1012G)4/7 cm. The 5 hour period is thus apparently much longer than the equilibrium spin period. This appears to be similar to the case of GX 1+4 where the corotation radius is estimated to be 3 109 cm and the magnetospheric radius is estimated to be significantly smaller at 3 108 cm for a magnetic field of 1012 G (Chakrabarty & Roche 1997). Despite this, GX 1+4 has primarily exhibited long-term spin-down, with occasional spin-up behavior seen in the brightest states (e.g. Chakrabarty et al. 1997, Ferrigno et al. 2007). In order to explain the spin-down in GX 1+4 without the need for an unusually strong magnetic field, it has been proposed (e.g. Makishima et al. 1988, Chakrabarty et al. 1997, Nelson et al. 1997) that a counter-rotating accretion disk may sometimes form. Alternatively, Perna et al. (2006) consider a spin-down mechanism related to the fallback of material expelled when a neutron star is in the propeller regime.
The possible detection of the 5 hour period in 4U 1954+31 with the ASM was at a similar period to that seen at the start of the outburst observed with the BAT. This suggests that 4U 1954+31, like GX 1+4, may also exhibit spin-down between outbursts that maintains the period at this length. The possibility of spin-down is also suggested by the lower flux points in Fig. 14. The dependence of on flux is predicted by standard accretion models (e.g. Ghosh & Lamb 1979) and has been seen, for example, in the HMXB EXO 2030+375 (Parmar et al. 1989). The period change results appear to suggest that 4U 1954+31 may be rotating close to its equilibrium period, and hence that the neutron star has a very large magnetic field (1015 G). However, the complex behavior exhibited by GX 1+4 indicates that caution should be taken with this interpretation (e.g. Chakrabarty et al. 1997). Additional observations are needed to confirm whether 4U 1954+31 does indeed consistently show spin-down during periods of low flux and more completely quantify the dependence on source luminosity.
5.2.2 Accretion Instability
The 5 hour modulation might alternatively be caused by some type of instability in the accretion flow onto the neutron star. The 5 hour timescale is similar to that of the 3.96 hour quasi-periodic flares observed on one occasion from the Be/neutron star binary EXO 2030+375 (Parmar et al. 1989). As this modulation was only detected once for a brief period we have no information on whether such a modulation might exhibit long term period changes such as shown by 4U 1954+31. Therefore, although this model cannot yet be definitely excluded, its transient appearance in only one other source may make it a less likely explanation.
5.2.3 Variations in the Mass Donor
The interpretation of the 2.7 hour period in 2S 0114+650 as a neutron star rotation period has been questioned by Koenigsberger et al. (2006) who propose that the period comes from tidal interactions which drive oscillations in the B supergiant primary. However, an explanation of the 5 hour period in 4U 1954+31 as a pulsation in the mass donor appears problematic as the fundamental pulsation periods of M giants are very long and there is little evidence for pulsations on periods less than 10 days (Percy et al. 2001, Koen et al. 2002). We therefore exclude this model as a possible explanation of the 5 hour periodicity.
5.3 Summary of Models
The persistence of the 5 hour period over an extended length of time, the change in period consistent with accretion torque, and lack of any other periodicity in the light curve that could be a pulse period, all suggest that the 5 hour period is a neutron star rotation period. However, an EXO 2030+375 type instability is not yet completely ruled out.
6 Conclusion
The three symbiotic X-ray binaries considered here show substantial X-ray variability on long time scales, dominated by the presence of slow flares. In none of the systems does the long term X-ray flux show detectable orbital modulation and there is no evidence for modulation at any of the previously reported periods. Any accretion rate variations caused by modulation in an eccentric orbit appear to be much less than that which occurs during the non-periodic flares.
In contrast, on shorter timescales two of the three sources, GX 1+4 and 4U 1954+31, exhibit periodic modulation that appears to come from a neutron star rotation period. This, together with the pulsations shown by Sct X-1 and 1RXS J180431.1-273932, suggests that further observations of 4U 1700+24, preferably during an outburst, might also reveal a pulsation period in this source. Additional observations of 4U 1954+31 should help to better constrain the nature of the 5 hour modulation by showing whether this is a persistent feature of the light curve and, if so, how the period changes on long timescales in response to varying accretion rates.
References
- (1)
- (2) Barthelmy, S.D., Barbier, L.M., Cummings, J.R., Fenimore, E.E., Gehrels, N., Hullinger, D., Krimm, H.A., Markwardt, C.B., Palmer, D.M., Parsons, A., Sato, G., Suzuki, M., Takahashi, T., Tashiro, M., & Tueller, J. 2005, Space Science Reviews, 120, 143
- (3)
- (4) Bird, A.J., et al., 2006, ApJ, 636, 765
- (5)
- (6) Chakrabarty, D., & Roche, P. 1997, ApJ, 489, 254
- (7)
- (8) Chakrabarty, D., Bildsten, L., Finger, M. H., Grunsfeld, J. M., Koh, D. T., Nelson, R. W., Prince, T. A., Vaughan, B. A., & Wilson, R. B. 1997, ApJ, 481, L101
- (9)
- (10) Cook, M.C., Warwick, R.S., & Watson, M.G. 1984, in “X-ray Astronomy ’84”, ed. M. Oda & R. Giacconi, p. 225
- (11)
- (12) Corbet, R.H.D., Finley, J.P., & Peele, A.G. 1999, ApJ, 511, 876
- (13)
- (14) Corbet, R., Barbier, L., Barthelmy, S., Cummings, J., Fenimore, E., Gehrels, N., Hullinger, D., Krimm, H., Markwardt, C., Palmer, D., Parsons, A., Sakamoto, T., Sato, G., & Tueller, J. 2006, ATEL #797
- (15)
- (16) Corbet, R.H.D., Markwardt, C.B., & Tueller, J. 2007a, ApJ, 655, 458
- (17)
- (18) Corbet, R., Markwardt, C., Barbier, L., Barthelmy, S., Cummings, J., Gehrels, N., Krimm, H., Palmer, D., Sakamoto, T., Sato, T., & Tueller, J., 2007b, proceedings of ”The Extreme Universe in the Suzaku Era”, Kyoto, Japan, December 4-8, 2006. Progress of Theoretical Physics, Supplement. arXiv:astro-ph/0703274v1
- (19)
- (20) Cutler, E. P., Dennis, B. R., & Dolan, J. F. 1986, ApJ, 300, 551
- (21)
- (22) Davidsen, A., Malina, R., & Bowyer, S. 1977, ApJ, 211, 866
- (23)
- (24) De Luca, A., Caraveo, P. A., Mereghetti, S., Tiengo, A., & Bignami, G. F. 2006, Science, 313, 814
- (25)
- (26) Farrell, S.A., O’Neill, P.M., & Sood, R.K. 2005, PASA, 22, 267
- (27)
- (28) Farrell, S.A., Sood, R.K., & O’Neill, P.M. 2006, MNRAS, 367, 1457
- (29)
- (30) Ferrigno, C., Segreto, A., Santangelo, A., Wilms, J., Kreykenbohm, I., Denis, M., & Staubert, R., 2007, A&A, 462, 995
- (31)
- (32) Finley, J. P., Belloni, T., & Cassinelli, J. P. 1992, A&A, 262, L25
- (33)
- (34) Galloway, D.K., Sokoloski, J. L., & Kenyon, S. J. 2002, ApJ, 580, 1065
- (35)
- (36) Garcia, M., Baliunas, S. L., Elvis, M., Fabbiano, G., Patterson, J., Schwartz, D., Doxsey, R., Koenigsberger, G., Swank, J., & Watson, M. G. 1983, ApJ, 267, 291
- (37)
- (38) Ghosh, P., & Lamb, F.K., 1979, ApJ, 234, 296
- (39)
- (40) Glass, I.S., & Feast, M.W. 1973, Nature Physical Science, 245, 39
- (41)
- (42) Hill, R., Burginyon, G., Grader, R., Toor, A., Stoering, J., & Seward, F. 1974, ApJ, 189, L69
- (43)
- (44) Hinkle, K. H., Fekel, F. C., Joyce, R. R., Wood, P. R., Smith, V. V., & Lebzelter, T. 2006, ApJ, 641, 479
- (45)
- (46) Iben, I., & Tutukov, A.V. 1996, ApJS, 105, 145
- (47)
- (48) Joss, P.C., & Rappaport, S. 1984, ARA&A, 22, 537
- (49)
- (50) Kaplan, D. L., Levine, A. M., Chakrabarty, D., Morgan, E. H., Erb, D. K., Gaensler, B. M., Moon, D. -S., & Cameron, P. B. 2007, ApJ, in press (arXiv:astro-ph/0701092)
- (51)
- (52) Koen, C., Laney, D., & van Wyk, F. 2002, MNRAS, 335, 223
- (53)
- (54) Koenigsberger, G., Georgiev, L., Moreno, E., Richer, M.G., Toledano, O., Canalizo, G., & Arrieta, A. 2006, A&A, 458, 513
- (55)
- (56) Kouveliotou, C., Patel, S., Tennant, A., Woods, P., Finger, M., & Wachter, S. 2003, IAUC 8109
- (57)
- (58) Koyama, K., Kunieda, H., Takeuchi, Y., & Tawara, Y., Takeuchi, Y., & Tawara, Y. 1991, ApJ, 370, L77
- (59)
- (60) Levine, A.M., Bradt, N., Cui, W., Jernigan, J.G., Morgan, E.H., Remillard, R., Shirey, R.E., & Smith, D.A. 1996, ApJ, 469, L33
- (61)
- (62) Lewin, W.H.G., Ricker, G.R., & McClintock, J.E. 1971, ApJ, 169, L17
- (63)
- (64) Makino, F. 1988, IAUC 4679
- (65)
- (66) Makishima, K., Ohashi, T., Sakao, T., Dotani, T., Inoue, H., Koyama, H., Makino, F., Mitsuda, K., Nagase, F., Thomas, H. D., Turner, M. J. L., Kii, T., & Tawara, Y., 1988, Nature, 333, 746
- (67)
- (68) Markwardt, C.B., Tueller, J., Skinner, G.K., Gehrels, N., Barthelmy, S.D., & Mushotzky, R.F. 2005, ApJ, 633, L77
- (69)
- (70) Masetti, N., Dal Fiume, D., Cusumano, G., Amati, L., Bartolini, C., Del Sordo, S., Frontera, F., Guarnieri, A., Orlandini, M., Palazzi, E., Parmar, A. N., Piccioni, A., & Santangelo, A. 2002, A&A, 382, 104
- (71)
- (72) Masetti, N., Orlandini, M., Palazzi, E., Amati, L., & Frontera, F. 2006, A&A, 453, 295
- (73)
- (74) Masetti, N., Rigon, E., Maiorano, E., Cusumano, G., Palazzi, E., Orlandini, M., Amati, L., & Frontera, F. 2007a, A&A, 464, 277
- (75)
- (76) Masetti, N., Landi, R., Pretorius, M. L., Sguera, V., Bird, A. J., Perri, M., Charles, P. A., Kennea, J. A., Malizia, A., & Ubertini, P. 2007b, A&A, 470, 331
- (77)
- (78) Mason, K.O. 1977, MNRAS, 177, 513
- (79)
- (80) Mattana, F., Götz, D., Falanga, M., Senziani, F., De Luca, A., Esposito, P., & Caraveo, P. A., 2006, A&A, 460, L1
- (81)
- (82) Morgan, W.A. & Garcia, M.R. 2001, PASP, 113, 1386
- (83)
- (84) Nucita, A. A., Carpano, S., & Guainazzi, M., 2007, A&A, 474, L1
- (85)
- (86) Mürset, U., Wolff, B., & Jordan, S. 1997, A&A, 319, 201
- (87)
- (88) Nelson, R. W., Bildsten, L., Chakrabarty, D., Finger, M. H., Koh, D. T., Prince, T. A., Rubin, B. C., Scott, D. M., Vaughan, B. A., Wilson, R. B., 1997, ApJ. 488, 117
- (89)
- (90) Papadakis, I. E., & Lawrence, A., 1993, MNRAS, 261, 612
- (91)
- (92) Parmar, A.N., White, N.E., Stella, L., Izzo, C., & Ferri, P. 1989, ApJ, 338, 359
- (93)
- (94) Patel, S. K., Kouveliotou, C., Tennant, A., Woods, P. M., King, A., Finger, M. H., Ubertini, P., Winkler, C., Courvoisier, T. J.-L., van der Klis, M., Wachter, S., Gaensler, B. M., & Phillips, C. J. 2004, ApJ, 602, L45
- (95)
- (96) Percy, J. R., Wilson, J. B., & Henry, G. W. 2001, PASP, 113, 983
- (97)
- (98) Pereira, M. G., Braga, J., & Jablonski, F. 1999, ApJ, 526, L105
- (99)
- (100) Pereira, M. G., Braga, J., & Jablonski, F. 1999, ApJ, 533, L69
- (101)
- (102) Perna, R., Bozzo, E., & Stella, L. 2006, ApJ, 639, 363
- (103)
- (104) Remillard, R.A., & Levine, A.M. 1997, in All-Sky X-ray Observations in the Next Decade, ed. M. Matsuoka & N. Kawai (Wako: RIKEN), 29
- (105)
- (106) Stephen, J. B., Bassani, L., Malizia, A., Bazzano, A., Ubertini, P., Bird, A. J., Dean, A. J., Lebrun, F., & Walter, R., A&A, 445, 869
- (107)
- (108) Tueller, J., Mushotzky, R.M., Barthelmy, S., Cannizzo, J.K., Gehrels, N., Markwardt, C.B., Skinner, G.K., & Winter, L.M., 2007, ApJ, submitted
- (109)
- (110) Tweedy, R.W., Warwick, R.S., & Remillard, R. 1989, in “Two topics in X-ray astronomy”, volume 1, ed. J. Hunt & B. Battrick, ESA SP-296, p. 61
- (111)
- (112) Vaughan, S. 2005, A&A, 431, 391
- (113)
- (114) Wen, L., Levine, A.M., Corbet, R.H.D., & Bradt, H.V. 2006, ApJS, 163, 372
- (115)
| System | Pspin | Porb | Optical | Spectral | Distance | Mean ASM | Mean BAT |
|---|---|---|---|---|---|---|---|
| (days) | Counterpart | Type | (kpc) | Count Rate | Count Rate | ||
| GX 1+4 | 120 s (C97) | 1161 (H06), [304 (P99)] | V2116 Oph (GF73) | M5 III | 3-6 (CR97) | 1.1 | 1.410-3 |
| 4U 1954+31 | 5 - 5.2 hr (C07) | ? | U1200_13816030 (M06) | M4 III | 1.7 (M06) | 0.7 | 1.110-3 |
| 4U 1700+24 | [900s (MG01)] | [404 (G02)] | HD 154791/V934 Her (M06) | M2 III | 0.42 (M02) | 0.4 | 910-5 |
| Sct X-1 | 111 - 113s (K07) | ? | – | late K/early M I-III | 4 (K07) | 0.2 | – |
| IGR J16194-2810 | ? | ? | U0600_20227091 (M07) | M2 III | 3.7 (M07) | – | – |
| 1RXS J180431.1-273932 | 494 (N07) | ? | OGLE II DIA BUL-SC35-4278 | M6III? | 10? (N07) | – | – |
Note. — (i) Parameters in square brackets are considered to be questionable. (ii) References: C07 - this work, C97 - Chakrabarty et al. (1997), CR97 - Chakrabarty & Roche (1997), G02 - Galloway et al. (2002), GF73 - Glass & Feast (1973), H06 - Hinkle et al. (2006), K07 - Kaplan et al. (2007), M02 - Masetti et al. (2002), M06 - Masetti et al. (2006), M07 - Masetti et al. (2007b), MG01 - Morgan & Garcia (2001), N07 - Nucita et al. (2007), P99 - Pereira et al. (1999). References are not exhaustive and additional references can generally be found within those given. The same references apply to both distance and spectral type.